

Abstract
(Cancer Sci 2010; 101: 666–672)
Overexpression of “stemness gene”Bmi‐1 has been identified in some solid tumors. We investigated Bmi‐1 expression in hepatocellular carcinoma (HCC) and ATP‐binding cassette transporter B1 (ABCB1) as a new potential target for Bmi‐1. Bmi‐1 was highly expressed in HCC cell lines and the most well differentiated cell line, KIM‐1, showed the highest expression. Immunohistochemical, immunocytochemical, and immunoelectron microscopic analysis showed the Bmi‐1 protein as having a high intensity of small dots within the nucleus which reflected concentrated sites of Bmi‐1 repressive activity. Clear “dot‐pattern” staining was observed in 24 of 37 (65%) well differentiated HCC (including 13 of 21 early nodules [62%]), in 32 of 71 (45%) moderately differentiated HCC, and 7 of 14 (50%) poorly differentiated HCC. A similar expression was not observed in non‐cancerous background regions. High Bmi‐1 expression was observed in the early and well differentiated HCC. Furthermore, overexpression and suppression of Bmi‐1 was followed by a respective increase and decrease in ABCB1 expression. As with Bmi‐1, high ABCB1 expression was also observed in the early and well differentiated HCC. A strong correlation between ABCB1 and Bmi‐1 mRNA expression was seen in HCC cell lines and clinical samples (Pearson’s correlation coefficient 0.95 and 0.90, respectively). The Bmi‐1 gene is upregulated in HCC, and in particular is highly expressed in early and well differentiated HCC. The fact that this expression correlated with that of ABCB1 suggests a new regulation target for Bmi‐1, and gives new insight into early hepatocarcinogenesis mechanisms and potential targets for future HCC treatment.
Hepatocellular carcinoma (HCC) is the sixth most common malignancy in the world and still ranks as the third highest cause of cancer‐related death globally.( 1 ) Although individual risks for hepatocarcinogenesis, such as hepatitis viral infection, excessive alcohol intake, and non‐alcoholic steatohepatitis are well established, a poor prognosis of HCC is still unavoidable due to the unclear mechanism of hepatocarcinogenesis. HCC is characterized by a multistage process of tumor progression,( 2 ) and molecular changes, particularly in the early stage of HCC, have rarely been shown. The idea of using stem cell principles to understand tumor development and progression has emerged because they share similar characteristics. Recent reports on cancer stem cells or acquirement of stem cell‐like properties in various tumors have greatly increased the possible connection of these cells in tumorigenesis.( 3 , 4 ) Bmi‐1 was first identified as a proto‐oncogene that cooperates with c‐myc to generate mouse pre‐B cell lymphomas.( 5 ) Some reports show that Bmi‐1 might induce immortalization by regulating human telomerase reverse transcriptase (hTERT) expression,( 6 , 7 , 8 , 9 ) and might play a role in tumorigenesis by acting as a negative regulator of the INK4a/ARF locus that encodes two important tumor suppressors in human cancer, p16 and p19.( 10 , 11 ) The overexpression of Bmi‐1 has been identified in lymphoma( 12 , 13 ) and in a few solid tumors such as lung, colorectal, nasopharyngeal, bladder, and HCC. ( 9 , 14 , 15 , 16 , 17 , 18 ) Many reports mainly focus on Bmi‐1 expression in the advanced stages of cancer and its role in a poor prognosis. However, the exact mechanistic role of Bmi‐1 in tumorigenesis is not clear. In HCC, inactivation of p16 expression, a well‐known target of Bmi‐1, is already observed in the early stages of hepatocarcinogenesis, due to methylation or an epigenetic mechanism.( 19 , 20 ) This suggests that another target in the Bmi‐1 signaling pathway should exist. Therefore, we examined the involvement of the “stemness gene”Bmi‐1 and its new potential downstream target in hepatocarcinogenesis.
To our knowledge, there are no studies clearly showing a subcellular expression pattern of Bmi‐1 as a high intensity of small dots within the nucleus in cancer cells. Herein, we examined the expression patterns of Bmi‐1 in HCC cell lines and clinical specimens by immunohistochemistry, and these were confirmed with immunocytochemistry and immunoelectron microscopy. We also examined the expression levels of the ATP‐binding cassette transporter B1 (ABCB1), listed as one of the genes upregulated after Bmi‐1 induction in bone marrow stromal cells.( 6 ) We hypothesize the potential for ABCB1 to be a new target for Bmi‐1. Immunohistochemical staining and mRNA expression level of ABCB1 were analyzed to investigate the correlation between Bmi‐1 and ABCB1.
Materials and Methods
Cell culture. The human HCC cell lines, PLC/PRF/5 and HepG2, were obtained from the American Type Culture Collection (Manassas, VA, USA). KIM‐1, KYN‐2, and Li7 were established as reported previously.( 21 ) All the cells were grown in RPMI‐1640 medium supplemented with 10% FBS, 100 U/mL penicillin, and 100 μg/mL streptomycin.
Tissue specimens of HCC. HCCs and corresponding non‐cancerous liver tissue were obtained from 100 patients with 122 nodules (37 well differentiated [including 21 early], 71 moderately differentiated, and 14 poorly differentiated HCCs) who underwent surgical resection at Keio University Hospital (Tokyo, Japan) between 2003 and 2006. The specimens were fixed in 10% formalin and embedded in paraffin. Three pathologists evaluated the histological diagnosis according to the criteria set by the World Health Organization.( 22 ) The histological grade for HCC where different types were found within the same nodule was determined by the predominant histological grade. Primary hepatocytes were harvested from the autopsy of a human fetal liver donor with signed, informed consent. The cells were resuspended in growth medium (10% FBS in DMEM, containing 0.1 mM non‐essential amino acid and 0.1 mM sodium pyruvate solution; Gibco BRL, Grand Island, NY, USA), and were maintained at 37°C in a humidified atmosphere containing 95% air and 5% CO2. This study was carried out with the approval of the Ethics Committee of Keio University School of Medicine.
Real‐time quantitative RT‐PCR. Real‐time quantitative RT‐PCR (qRT‐PCR) analysis was carried out as previously reported,( 6 ) at least three times, including a no‐template negative control. A total of 15 (five well differentiated, seven moderately differentiated, and three poorly differentiated) HCC clinical samples were used. The primer sets were: Bmi‐1 forward, 5′‐GAGGGTACTTCATTGATGCCACAAC‐3′ and reverse, 5′‐GCTGGTCTCCAGGTAACGAACAATA‐3′; ABCB1 forward, 5′‐GAGGCCAACATACATGCCTTCA‐3′ and reverse, 5′‐GGCTGTCTAACAAGGGCACGA‐3′.
Immunohistochemical and immunocytochemical analysis. Immunohistochemical staining was done on formalin‐fixed, paraffin‐embedded tissue sections. These were heated at 120°C in 0.01 mol/L sodium citrate buffer, pH 7.0, for 10 min before incubation with a mouse Bmi‐1 antibody (1/200; Upstate Biotechnology, Lake Placid, NY, USA) and a multidrug resistance protein 1 (MDR1) antibody (1/200; Santa Cruz Biotechnology, Santa Cruz, CA, USA). Sections were then incubated with ImmPRESS antimouse Ig kit secondary antibody (Vector Laboratories, Burlingame, CA, USA), and stained with diaminobenzidine. For immunocytochemical analysis, KIM‐1 cells were grown to confluence on glass slides, fixed, and washed. The slides were incubated with the Bmi‐1 antibody (1/200) in PBS containing 1% BSA, followed by FITC‐conjugated, antimouse Ig (1/400; Dako, Glostrup, Denmark). Staining was evaluated using the LSM 510 Meta confocal microscope (Carl Zeiss, Oberkochen, Germany). All staining analysis was done at least twice. We defined Bmi‐1 staining criteria as follows: distributed diffusely with clear staining of the “dot‐pattern” was scored 2+; distributed focally with weak staining of the dot‐pattern was scored 1+; and an absence of the dot‐pattern was considered negative. Evaluation criteria for ABCB1 were defined as follows: clear staining of irregular canalicular with cytoplasmic staining scored 2+; an irregular canalicular staining pattern scored 1+; and no staining was considered negative.
Immunoelectron microscopy. KIM‐1 cells grown to confluence on glass slides were fixed in 4% formaldehyde and incubated overnight at 4°C with the Bmi‐1 antibody (1/200). After rinsing they were treated with a mouse secondary antibody (1/100; Dako) for 3 h at room temperature, then re‐fixed in 1% glutaraldehyde for 10 min. After further rinsing, the sections were stained with diaminobenzidine and post‐fixed in 2% osmium tetroxide. The slides were dehydrated in graded alcohol, embedded in epoxy resin, and hardened at 60°C for 72 h. Ultrathin sections were cut with an ultramicrotome, stained with uranyl acetate and viewed under a JEOL 1200 EXII transmission electron microscope (Nihon Denshi, Tokyo, Japan).
Immunoblotting. PLC/PRF/5, HepG2, KIM‐1, KYN‐2, and Li7 cells were lysed in lysis buffer (50 mM Tris‐HCL [pH 7.5], 150 mM NaCl, 5 mM EDTA, 1% NP‐40, and complete protease inhibitors). Supernatants of the homogenates were subjected to NuPAGE (4–12% Bis‐Tris gel; Invitrogen, Carlsbad, CA, USA) by electrophoresis, and transferred to PVDF membranes. Anti‐Bmi‐1 (1/500), anti‐MDR1 (1/200), and anti‐actin (1/1000; Sigma, St Louis, MO, USA) were hybridized to the membranes and detected with ECL Western blotting detection reagents (GE Healthcare, Amersham, UK).
Transfection‐induced overexpression and RNA inter‐ference. Human Bmi‐1 full coding cDNA was cloned from the KIM‐1 cell line with RT‐PCR and inserted into pcDNA53 (Invitrogen). This vector was transfected into the primary fetal hepatocytes using Lipofectamine LTX and positive expression vector‐transfected cells were selected with G418 (Invitrogen), according to the manufacturer’s instructions. For RNA interference, all purified and pre‐annealed siRNA molecules were obtained from Takara Bio (Shiga, Japan). Two siRNA molecules were used, siBmi‐1#1 and siBmi‐1#2, with the targeted sequences 5′‐AACAAUAACGAAUAGAAUUGA‐3′ and 5′‐AAGAAUUAUAACUGAUGAUGA‐3′, respectively. Control (non‐targeting sequence), unmodified siRNA duplex was also purchased from Takara Bio.
Statistical analysis. Data are expressed as mean ± SEM. The χ2‐test was used when appropriate to determine the correlations between clinicopathological variables and Bmi‐1 expression. The relative mRNA expression levels were compared using the unpaired t‐test, and the Pearson’s correlation coefficient test was also used. Statistical significance was defined as P < 0.05. All statistical analyses were carried out using Statcel software version 2.0 (OSM, Tokyo, Japan).
Results
Bmi‐1 expressed in HCC cell lines and distributed in high intensity, dot‐pattern expression in nucleus. To assess the potential role of Bmi‐1 in hepatocarcinogenesis, we examined Bmi‐1 expression in five human HCC cell lines using qRT‐PCR and Western blot analysis. Bmi‐1 was highly expressed at both the mRNA and protein level. The most well differentiated HCC cell line, KIM‐1, showed at least a three‐fold higher level of expression of Bmi‐1, compared with the other cell lines (Fig. 1A). As a transcriptional repressor, Bmi‐1 activity is expected in the nucleus, and we found Bmi‐1 protein enrichment in the nuclear fraction compared with the whole lysates (data not shown). Immunohistochemistry, immunocytochemistry, and immunoelectron microscopic of the KIM‐1 cells showed that the Bmi‐1 protein was distributed in high‐intensity aggregates within the nucleus (Fig. 1B–D). These results confirmed localization of the Bmi‐1 protein in the nucleus, with a dot‐pattern appearance.
Figure 1.
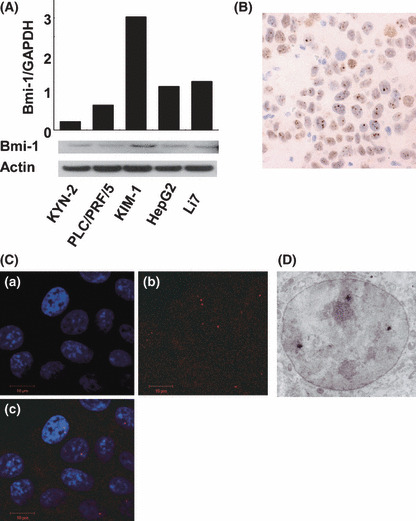
Bmi‐1 expression in hepatocellular carcinoma (HCC) cell lines. (A) Quantitative real‐time‐ PCR and Western blot of Bmi‐1 in HCC cell lines. Bmi‐1 is significantly expressed in the KIM‐1 cell line compared with other cell lines. Nuclear fraction proteins were used in the Western blot analysis. Immunohistochemistry (B) and immunocytochemistry (C) of KIM‐1 cells. Bmi‐1 was diffusely distributed intra‐nuclearly (a, DAPI: blue; b, anti‐Bmi‐1: red; c, merged). (D) Immunoelectron micrograph of KIM‐1. Bmi‐1 particles are shown as small black dots inside the nucleus.
Bmi‐1 expressed in HCC clinical samples, particularly in early stage hepatocarcinogenesis. We evaluated Bmi‐1 protein expression in 122 HCC nodules (37 well differentiated [including 21 early nodules], 71 moderately, and 14 poorly differentiated HCCs). As with Bmi‐1 expression in the HCC cell lines, Bmi‐1 expression in clinical samples was observed as small dots distributed inside the nucleus (Fig. 2A), but the Bmi‐1 dot‐pattern expression was not observed in the surrounding liver tissue (Fig. 2B). There was no correlation between expression of Bmi‐1 and clinicopathological parameters, such as age, gender, portal involvement, intrahepatic metastasis, etiology, or non‐cancerous background liver tissue. However, Bmi‐1 positive expression was significantly associated with well (including early) differentiated HCC (P = 0.023) (Table 1). A 2+ score was observed in 24 of the 37 (65%) well differentiated HCCs (including 13 of the 21 early nodules [62%]), 32 of the 71 (45%) moderately differentiated HCCs, and 7 of the 14 (50%) poorly differentiated HCCs. In contrast, negative expression was observed in only 2 of the 37 (5%) well differentiated HCCs (including 2 of the 21 early nodules [10%]), 15 of the 71 (21%) moderately differentiated HCCs, and 4 of the 14 (29%) poorly differentiated HCCs (Table 2). Interestingly, a higher level of Bmi‐1 expression was observed in the early and well differentiated HCCs, and this declined with the progression of HCC. Similar findings were found using qRT‐PCR from clinical tissue samples. Strongly positive Bmi‐1 expression was observed in the five well differentiated HCC cases, compared with the seven moderately differentiated cases and the three poorly differentiated HCC cases (Fig. 2C). The average level of Bmi‐1 expression was significantly higher in tumor tissue compared with the non‐cancerous background liver tissue (2.23 vs 0.86; P = 0.002).
Figure 2.
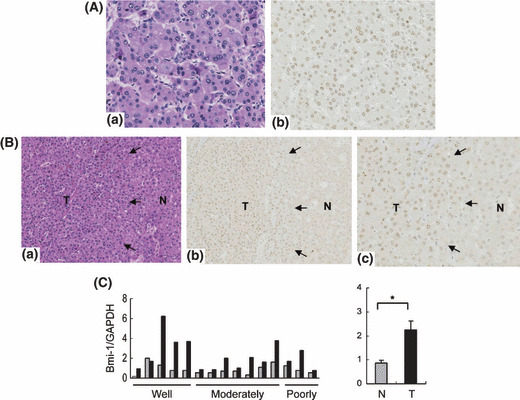
Bmi‐1 expression in hepatocellular carcinoma (HCC) clinical samples. (A) Immunostaining of Bmi‐1 in moderately differentiated HCC. Magnification, ×200. A clear dot‐pattern of Bmi‐1 was distributed diffusely in the tumor region. (B) Boundary region of well differentiated HCC (a, H&E stain; b, corresponding Bmi‐1 staining, magnification ×100; c, magnification ×200). Bmi‐1 expression was observed in the tumor region but not in surrounding liver tissue. Black arrows outline the border between the non‐cancerous background region (N) and the tumor region (T). (C) Bmi‐1 mRNA expression levels in HCC clinical cases. The relative mRNA expression levels in tumor tissues (black bar, T) and corresponding non‐cancerous, background liver tissues (gray bar, N) (left panel). High Bmi‐1 expression was observed in well differentiated HCC. The average expression level of Bmi‐1 was significantly higher in tumor tissues than in non‐cancerous, background liver tissues (2.23 vs 0.86; *P = 0.002) (right panel).
Table 1.
Characteristics of 122 hepatocellular carcinoma nodules on the basis of Bmi‐1 immunostaining
| Characteristics | Bmi‐1 expression | P value | |
|---|---|---|---|
| 2+/1+ | − | ||
| No. of nodules | 101 | 21 | 0.339 |
| Mean age (years) | 62.7 | 60.2 | NA |
| Gender | |||
| Male | 88 | 15 | NA |
| Female | 13 | 6 | |
| Tumor size (cm) | |||
| <2 | 37 | 6 | 0.482 |
| ≥2 | 64 | 15 | |
| Differentiation | |||
| Well (early) | 35 (19) | 2 (2) | 0.023* |
| Moderately/poorly | 66 | 19 | |
| Portal involvement | |||
| − | 54 | 9 | 0.376 |
| + | 47 | 12 | |
| Intrahepatic metastasis | |||
| − | 80 | 14 | 0.214 |
| + | 21 | 7 | |
| Etiology | |||
| Hepatitis B virus | 21 | 7 | NA |
| Hepatitis C virus | 61 | 12 | |
| Non‐B / Non‐C | 19 | 2 | |
| Non‐cancerous liver | |||
| Liver cirrhosis | 51 | 10 | 0.810 |
| Others | 50 | 11 | |
*P < 0.05. −, absence of dot‐pattern staining; 1+, distributed focally with weak dot‐pattern staining; 2+, distributed diffusely with clear dot‐pattern staining; NA, not available.
Table 2.
Immunohistochemical analysis of Bmi‐1 expression in hepatocellular carcinoma (HCC) (n = 122)
| Histology | Bmi‐1 staining score | ||
|---|---|---|---|
| 2+ | 1+ | − | |
| Well differentiated HCC (n = 37) | 24 (65%) | 11 (30%) | 2 (5%) |
| Early HCC (n = 21) | 13 (62%) | 6 (29%) | 2 (10%) |
| Moderately differentiated HCC (n = 71) | 32 (45%) | 24 (34%) | 15 (21%) |
| Poorly differentiated HCC (n = 14) | 7 (50%) | 3 (21%) | 4 (29%) |
−, absence of dot‐pattern staining; 1+, distributed focally with weak dot‐pattern staining; 2+, distributed diffusely with clear dot‐pattern staining.
Bmi‐1 expression linked to ABCB1 expression. We have previously analyzed gene expression profiles after Bmi‐1 induction in bone marrow stromal cells.( 6 ) Among the genes upregulated we found that the ABCB1 gene was upregulated together with the overexpression of Bmi‐1, compared with the control parental cells (T. Mori et al., unpublished observation, 2004). To further verify the regulation of ABCB1 we looked at changes in ABCB1 expression during transient overexpression of Bmi‐1 using primary fetal hepatocytes. Following Bmi‐1 overexpression, relative mRNA levels of ABCB1 in primary fetal hepatocytes were increased threefold (Fig. 3A). Bmi‐1 knockdown also led to a downregulation of ABCB1 expression in the KIM‐1 HCC cell line (Fig. 3B), however, decreased ABCB1 expression was not very significant, which might be due to the presence of Bmi‐1‐independent ABCB1 expression. These results suggest a parallel association between Bmi‐1 and ABCB1 expression in HCC cell lines and hepatocytes.
Figure 3.
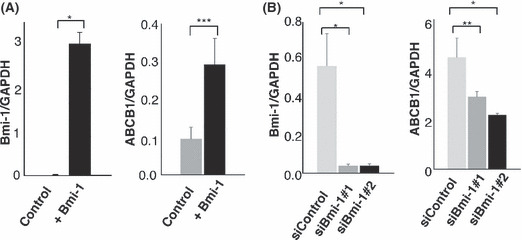
Overexpression and silencing of Bmi‐1 expression affected ATP‐binding cassette transporter B1 (ABCB1) expression in primary fetal hepatocytes and a hepatocellular carcinoma (HCC) cell line. (A) Bmi‐1 overexpression in primary fetal hepatocytes resulted in increased ABCB1 expression, compared with the mock‐transduced control (*P < 0.01; ***P = 0.038). (B) Silencing of Bmi‐1 expression by two different siRNAs (#1 and #2) in KIM‐1 cells was followed by a decrease in ABCB1 expression (*P < 0.01; **P = 0.08). Error bars were derived from three independent experiments.
ABCB1 expression in HCC cell lines and HCC clinical samples correlated with Bmi‐1 expression. We further evaluated ABCB1 expression in HCC cell lines and clinical samples. As with Bmi‐1, the highest levels of ABCB1 mRNA and protein expression were observed in KIM‐1 cells, relative to the other cell lines. ABCB1 mRNA expression level in tumor tissue is not significantly higher compared with non‐cancerous background liver tissue due to its normal expression in non‐cancerous background liver tissue, however, there is a tendency for higher expression level of ABCB1 in well differentiated cases (2.30 vs 1.53; P = 0.21) (Fig. S1a,b). We found a strong statistical correlation between ABCB1 and Bmi‐1 mRNA expression with the Pearson’s correlation coefficient being 0.95 and 0.90 for HCC cell lines and HCC clinical samples, respectively (Fig. 4A,B). Immunohistochemical staining of ABCB1 showed both cytoplasmic and a canalicular staining pattern in the tumor region. Although the canalicular staining pattern was also seen in the surrounding non‐cancerous region, the pattern was more irregular and thicker (Fig. S1c,d). A 2+ score was observed in 29 of 37 (78%) well differentiated HCCs (including 18 of 21 early differentiated nodules [86%]), in 50 of 71 (70%) moderately differentiated HCCs, and in 10 of 14 (71%) poorly differentiated HCCs. Negative expression was observed in 1 of 37 (3%) well differentiated HCCs (no early nodules had negative expression), in 5 of 71 (7%) moderately differentiated HCCs, and in 3 of 14 (21%) poorly differentiated HCCs (Table 3). As expected, ABCB1 expression was also higher in the well differentiated HCCs. There was a correlation in ABCB1 and Bmi‐1 staining (Fig. 4C), and 50 of 122 (41%) cases showed strong expression of both Bmi‐1 and ABCB1 (Table 4).
Figure 4.
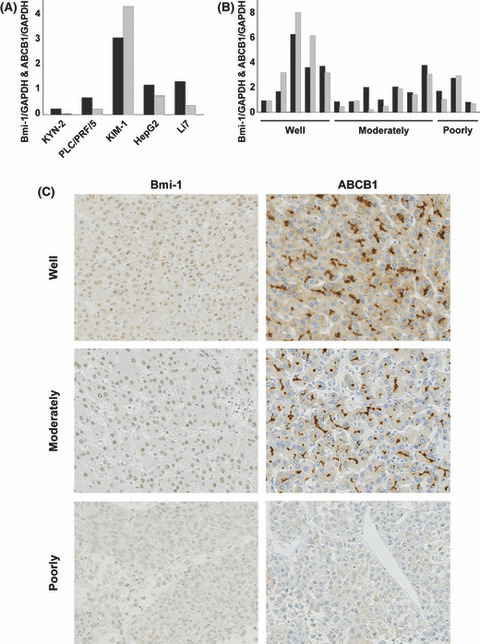
Correlation and immunostaining of Bmi‐1 and ATP‐binding cassette transporter B1 (ABCB1) expression in hepatocellular carcinoma (HCC). (A and B) Evaluation of Bmi‐1 and ABCB1 mRNA expression in HCC cell lines and HCC clinical samples. A strong correlation between Bmi‐1 and ABCB1 expression was observed in HCC cell lines and clinical samples by the Pearson’s correlation coefficient test (0.95, P = 0.01; and 0.90, P < 0.01, respectively) (black column, Bmi‐1; gray column, ABCB1). (c) Bmi‐1 and ABCB1 expression in early, moderately, and poorly differentiated HCC (magnification, ×200). Clear staining of Bmi‐1 “dot‐pattern” (scored as 2+), and a canalicular and cytoplasmic ABCB1 staining pattern (scored as 2+), was observed in well differentiated HCC. Bmi‐1 expression appeared weaker (scored as 1+), and only a canalicular staining pattern of ABCB1 (scored as 1+), was seen in moderately differentiated HCC. No dot‐pattern of Bmi‐1 and an absence of ABCB1 staining were observed in poorly differentiated HCC (scored as negative). Both Bmi‐1 and ABCB1 expression decreased with the progression of HCC, suggesting their correlated expression.
Table 3.
Immunohistochemical analysis of ATP‐binding cassette transporter B1 (ABCB1) expression in hepatocellular carcinoma (HCC) (n = 122)
| Histology | ABCB1 staining score | ||
|---|---|---|---|
| 2+ | 1+ | − | |
| Well differentiated HCC (n = 37) | 29 (78%) | 7 (19%) | 1 (3%) |
| Early HCC (n = 21) | 18 (86%) | 3 (14%) | 0 (0%) |
| Moderately differentiated HCC (n = 71) | 50 (70%) | 16 (23%) | 5 (7%) |
| Poorly differentiated HCC (n = 14) | 10 (71%) | 1 (7%) | 3 (21%) |
−, no staining; 1+, irregular canalicular staining pattern; 2+, clear staining of irregular canalicular with cytoplasmic staining.
Table 4.
Combined immunohistochemical analysis of Bmi‐1 and ATP‐binding cassette transporter B1 (ABCB1) expression in hepatocellular carcinoma
| ABCB1 staining score Bmi‐1 staining score | 2+ | 1+ | − |
|---|---|---|---|
| 2+ | 50 (41%) | 12 (10%) | 1 (1%) |
| 1+ | 28 (23%) | 7 (6%) | 3 (2%) |
| − | 11 (9%) | 5 (4%) | 5 (4%) |
ABCB1 staining scores: −, no staining; 1+, irregular canalicular staining pattern; 2+, clear staining of irregular canalicular with cytoplasmic staining. Bmi‐1 staining scores: −, absence of dot‐pattern staining; 1+, distributed focally with weak dot‐pattern staining; 2+, distributed diffusely with clear dot‐pattern staining.
Discussion
Following the identification of Bmi‐1 overexpression in solid tumors,( 9 , 14 , 15 , 16 ) some studies have also reported the overexpression of Bmi‐1 in HCC.( 17 , 18 , 23 ) However, the Bmi‐1 localization area and whether Bmi‐1 is highly expressed in the early or late progression of HCC is still controversial. In this study, high levels of Bmi‐1 expression were observed in early HCC, and we carefully describe the specific subcellular expression of Bmi‐1 within the nucleus. We believe that as a transcriptional repressor, Bmi‐1 activity is expected to occur inside the nucleus.( 10 , 24 , 25 ) Moreover, we found a correlation in the expression of Bmi‐1 and ABCB1 suggesting that ABCB1 might present a novel downstream target for Bmi‐1.
Bmi‐1 belongs to the Polycomb gene group (PcG) involved in maintaining target genes in their transcriptional state. A possible mechanism of PcG‐mediated repression is the recruitment of certain regulatory factors, or chromatin‐modifying activities, into a unique nuclear domain which results in inhibiting chromatin remodeling required for the transcriptional process.( 24 ) Indeed, there is evidence showing that 3D imaging of PcG proteins in Drosophila embryos shows distribution of PcG complexes throughout the nuclear volume as discrete loci, which might reflect sites of repressive complexes.( 25 ) In accordance with previous reports, we observed that Bmi‐1 was expressed as high‐intensity, small aggregates distributed inside the nucleus in the HCC region. The Bmi‐1 dots appeared in different parts of the nucleus, often very near to or partially coincident with heterochromatin. These findings support the indication of Bmi‐1 function as a gene transcriptional repressor by regulating chromatin silencing. Regarding this immunohistochemical staining dot‐pattern as a positive expression of Bmi‐1, we found high levels of Bmi‐1 expression in well (included early) differentiated HCCs, whereas similar expression was not observed in the corresponding non‐cancerous background hepatocytes.
The Bmi‐1 signaling pathway is one of the candidates that might, in part, govern stem cell fate, and acquirement of its “stemness” function has been linked to neoplastic proliferation.( 4 , 26 ) The ability of Bmi‐1 to promote tumorigenesis and bypass senescence through regulation of p16 and hTERT expression( 6 , 7 , 8 , 9 ) suggests a potential role of Bmi‐1 in initiating hepatocarcinogenesis and immortalization of the hepatocyte. Low levels of p16 expression and increased activation of hTERT have also been reported in HCC, including in early HCC.( 19 , 27 , 28 ) We observed high levels of Bmi‐1 expression in early HCC, which might indicate an indispensable function for Bmi‐1 in the early development of cancer. Bmi‐1 expression was also observed in progressed HCC, however, the expression level was not as high as in early HCC. This findings suggested de novo tumor development pathways as well as indicated another functional role of Bmi‐1 in progressed HCC. Although it is clear that Bmi‐1 plays a role in keeping self‐renewal ability and proliferation, the exact molecular mechanism of Bmi‐1 in early hepatocarcinogenesis remains unclear. Inactivation of p16 expression by methylation or epigenetic mechanisms has already been observed as an early event in the early stage of hepatocarcinogenesis.( 19 , 20 ) Moreover, some studies show that a p16 deficiency does not fully restore the self‐renewal capability of Bmi‐1. In addition, reduced stem cell frequency occurs in Bmi‐1‐deficient neural stem cells, even when p16Ink4a and p19Arf are not expressed.( 4 , 29 , 30 ) These studies indicate that there are additional downstream pathways that might mediate the effect of Bmi‐1 on self‐renewal and cell proliferation.
From our gene expression analysis, we found that induction of Bmi‐1 in bone marrow cells resulted in an upregulation of ABCB1.( 6 ) ABCB1 appears to be a consistent feature of mammalian cells displaying resistance to multiple anticancer drugs, and has been postulated to mediate drug resistance.( 31 , 32 ) Interestingly, recent findings also show expression of ABCB1 in various stem cells,( 33 , 34 , 35 ) which might make them less sensitive to cancer treatment. Increased expression of ABCB1 was observed in HCC, particularly in early and well differentiated HCC, compared with the surrounding non‐cancerous region. ABCB1 expression decreases with the progression of HCC, suggesting a reflection of tumor dedifferentiation.( 36 ) We showed here that ABCB1 expression was clearly altered in parallel with Bmi‐1 expression. High expression of both Bmi‐1 and ABCB1 was observed in the early stage of hepatocarcinogenesis, which suggests their collaboration in maintaining the cell’s ability for self‐renewal, proliferation, and increased resistance from apoptosis. Although it is possible that ABCB1 represents a novel downstream target for Bmi‐1, further analysis is necessary to clarify the mechanism underlying the link between Bmi‐1 and ABCB1 expression.
In summary, we evaluated the expression and involvement of the “stemness” gene, Bmi‐1, in HCC, particularly in early stage hepatocarcinogenesis. The strong correlation observed between Bmi‐1 and ABCB1 expression in HCC indicates a new regulatory pathway for Bmi‐1, and reveals a potential novel target for enhancing future HCC treatment strategies.
Supporting information
Fig. S1. ATP‐binding cassette transporter B1 (ABCB1) expression in hepatocellular carcinoma (HCC) cell lines and clinical samples. (a) Quantitative real‐time PCR and Western blot of ABCB1 in HCC cell lines. Expression of ABCB1 was significantly higher in KIM‐1 cells compared with the other cell lines. (b) ABCB1 mRNA expression levels in HCC clinical cases. The relative mRNA expression levels in tumor tissues (black column, T) and corresponding non‐cancerous, background liver tissues (gray column, N) (left panel). High levels of ABCB1 expression were observed in well differentiated HCC. The average expression levels of ABCB1 were higher in tumor tissues than in the non‐cancerous background liver tissues (2.30 vs. 1.23, P = 0.21) (right panel). (c) Immunostaining of ABCB1 in well differentiated HCC. An irregular and thicker form of canalicular pattern with cytoplasmic staining was observed in the tumor region compared with the non‐cancerous background region (magnification, ×100). Black arrows outline the border between the non‐cancerous background region (N) and the tumor region (T). (d) ABCB1 expression in moderately differentiated HCC (magnification, ×200). Only an irregular canalicular pattern was observed (a, H&E stain; b, corresponding ABCB1 staining).
Please note: Wiley‐Blackwell are not responsible for the content or functionality of any supporting materials supplied by the authors. Any queries (other than missing material) should be directed to the corresponding author for the article.
Supporting info item
Acknowledgments
This work was supported in part by a Keio University Grant‐in‐Aid for Encouragement of Young Medical Scientists. Grant‐in‐aid for Young Scientists (B) from the Ministry of Education, Culture, Sports, Science, and Technology of Japan to T.M.; Grants for the Health Labour Sciences Research and the Third Term Comprehensive 10‐Year Strategy for Cancer Control from the Ministry of Health, Labor and Welfare of Japan; Grant‐in‐aid for Scientific Research on Priority Areas from the Ministry of Education, Culture, Sports, Science, and Technology of Japan to M.S. Our sincere thanks to H. Suzuki, H. Abe, S. Kusakari, N Hashimoto, M. Konno, and T. Nagai for support throughout the work, M. Fujiwara and M. Iwata, for providing technical assistance, and also Dr. Toru Kiyono (Virology Division, National Cancer Center Research Institute of Japan).
References
- 1. Parkin DM, Bray F, Ferlay J, Pisani P. Global cancer statistics, 2002. CA Cancer J Clin 2005; 55: 74–108. [DOI] [PubMed] [Google Scholar]
- 2. Sakamoto M, Hirohashi S, Shimosato Y. Early stages of multistep hepatocarcinogenesis: adenomatous hyperplasia and early hepatocellular carcinoma. Hum Pathol 1991; 22: 172–8. [DOI] [PubMed] [Google Scholar]
- 3. Reya T, Morrison SJ, Clarke MF, Weissman IL. Stem cells, cancer, and cancer stem cells. Nature 2001; 414: 105–11. [DOI] [PubMed] [Google Scholar]
- 4. Pardal R, Clarke MF, Morrison SJ. Applying the principles of stem‐cell biology to cancer. Nat Rev Cancer 2003; 3: 895–902. [DOI] [PubMed] [Google Scholar]
- 5. Van Lohuizen M, Verbeek S, Scheijen B, Wientjens E, Van Der Gulden H, Berns A. Identification of cooperating oncogenes in E mu‐myc transgenic mice by provirus tagging. Cell 1991; 65: 737–52. [DOI] [PubMed] [Google Scholar]
- 6. Mori T, Kiyono T, Imabayashi H et al. Combination of hTERT and bmi‐1, E6, or E7 induces prolongation of the life span of bone marrow stromal cells from an elderly donor without affecting their neurogenic potential. Mol Cell Biol 2005; 25: 5183–95. [DOI] [PMC free article] [PubMed] [Google Scholar]
- 7. Haga K, Ohno S, Yugawa T et al. Efficient immortalization of primary human cells by p16INK4a‐specific short hairpin RNA or Bmi‐1, combined with introduction of hTERT. Cancer Sci 2007; 98: 147–54. [DOI] [PMC free article] [PubMed] [Google Scholar]
- 8. Dimri GP, Martinez JL, Jacobs JJ et al. The Bmi‐1 oncogene induces telomerase activity and immortalizes human mammary epithelial cells. Cancer Res 2002; 62: 4736–45. [PubMed] [Google Scholar]
- 9. Song LB, Zeng MS, Liao WT et al. Bmi‐1 is a novel molecular marker of nasopharyngeal carcinoma progression and immortalizes primary human nasopharyngeal epithelial cells. Cancer Res 2006; 66: 6225–32. [DOI] [PubMed] [Google Scholar]
- 10. Jacobs JJ, Kieboom K, Marino S, DePinho RA, Van Lohuizen M. The oncogene and Polycomb‐group gene bmi‐1 regulates cell proliferation and senescence through the ink4a locus. Nature 1999; 397: 164–8. [DOI] [PubMed] [Google Scholar]
- 11. Jacobs JJ, Scheijen B, Voncken JW, Kieboom K, Berns A, Van Lohuizen M. Bmi‐1 collaborates with c‐Myc in tumorigenesis by inhibiting c‐Myc‐induced apoptosis via INK4a/ARF. Genes Dev 1999; 13: 2678–90. [DOI] [PMC free article] [PubMed] [Google Scholar]
- 12. Van Kemenade FJ, Raaphorst FM, Blokzijl T et al. Coexpression of BMI‐1 and EZH2 polycomb‐group proteins is associated with cycling cells and degree of malignancy in B‐cell non‐Hodgkin lymphoma. Blood 2001; 97: 3896–3901. [DOI] [PubMed] [Google Scholar]
- 13. Bea S, Tort F, Pinyol M et al. BMI‐1 gene amplification and overexpression in hematological malignancies occur mainly in mantle cell lymphomas. Cancer Res 2001; 61: 2409–12. [PubMed] [Google Scholar]
- 14. Vonlanthen S, Heighway J, Altermatt HJ et al. The bmi‐1 oncoprotein is differentially expressed in non‐small cell lung cancer and correlates with INK4A‐ARF locus expression. Br J Cancer 2001; 84: 1372–6. [DOI] [PMC free article] [PubMed] [Google Scholar]
- 15. Kim JH, Yoon SY, Kim CN et al. The Bmi‐1 oncoprotein is overexpressed in human colorectal cancer and correlates with the reduced p16INK4a/p14ARF proteins. Cancer Lett 2004; 203: 217–24. [DOI] [PubMed] [Google Scholar]
- 16. Qin ZK, Yang JA, Ye YL et al. Expression of Bmi‐1 is a prognostic marker in bladder cancer. BMC Cancer 2009; 9: 61. [DOI] [PMC free article] [PubMed] [Google Scholar]
- 17. Wang H, Pan K, Zhang HK et al. Increased polycomb‐group oncogene Bmi‐1 expression correlates with poor prognosis in hepatocellular carcinoma. J Cancer Res Clin Oncol 2008; 134: 535–41. [DOI] [PMC free article] [PubMed] [Google Scholar]
- 18. Sasaki M, Ikeda H, Itatsu K et al. The overexpression of polycomb group proteins Bmi1 and EZH2 is associated with the progression and aggressive biological behavior of hepatocellular carcinoma. Lab Invest 2008; 88: 873–82. [DOI] [PubMed] [Google Scholar]
- 19. Hui AM, Sakamoto M, Kanai Y et al. Inactivation of p16INK4 in hepatocellular carcinoma. Hepatology 1996; 24: 575–9. [DOI] [PubMed] [Google Scholar]
- 20. Kaneto H, Sasaki S, Yamamoto H et al. Detection of hypermethylation of the p16(INK4A) gene promoter in chronic hepatitis and cirrhosis associated with hepatitis B or C virus. Gut 2001; 48: 372–7. [DOI] [PMC free article] [PubMed] [Google Scholar]
- 21. Genda T, Sakamoto M, Ichida T et al. Cell motility mediated by rho and Rho‐associated protein kinase plays a critical role in intrahepatic metastasis of human hepatocellular carcinoma. Hepatology 1999; 30: 1027–36. [DOI] [PubMed] [Google Scholar]
- 22. Hirohashi S, Ishak K, Kojiro M et al. Tumours of the liver and intrahepatic bile ducts. In: Hamilton SR, Aaltonen LA, eds. Pathology and Genetics of Tumours of the Digestive System. Lyon: IARC Press, 2000; 157–202. [Google Scholar]
- 23. Neo SY, Leow CK, Vega VB et al. Identification of discriminators of hepatoma by gene expression profiling using a minimal dataset approach. Hepatology 2004; 39: 944–53. [DOI] [PubMed] [Google Scholar]
- 24. Francis NJ, Kingston RE. Mechanisms of transcriptional memory. Nat Rev Mol Cell Biol 2001; 2: 409–21. [DOI] [PubMed] [Google Scholar]
- 25. Buchenau P, Hodgson J, Strutt H, Arndt‐Jovin DJ. The distribution of polycomb‐group proteins during cell division and development in Drosophila embryos: impact on models for silencing. J Cell Biol 1998; 141: 469–81. [DOI] [PMC free article] [PubMed] [Google Scholar]
- 26. Valk‐Lingbeek ME, Bruggeman SW, Van Lohuizen M. Stem cells and cancer: the polycomb connection. Cell 2004; 118: 409–18. [DOI] [PubMed] [Google Scholar]
- 27. Nagao K, Tomimatsu M, Endo H, Hisatomi H, Hikiji K. Telomerase reverse transcriptase mRNA expression and telomerase activity in hepatocellular carcinoma. J Gastroenterol 1999; 34: 83–7. [DOI] [PubMed] [Google Scholar]
- 28. Oh BK, Jo Chae K, Park C et al. Telomere shortening and telomerase reactivation in dysplastic nodules of human hepatocarcinogenesis. J Hepatol 2003; 39: 786–92. [DOI] [PubMed] [Google Scholar]
- 29. Molofsky AV, He S, Bydon M, Morrison SJ, Pardal R. Bmi‐1 promotes neural stem cell self‐renewal and neural development but not mouse growth and survival by repressing the p16Ink4a and p19Arf senescence pathways. Genes Dev 2005; 19: 1432–7. [DOI] [PMC free article] [PubMed] [Google Scholar]
- 30. Molofsky AV, Pardal R, Iwashita T, Park IK, Clarke MF, Morrison SJ. Bmi‐1 dependence distinguishes neural stem cell self‐renewal from progenitor proliferation. Nature 2003; 425: 962–7. [DOI] [PMC free article] [PubMed] [Google Scholar]
- 31. Kartner N, Evernden‐Porelle D, Bradley G, Ling V. Detection of P‐glycoprotein in multidrug‐resistant cell lines by monoclonal antibodies. Nature 1985; 316: 820–3. [DOI] [PubMed] [Google Scholar]
- 32. Riordan JR, Deuchars K, Kartner N, Alon N, Trent J, Ling V. Amplification of P‐glycoprotein genes in multidrug‐resistant mammalian cell lines. Nature 1985; 316: 817–9. [DOI] [PubMed] [Google Scholar]
- 33. Bunting KD, Galipeau J, Topham D, Benaim E, Sorrentino BP. Effects of retroviral‐mediated MDR1 expression on hematopoietic stem cell self‐renewal and differentiation in culture. Ann NY Acad Sci 1999; 872: 125–40. discussion 40–1. [DOI] [PubMed] [Google Scholar]
- 34. Bunting KD. ABC transporters as phenotypic markers and functional regulators of stem cells. Stem Cells 2002; 20: 11–20. [DOI] [PubMed] [Google Scholar]
- 35. Keshet GI, Goldstein I, Itzhaki O et al. MDR1 expression identifies human melanoma stem cells. Biochem Biophys Res Commun 2008; 368: 930–6. [DOI] [PubMed] [Google Scholar]
- 36. Vander Borght S, Komuta M, Libbrecht L et al. Expression of multidrug resistance‐associated protein 1 in hepatocellular carcinoma is associated with a more aggressive tumour phenotype and may reflect a progenitor cell origin. Liver Int 2008; 28: 1370–80. [DOI] [PubMed] [Google Scholar]
Associated Data
This section collects any data citations, data availability statements, or supplementary materials included in this article.
Supplementary Materials
Fig. S1. ATP‐binding cassette transporter B1 (ABCB1) expression in hepatocellular carcinoma (HCC) cell lines and clinical samples. (a) Quantitative real‐time PCR and Western blot of ABCB1 in HCC cell lines. Expression of ABCB1 was significantly higher in KIM‐1 cells compared with the other cell lines. (b) ABCB1 mRNA expression levels in HCC clinical cases. The relative mRNA expression levels in tumor tissues (black column, T) and corresponding non‐cancerous, background liver tissues (gray column, N) (left panel). High levels of ABCB1 expression were observed in well differentiated HCC. The average expression levels of ABCB1 were higher in tumor tissues than in the non‐cancerous background liver tissues (2.30 vs. 1.23, P = 0.21) (right panel). (c) Immunostaining of ABCB1 in well differentiated HCC. An irregular and thicker form of canalicular pattern with cytoplasmic staining was observed in the tumor region compared with the non‐cancerous background region (magnification, ×100). Black arrows outline the border between the non‐cancerous background region (N) and the tumor region (T). (d) ABCB1 expression in moderately differentiated HCC (magnification, ×200). Only an irregular canalicular pattern was observed (a, H&E stain; b, corresponding ABCB1 staining).
Please note: Wiley‐Blackwell are not responsible for the content or functionality of any supporting materials supplied by the authors. Any queries (other than missing material) should be directed to the corresponding author for the article.
Supporting info item