

Abstract
Genome-wide association studies have been performed extensively in the last few years, resulting in many new discoveries of genomic regions that are associated with complex traits. It is often the case that a SNP found to be associated with the condition is not the causal SNP, but a proxy to it as a result of linkage disequilibrium. For the identification of the actual causal SNP, fine-mapping follow-up is performed, either with the use of dense genotyping or by sequencing of the region. In either case, if the causal SNP is in high linkage disequilibrium with other SNPs, the fine-mapping procedure will require a very large sample size for the identification of the causal SNP. Here, we show that by leveraging genetic variability across populations, we significantly increase the localization success rate (LSR) for a causal SNP in a follow-up study that involves multiple populations as compared to a study that involves only one population. Thus, the average power for detection of the causal variant will be higher in a joint analysis than that in studies in which only one population is analyzed at a time. On the basis of this observation, we developed a framework to efficiently search for a follow-up study design: our framework searches for the best combination of populations from a pool of available populations to maximize the LSR for detection of a causal variant. This framework and its accompanying software can be used to considerably enhance the power of fine-mapping studies.
Introduction
Over the last several years, many genome-wide association studies (GWAS) have been employed for the identification of hundreds of new genomic regions containing genetic polymorphisms contributing to the risk of complex human diseases. Each of these newly identified loci contain dozens, sometimes even hundreds, of SNPs, few of which are expected to play a functional role in altering the disease status. Identifying these causal SNPs may provide important insights into the biological basis of complex human diseases, as well as offer diagnostic tools that aid in treating patients and personalizing medicine. Follow-up studies aim to identify the causal variants in GWAS by more thoroughly examining the proximal genetic variation of the associated locus. This examination is usually done by a fine-mapping approach in which the genomic region is densely genotyped. Recent advances in high-throughput sequencing technologies may lead, in the next years, to follow-up studies that fully sequence the associated region.
A major challenge currently facing the community is the design of follow-up studies for the identification of the causal variant such that the power to distinguish the causal variant from the neighboring SNPs is maximized. One of the major obstacles complicating the design of such studies is the local linkage disequilibrium (LD) structure at the associated loci. In most cases, many of the SNPs in these loci are in strong LD with one another because of their physical proximity, and several of them are likely to be linked to the causal variants. Although this local LD structure provides GWAS a powerful means of finding new associations without directly genotyping the causal variant, it also makes the identification of the causal variant a challenging task. Test statistics calculated in a follow-up study over tightly linked SNPs will behave similarly, and thus it is difficult to distinguish between the causal variant and its proxies.
In order to measure the ability of a follow-up study to resolve the causal SNPs from those in strong LD, we introduce a new metric called the localization success rate (LSR), described in detail below. For these new metrics, consider a follow-up study of a locus containing exactly two SNPs that are in perfect LD, with only one being causal. If the sample size and odds ratio are large, the study will have a very high power to detect association; that is, the probability of finding a statistically significant result will be high. However, the LSR will only be 50%, because both SNPs will have identical statistics. Given that a GWAS has already identified the locus as having a significant association, we are more interested in our new metric than in power.
Traditionally, a follow-up study focuses the sequencing and genotyping of an associated locus on individuals from the original study population. This provides powerful confirmation of the original result, describes more precisely the set of polymorphisms in the region, and protects against heterogeneous effects across populations. However, it is yet to be determined whether conducting a follow-up study in the same population as that of the original study provides the most powerful means of identifying the causal variant. Recently, several groups have attempted an alternative approach to this problem by conducting follow-up studies over multiple populations.1,2 Leveraging the differences in local LD structure between the populations may amplify the signal of the causal variant, because SNPs strongly linked to the causal variant in one population may not be strongly linked in another. However, to date, it is not clear whether this approach is useful in general. One may expect that always using a population with low average LD, such as an African population, will result in the greatest LSR in distinguishing the causal SNP from its neighbors.
In this work, we evaluate different strategies for fine mapping a region. We focus on fine-mapping follow-up studies in which significant GWAS results have been reported in a single population, because this is the most common form of GWAS conducted so far. Specifically, we develop an analytical framework for evaluating the LSR of detection of a causal SNP in a region; our framework takes into account the structure of the linkage disequilibrium in the studied population. Furthermore, we determine which population or set of populations achieves, on average, an increase in LSR for fine mapping. Surprisingly, our results suggest that studies involving a mix of two or three populations result in higher average LSRs than do studies over a single population, even for cases in which the single population is of higher genetic diversity (e.g., an African population). Furthermore, we find that the optimal choice of populations varies from locus to locus. Although we focus primarily on diseases in which the causal variant has a fixed effect across all populations (as this is the case for the majority of diseases studied to date3), we also propose a multistage method for addressing diseases with heterogeneous effects across populations.
We incorporated our analytical framework into a software package called MULTIPOP, which takes as an input a set of regions, test statistics obtained for the SNPs in these regions in previous studies of the phenotype (used as priors), and a set of reference data sets from the available populations. MULTIPOP uses this information to decide how many samples of each population should be further studied so that the LSR of detection of a causal SNP will be maximized under budget constraints.
Material and Methods
In a fine-mapping follow-up study, individuals are genotyped or sequenced at a set of loci that are shown to be associated with the phenotype of interest in a previous GWAS. In this work, we examine the question of whether the individuals selected for the study should come from one or several populations and how this choice affects the LSR of the causal variant from its linked proxy SNPs. A direct approach to answering this question would be to perform an extensive set of simulations of fine-mapping studies under a variety of disease models with reference data sets such as the HapMap4 and to determine which study designs are more powerful for causal-variant identification. This approach, although accurate, is prohibitively computationally expensive. As an alternative to this, we put forward the ideas of Han et al.5 and Conneely et al.,6 who use insightful statistical and algorithmic observations to model the null and alternative distributions of case control studies, providing a computationally feasible means of studying multipopulation fine-mapping studies. In addition, we develop an analytical framework for designing new studies over multiple populations, implemented in the software package that we call MULTIPOP.
The multipopulation approach is based on the following intuition: Suppose that in an initial study we identify several significant SNPs at a locus with one true causal variant; as observed by Lawrence et al.7 Therefore, we are likely to find more than one significant SNP in that region, because all SNPs linked to the causal variant are potentially significant. Consider a SNP strongly correlated with the causal SNP (e.g., r2 > 0.9) and therefore highly significant. If we conduct a follow-up study in the same population, the SNP will probably be significant again. However, if we select another population, in which the SNP is poorly correlated to the causal SNP (e.g., r2 = 0.1), then only the causal variant will remain a strong candidate in the final analysis. Built on this intuition, our framework searches for the best combination of populations to maximize the LSR for distinguishing the causal variant among the tightly correlated SNPs in a region.
The challenge in implementing the above intuition is that the correlation structure between the SNPs is based not merely on two linked SNPs but on a complex correlation structure that involves all SNPs in the region. To overcome this challenge, our method uses a carefully chosen multivariate normal (MVN) distribution to sample from the distribution of simulated case-control studies over a region. That is, given the set of data that we would use to simulate a study, our method computes the test statistics over the simulated data without actually paying the computational cost of simulation. This strategy makes it feasible to estimate the LSR of a study on the basis of the multidimensional correlation structure. In addition, we use this framework to efficiently search for an optimal study design in which there is freedom in the choice of the studied population(s).
Modeling LD by Using the MVN Distribution
We will first describe how the MVN distribution can be used for estimation of the LSR of detecting the causal SNP of a study over one population. Consider an association study in which we genotype a set of SNPs, s1, s2, …, sk, and measure their frequency in N/2 cases, , , …, , and N/2 controls, , , …, , from the population. We can compute a statistic (the Z score) for each SNP, , in which pi = ( + )/2. Under the null hypothesis (the allele frequencies in the cases and the controls are the same), this statistic is known to be distributed according to a standard normal distribution.8 The alternative hypothesis is composite, depending on which SNP is causal and its relative risk. Note that throughout this paper we assume an additive model and that the term “relative risk” refers to the allelic relative risk. If we assume that SNP sc is the causal SNP with a relative risk of γc, it is easy to calculate the power of the test Zc under a significance level of α. This power can be calculated by noting that , in which the noncentrality parameter is , which can be estimated given the relative risk and the minor allele frequency (MAF) in the population. However, as a result of linkage disequilibrium, other SNPs in the region may also have a high power for association when this statistic is used. Particularly, it is well known9 that for a SNP sj with a correlation coefficient rcj with the causal c, , in which . In the extreme case that rcj = 1, there is essentially no distinction between statistics computed at sc and at sj—the power of association may be high in both SNPs, but the LSR for the causal SNP will be bounded by 0.5. It follows that the LSR of the causal SNP in a region is a function of the allele frequency of the causal SNP, the relative risk, the correlation structure in that region, and the study size.
One simple way of estimating the LSR is by simulation. We can use a reference data set such as the HapMap4,10 to simulate multiple case-control panels by specifying a causal variant, a relative risk, and a prevalence. There are various existing tools that provide such simulations. In this work, we chose the widely used software HapGen,11 which models the LD structure by using the Li-Stephens model.12 For each such panel, we can calculate the statistics Z1, …, Zk and test whether the causal SNP turns out to be the one with the largest statistic.
Although the simulation approach provides accurate LSR estimation, it is highly inefficient. In our case, the large parameter space for the study design (i.e., the number of individuals from each of the populations), the causal SNP, and the relative risks make the task of performing a simulation for each point in that space computationally infeasible. We therefore add upon the observation made by Han et al.5 and Conneely et al.,6 who noticed that the distribution of Z = Z1, Z2, …, Zk follows an MVN distribution , in which and Σ is the k × k variance-covariance matrix of the SNPs in which the ith, jth entry of Σ is the correlation coefficient of SNPs si, sj.
Given a region of the genome where the MAFs and correlations of the SNPs are known, we can replace the simulation approach by a simple Monte Carlo sampling from the corresponding MVN distribution. Put differently, we draw samples directly from the MVN distribution under the alternate hypothesis; each draw corresponds to one round of simulation in which a case-control panel has been created. We can now calculate the LSR as the top statistic on the basis of these draws. We show in the Appendix that this approach results in power estimates that are extremely similar to the one calculated by the HapGen program.11 A similar approach has been previously used to efficiently calculate the power of an association study.5,6 Note, however, that in our case the application is different because we consider the LSR, not the power of association, for distinguishing the causal variant. Furthermore, the use of multiple populations requires a different MVN distribution than that described above.
The MVN Distribution in Meta-Analysis
To extend the single-population MVN distribution to utilize information from several studies over multiple populations, we must first select an appropriate statistical test. There exist many methods for combining information across association studies, (see Kavvoura and Ioannidis13 for a review). Here, we consider the weighted Z score statistic,8 a commonly used meta-analysis method.14
Given M independent studies P1, P2, …, PM, each of which genotypes the SNPs s1, s2, …, sk, let Zi, j be the Z score of SNP si in study Pj. Each study has a vector of noncentrality parameters Λ1, Λ2, …, ΛM, a variance-covariance matrix Σ1, Σ2, …, ΣM, and a number of individuals N1, N2, …, NM. For the sake of presentation, we will assume that the studies are balanced (i.e., that there are the same number of cases and controls), but the unbalanced case can be easily incorporated into the framework. For SNP si we can compute the weighted Z score statistic . Because each Zi, j is normally distributed with a mean of λi, j and a variance of 1, Ti is also normally distributed, with a mean of and a variance of 1. Therefore, the distribution of T = (T1, T2, …, Tk) will also be MVN:
| (Equation 1) |
Because the covariance matrices are fixed (they can be estimated from the HapMap data set), the distribution T is determined by the study sizes, the causal SNP, the relative risk, and the prevalence of the disease. For such a choice of parameters, we can efficiently generate meta-analysis statistics drawn from the alternative distribution for any locus by using a Monte Carlo approach. We can draw random samples from T by using existing software packages (here we use the “mvtnorm” R package); each draw from T is used as a replacement for simulating case-control panels over each of the M populations and combining their results with the meta-analysis statistic. We use this Monte Carlo approach to examine the effectiveness of combining information from distinct populations for identification of the causal variant. Intuitively, the optimal study design will consist of one population with the lowest average LD; surprisingly, however, we find that for large sample sizes, a combination of a few distinct populations yields the best LSR. (see Results section for details).
Optimizing Study Designs
A natural question arising from the above analysis is how one can design a study that is optimized for detection of the causal variant in a region. Given a set of loci that are the targets of fine mapping and a set of M populations available for genotyping, we are interested in choosing a number Ni for each population with , such that the meta-analysis study involving Ni cases and controls from population i has the maximal LSR of detection of the causal variant; the maximum is taken across all studies involving N genotyped samples. To address this problem we have developed an algorithm implemented in our MULTIPOP software that searches for the optimal study design, which we describe next.
Once relative risks, prevalences, sample sizes, and causal variants are specified for each population, the MVN distribution in Equation 1 gives the alternative distribution of the meta-analysis statistic. Searching for the optimal study design is then reduced to the problem of searching over the design parameters to identify the design that maximizes the expected LSR. To perform such a search, we need to have a prior distribution on the relative risk of each SNP si in each population. This prior can be calculated on the basis of the results of a previous association study; such a study will provide the statistics Z∗ = (Z1∗, …, Zk∗) for a given population. Z∗ = (Z1∗, …, Zk∗) are realizations of random variables Z = (Z1, …, Zk) drawn from a MVN distribution. In this section, we assume that the relative risks across multiple populations are the same, and we later show how MULTIPOP can be adapted to SNPs with heterogeneous effects. Under this fixed-effects assumption, we calculate a prior probability qi that SNP si is the causal SNP. That is, we want to find the maximum posterior probability qi = Pr(si is causal | Z∗). Following the intuition that SNPs with smaller p values are more likely to be causal, a naive way of estimating qi is by setting .
Although intuitive and easy to implement, the above approach may be suboptimal because it completely ignores the correlation structure in the region. We therefore implemented an alternative approach that takes into account the statistic Z∗, as well as the correlation structure in the region. We use the original study to calculate the empirical estimate of the relative risks γ1, …, γk of the SNPs in the region. If si is causal with a relative risk of γi, then we can calculate the value λi, in which is the expected noncentrality parameter of the statistic Zi and N′ is the original study size. Now, under the assumption that si is causal, Z∗ is drawn from the MVN distribution , in which . For each SNP si, we compute qi, the MVN probability density function of the observed Z scores Z∗ under Z given that si is causal, and normalize these so that they sum to 1. These q1, q2, …, qk serve as the prior probabilities that each SNP is causal. Under various simulations, we find that this approach results in better LSR estimations (data not shown) than do alternative estimates of qi.
Each study design D is specified by sample sizes (N1, …, NM) for each population, such that . For a design D, we compute the LSR βD, i given that SNP si is causal and has relative risk γi, which is assumed to be known (γi is estimated from the previous association study). We describe several different measures of LSR in the Results section. The expected LSR βD for the design D is then estimated as the weighted sum of βD, i:
Our method identifies the best fine-mapping study design by using a grid-search algorithm over all possible designs D; this grid search is feasible when the number of populations involved is not too large. The final design chosen is the D with the maximum expected LSR out of all designs on the grid.
Results
To examine the effects of using multiple populations on the LSR for resolving a causal variant in a fine-mapping study, we performed extensive simulations over the HapMap populations by using the MULTIPOP software outlined above. We began by showing that the average LSR is indeed increased when studies are designed with multiple, as opposed to single, populations. Second, we examined potential mechanisms for this improvement by looking at the distribution of optimal designs. Third, we investigated the effect that study design has on the LSR and show that our proposed method attains close to optimal LSR, outperforming designs that ignore the local LD structure. Fourth, we explored an extension of our method to handle SNPs with heterogeneous effects across populations by using a multistage design. Finally, as a concrete example of the applicability of our approach, we used existing breast cancer GWAS results to design a powerful follow-up study over the HapMap populations.
For all our analyses, we used release 21 of the HapMap10 haplotype data for chromosome 1 over the CEU, YRI, and ASN (JPT+CHB) populations. We randomly selected 10,000 SNPs to serve as causal variants, and we created a locus based on each of these SNPs by taking 20 additional SNPs on each side of the selected causal variants. These loci span 30 Kb on the average. The histogram of the MAFs of the 10,000 randomly selected causal variants is displayed in Figure S1 (available online), showing that the random set of causal variants is sampled across all MAFs. We note that these loci are not used for modeling one disease with 10,000 causal variants but, rather, serve as a large set for assessing the expected behavior of our methods across the genome. For each of these 10,000 loci, on the basis of the HapMap data, we computed a correlation matrix Σ used in the meta MVN described in the Material and Methods section. These simulated loci served as the starting point for each of the experiments described in this section. In the Appendix, we show that very similar results can be obtained by simulating the data sets with the use of HapGen.11 A prevalence of 0.01 is used throughout this section.
LSR Metrics
Currently, there is no widely accepted measure of power for identifying the causal SNP (fine-mapping power), so we start by giving a precise definition of how we measure the LSR for the causal variant from its neighboring SNPs in this work. We propose two correlated measures, each of which may be useful depending on the study objective; both measures can be easily calculated by using samples drawn from the meta MVN.
The first measure of LSR computes the fraction of study samples in which the causal variant has the lowest p value among all SNPs in the region. This corresponds to the scenario in which exactly one SNP from each region is undergoing functional analysis; we therefore measure the fraction of regions in which the actual causal variant will be chosen for the functional analysis. The second measure that we use is the average rank of the causal variant when the SNPs are ordered from lowest to highest p value with ties broken randomly. Although this is not a measure of the probability of an event, and thus not a measure of power in the usual statistical sense, it can be thought of as the expected number of SNPs that will have to undergo functional analysis before the causal variant is isolated. Because it is likely that statistical rank will prioritize functional analysis, this measure is a useful way of examining fine-mapping results.
The suggested measures do not quantify the precision of the estimates of the probability that SNP is causal (qi, as described in the Material and Methods section). Instead, given such probabilities, or any other statistic, they aim at measuring the potential success of a follow-up study in which, for example, functional analysis will be performed on a smaller number of SNPs. Although the proposed measures are correlated, they are not always optimized by the same choice of populations, and therefore an investigator should decide which measure to use on the basis of his or her plans for a follow-up study. Note that each of these measures are calculated in a trivial manner once samples from the alternative MVN distribution are generated. Both measures are applied only to SNPs exceeding a specified significance level, and the sample sizes used in our simulations provided enough power that the causal variant had a p value ≤ 0.05 more than 98% of the time.
Balanced Multiple-Population Studies
To demonstrate the benefit of using multiple populations, we first examined the simple approach of dividing individuals evenly among the HapMap populations in comparison to using all individuals in each population in isolation. For example, the YRI+CEU study uses the same number of YRI and CEU samples, whereas the CEU study includes only CEU samples.
Figure 1 presents the estimated LSR of seven different balanced study designs, clearly showing that there is an increase in the LSR of identifying the causal variant when multiple populations are used. The average rank of the causal variant decreases from 3.40, when the study is performed only on the ASN population, to 1.94, when the study design involves all three populations. To date, most GWAS have been performed in one population, usually a population of European ancestry similar to the CEU population in the HapMap. As shown in Figure 1, studies that combine CEU individuals with individuals from YRI or ASN populations achieve higher LSRs (i.e., a significant reduction in the average rank of the causal SNP). Furthermore, study designs that involve a combination of populations result in higher LSRs than do studies involving one population alone, even when compared to the YRI population.
Figure 1.
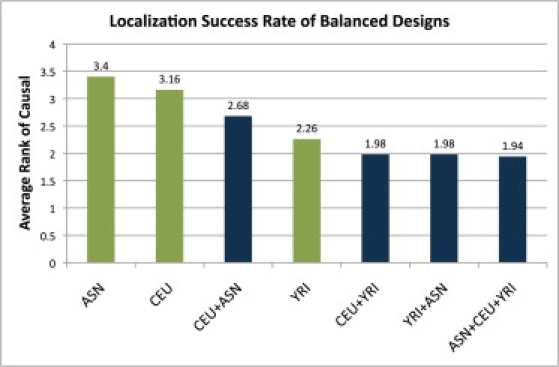
The Average Rank of the Causal Variant in 10,000 Simulated Loci, with 3000 Cases, 3000 Controls, and γ = 1.4 for Seven Different Study Designs
Designs over multiple populations, such as the CEU+YRI, split individuals evenly among them. Using multiple populations reduces the number of functional assays expected before the causal variant is identified.
The above result is surprising, given that intuition leads us to believe that performing a study in a single population with the lowest average LD in the fine-mapping region should yield the greatest LSR. Figure 2 shows that this intuition is indeed correct. If we consider one genomic region at a time, in the vast majority of cases, studies involving exactly one of the populations will result in better fine-mapping power than will studies involving a combination of populations. In particular, for most genomic regions, the YRI studies yield the greatest LSR. This is intuitive, because it is expected that in most cases two SNPs that are in high LD in an African population will also be in high LD in other populations, such as populations of European ancestry.
Figure 2.
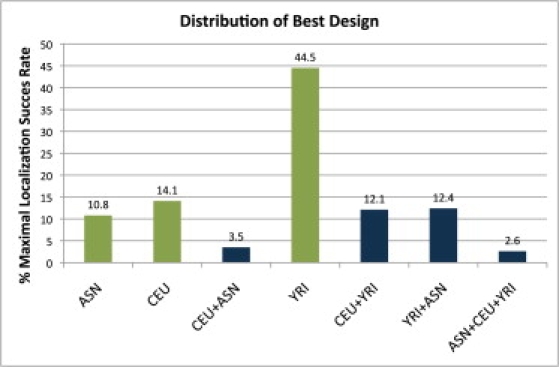
The Fraction of Times that a Design Achieves the Maximal LSR for Each of the Study Designs
The statistics are based on 10,000 simulated loci, with 3000 cases, 3000 controls, and γ = 1.4. As expected, the YRI population is most often the best choice for study design. However, it is the top choice only 44% of the time. The combination of all three populations is almost never the best study design, accounting for only 2.6% of the 10,000 designs. Interestingly, it maximizes the average LSR, suggesting, first, that it protects against the variance of different local LD structures and, second, that tailoring study designs to the loci in the follow-up study is beneficial.
At first glance, the conclusions of Figure 1 and Figure 2 may seem contradictory. However, because the population that maximizes the fine-mapping LSR differs across different regions, studies that involve more than one population essentially achieve a high average LSR, when the average is taken across all studied regions. Put differently, there is a higher variance across regions in which the optimal LSR is achieved by one population alone, and therefore a combination of two or more populations yields a better average LSR.
Other choices of the sample sizes, relative risks, and measures of LSR resulted in a similar trend. For example, Figure 3 shows the change in LSR for CEU, ASN, CEU+ASN, as well as relative risks 1.1 to 1.9 and a fixed sample size of 1000 cases and 1000 controls. The trend observed in Figure 2 for γ = 1.4 extends to any considered γ. Designs across both of the populations outperform each population in isolation. However, as the relative risk increases, there are diminishing returns in using multiple populations as compared to using single populations. We believe that this is because even SNPs with relatively strong r2 are easily distinguished at high relative risks. On the other hand, SNPs with very strong signals are very tightly correlated in both CEU and ASN in that they cannot be distinguished with the current sample size (or at all, in the case of perfect LD).
Figure 3.
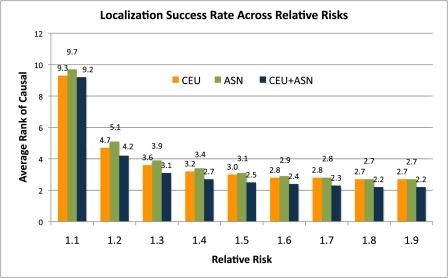
Histogram of the Average Rank of the Causal Variant in 10,000 Simulated Loci, with 1000 Cases, 1000 Controls, and a Relative Risk of 1.4 for Three Different Study Designs over a Range of Relative Risks
The study designs are all CEU, all ASN, and CEU+ASN. CEU+ASN designs have individuals split evenly between them. The trend observed in the simple designs is preserved across relative risks.
Designing Multiple-Population Studies
The results presented above illustrate the effectiveness of using multiple populations in fine-mapping studies. However, given a fixed budget of N individuals, an uneven split of individuals across the populations may provide increased LSR of the causal variant. Furthermore, as the name suggests, fine-mapping follow-up studies are generally based on results of previous GWAS, and incorporating this prior information may lead to better resolution of the causal SNP.
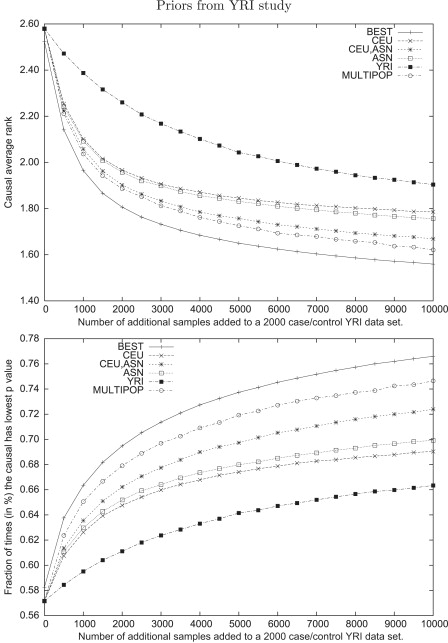
To examine this scenario, we began by simulating a study made up of 1000 cases and 1000 controls in one of the HapMap populations. We then quantified the LSR increase when additional individuals from various populations were added to the study. To assess the gain in LSR due to multiple populations, we also used combinations of populations not contained in the original study. For each of these designs, we computed the LSR over each of the 10,000 simulated loci and plotted the average LSR. The results are shown in Figure 4 and Figure 5.
Figure 4.
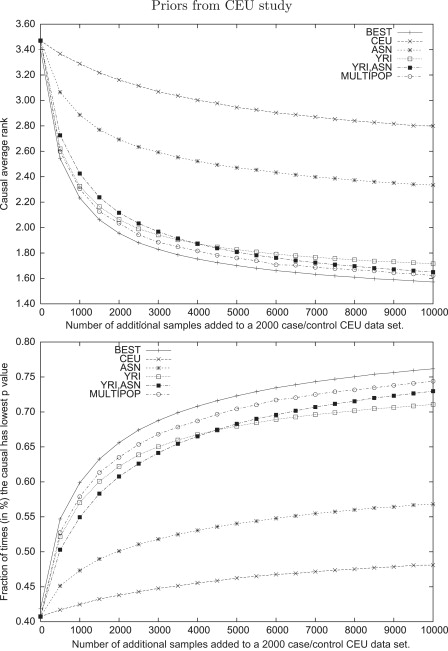
Average Rank and Fraction of Time that a Causal Variant Has the Best Statistics in Follow-Up Studies over 10,000 Simulated Loci with a Relative Risk of 1.4
The designs include 1000 cases and 1000 controls from the CEU data set combined with x cases and controls taken from CEU, YRI, ASN, and ASN + YRI, where x ranges from 0 to 10,000 in steps of 500. For the studies involving YRI+ASN designs, the same number of samples is taken from both YRI and ASN. The hypothetical optimal method is choosing the optimal design in each of the 10,000 designs, and MULTIPOP uses the populations predicted by our algorithm (see Material and Methods) as having the maximal LSR.
Figure 5.
Average Rank and Fraction of Time that a Causal Variant Has the Best Statistics in Follow-Up Studies over 10,000 Simulated Loci with a Relative Risk of 1.4
The designs include 1000 cases and 1000 controls from the YRI data set combined with x cases and controls taken from CEU, YRI, ASN, and ASN + CEU, where x ranges from 0 to 10,000 in steps of 500. For the studies involving CEU+ASN designs, the same number of samples is taken from CEU and ASN. The hypothetical optimal method is choosing the optimal design in each of the 10,000 regions, and MULTIPOP uses the populations predicted by our algorithm (see Material and Methods) as having the maximal LSR.
The study designs with multiple populations have significantly better LSRs across a range of sample sizes, with the benefit more pronounced in smaller studies. As the sample size grows, the variance of test statistics decrease, so that closely linked SNPs are more easily distinguished even in one population. Notice that the combination of CEU and YRI outperforms the designs across all three populations until sample sizes are very large, at which point the use of all populations becomes more successful. This demonstrates the importance of carefully selecting the populations to be used in the study as opposed to simply including as many different populations as possible.
It is intriguing to understand the limits of such an approach. To do this, we compared the different study designs with a hypothetical design in which the optimal population was used for each region. Note that no method could ever achieve such LSR, because we are using different study designs for different regions; however, this hypothetical design is still useful and serves here as an upper bound on the possible LSR that one can achieve.
Using our MULTIPOP method described above, we selected a population or combination of populations from among those described in the previous paragraph. The results are also shown in Figure 4 and Figure 5. Although our method is not as successful as the hypothetical optimal design, it clearly outperforms a naive selection of a single type of population. The fact that there is a clear difference between choosing the best populations at every locus and using the combination of all three populations indicates that there is large variance in the performance of a study that is based on any particular population. Furthermore, the variance of the MULTIPOP approach is much lower than even that of the multipopulation approach (data not shown). Thus, it improves the average LSR while still protecting against regions with very poor performance in a particular population.
Implications for Sequencing-Based Studies
Many future follow-up studies are expected to use sequencing technologies for the fine-mapping stage. Particularly, a possible strategy is a multistage study in which the first stage consists of the sequencing of a small number of individuals and the second stage consists of the genotyping of a set of SNPs discovered in the first stage across a larger population. This is, for example, similar to the procedure followed by Udler et al.1 It is therefore of interest to discuss our findings in the context of more dense genotyping data that result from such sequencing studies.
For this purpose, we simulated 1000 regions from the ten ENCODE regions that were thoroughly resequenced in the HapMap populations.15 Each of the 1000 regions contains 81 SNPs spanning 18 Kb on average (40 SNPs at each side of the causal SNP), as opposed to 41 SNPs that were used in the previous experiment. We used a wider window because the SNPs in the ENCODE region are more densely genotyped. For each of these regions, we computed the LSR at a relative risk of 1.4.
Figure 6 shows the results for the ENCODE regions and for random HapMap regions for the same study designs. Although the ENCODE regions have lower LSRs than do random regions, the same trends in terms of study design are still observed. That is, the use of multiple populations improves the LSR of identification of the causal variant regardless of the SNP density in the regions targeted for fine mapping.
Figure 6.
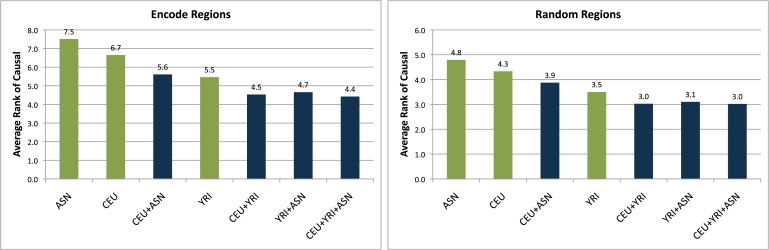
Histogram of the Average Rank of the Causal Variant in 1000 ENCODE Regions and 1000 HapMap Regions for a Study Size of 1000 Cases and 1000 Controls and a Relative Risk of 1.4
Seven designs over different combinations of the HapMap populations were examined. In both random and ENCODE regions, the use of multiple populations improved the LSR of identifying the causal variant.
Causal Variants with Heterogeneous Effects
Although the majority of causal variants have a fixed effect size across all populations,3 a significant percentage will show a heterogeneous effect across different populations. In this case, a naive implementation of our proposed approach will incorrectly use an estimated relative risk from only a single population; namely, the population in which the initial GWAS was performed. In order to address this situation, we propose a multistage design in which an initial sample is taken from each of the available populations and used for estimating the relative risks for each population and these estimates are then plugged into our proposed framework in the design of the next stage.
To explore the effectiveness of such an approach, we simulated 3000 case and 3000 control data sets with relative risks 1.1, 1.3, and 1.6 for the ASN, YRI, and CEU data, respectively. We assessed the LSR when each population was used independently in a multistage design in which 1500 cases and 1500 controls (500 cases and 500 controls from each population) were genotyped in the first stage. The accuracy of the estimate of the relative risk from the first stage is function of the MAF, the true relative risk, and the sample size. Choosing the optimal number of individuals for each stage is an interesting problem beyond the scope of this work. We then plugged the results for the first stage into the MULTIPOP framework to determine a powerful design for the remaining 1500 cases and 1500 controls by searching over all balanced combinations of samples from the three populations. The results are presented in Figure 7. The ASN sample performed poorly because it was underpowered for a relative risk of only 1.1. The multistage MULTIPOP method outperformed the single populations even in the presence of heterogeneous effect sizes. Despite its low relative risk, the ASN population is still beneficial in many loci. The CEU, YRI, CEU+YRI, and ASN+CEU+YRI data were optimal in 34%, 36%, 25%, and 5% of the 10,000 loci, respectively, demonstrating that in 5% of the loci, the addition of ASN individuals increased the LSR.
Figure 7.
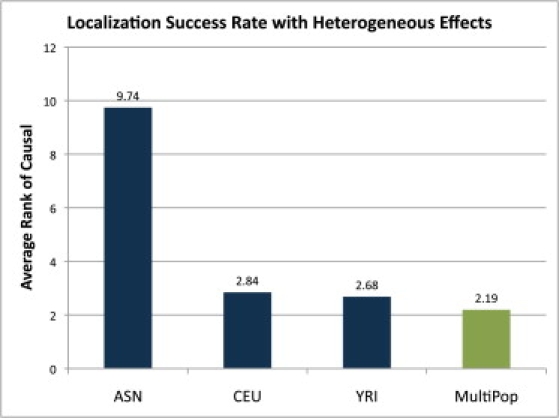
Average Rank of the Causal Variant in 10,000 Simulated Loci with 3000 Cases, 3000 Controls, and Relative Risks of 1.1, 1.3, and 1.6 for ASN, YRI, and CEU, Respectively
Four study designs were considered: all ASN, all CEU, all YRI, and a multistage design using our MULTIPOP algorithm and designed to address the issue of heterogeneous effects in different populations. Despite an initial stage requiring genotyping of 1000 ASN individuals, our algorithm still outperformed single-population designs.
Sample Designs for Breast Cancer
To provide a concrete example of the applicability of our approach, we used MULTIPOP to design a follow-up study based on published results from breast cancer GWAS.2,16–19 We assumed a total budget of 6000 individuals and access to case-control groups in all of the three HapMap populations: CEU, YRI, and ASN. For each of the published SNPs (rs11249433, rs1219648, rs13387042, rs2046210, rs2107425, rs2180341, rs2981582, rs3803662, rs3817198, rs4415084, rs8051542, and rs999737), we took a window of 81 SNPs and extracted the corresponding haplotypes for the unrelated HapMap individuals in all three populations. We used the expected Z scores given the published odds ratios and the pairwise LD estimated from the CEU HapMap populations. Unfortunately, only the most significant odds ratios and Z scores are publicly available. In practice, we recommend using the Z scores for all of the SNPs as priors, imputing those that are missing from the study. For this reason, it is possible that the following designs could be further improved with the use of additional data from the original studies.
MULTIPOP explored all designs over subsets of the three populations, with a total size of 3000 cases and 3000 controls and a grid interval of 200 individuals. For each of the designs, we computed the expected average rank of the causal variants by integrating over each SNP in the considered windows, using the expected Z scores to compute priors (as described in detail above). As in the simulation studies, the optimal design varied widely from region to region, one population generally outperforming the others in terms of estimated LSR. However, as in our previous simulations, the overall most successful estimated design is a mixture of 600 CEU, 2800 YRI, and 2600 ASN individuals. Many other similar designs were close in expected LSR, so we believe that the grid interval was sufficiently granular. The most successful designs for the different loci as found by MULTIPOP are displayed in Table S1.
Discussion
Discovering causal variants through fine-mapping follow-up studies is one of the fundamental challenges facing the genetics community today. Although the list of novel loci associated with complex phenotypes is growing quickly, the precise variants altering function are not as forthcoming. As discussed in Lawrence et al.,7 the problem of genetically indistinguishable SNPs, in which two associated SNPs are in perfect LD, makes the problem of causal detection particularly challenging.
In this work, we challenge the intuitive assumption by which a study consisting of a single homogeneous population with a maximum genetic diversity is always the optimal strategy, particularly in the context of the fine-mapping stage. As opposed to this intuition, we show that the LSR of a causal variant increases consistently when multiple distant populations are genotyped in the follow-up study. One possible explanation for this phenomenon is that a combination of differences in LD structures among the populations results in a more robust strategy for fine mapping; indeed, we show that for every specific locus, the strategy involving multiple populations is rarely optimal but that when averaging across multiple loci, the strategy consistently provides improved LSR.
For the above reason, we do not advocate a general strategy of choosing many diverse populations when conducting fine mapping. Each study is different, and for some studies the optimal strategy will indeed consist of genotyping just a single population. As we show here, the optimal strategy depends on the specific loci, the relative risks, and the number of individuals to be genotyped. To this end, we have created a software package called MULTIPOP to aid researchers in choosing a successful design.
It is important to realize that the results demonstrated here by no means cover all possible scenarios of follow-up studies. Particularly, our analysis corresponds to an additive disease model with one causal SNP, and we treat one specific meta-analysis statistic. Any deviation from this scenario requires another similar analysis. Thus, researchers who are interested in using a different statistic, testing a different hypothesis (e.g., that the disease follows a dominance model and not an additive one), or optimizing a different metric for power are recommended to perform a set of simulations based on the framework suggested here. Furthermore, error in the variance-covariance matrix as a result of a finite reference sample size,20 as well as errors in the estimation of the relative risk, such as those from the winner's curse, might disturb the accuracy of the LSR estimates in MULTIPOP and, hence, the final design choices. The simulated data sets used in this work were based on the HapMap genotypes. As more sequence and denser genotype databases are becoming available (e.g., the 1000 Genomes Project21), these estimates will be more and more accurate and, thus, the choice of the study design will come closer and closer to the optimum.
Appendix
Accuracy of Meta-Analysis MVN Distribution
We assess the accuracy of the meta-analysis MVN distribution framework by comparing it to HapGen,11 a widely used and accepted method of simulating case-control panels. We randomly selected 1000 SNPs from chromosome 1 to serve as causal variants and took a window of 40 SNPs (20 downstream and 20 upstream of the causal SNP) to simulate 1000 loci for fine mapping. For each locus and each population, we used HapGen to generate 1000 case-control panels of 1000 cases and 1000 controls, each with a relative risk of 1.4. We compared the mean χ2, the average rank of the causal variant, and the fraction of noncausal SNPs with p values below 0.05 in this simulated data to results drawn from the MVN distribution for each locus by using MULTIPOP. For designs with multiple populations, we used the weighted sum of the Z score meta-analysis statistic to combine the data from each population. In addition, we compared the measures of effectiveness described above over the simulated and MVN-distribution-generated data. As shown in Table 1, the statistics estimated from the simulated data are very similar to those from the MVN distribution. There is a slight increase in the measures of LSR from the empirically generated data from HapGen. We believe that this is due to weaker correlation in the HapGen-generated data. Each recombination event in the Li-Stephens model will reduce the correlation and thereby improve the LSR of fine mapping.
Table 1.
Comparison between MVN and HapGen on Various Measures, Showing the Tight Correlation between the Results Obtained by MULTIPOP and those Obtained with the HapGen Method
|
χ2 |
Avg. Rank |
FP Rate |
||||
|---|---|---|---|---|---|---|
| Design | HapGen | MVN | HapGen | MVN | HapGen | MVN |
| CEU | 20.41 | 20.42 | 2.55 | 3.23 | 0.32 | 0.32 |
| ASN | 19.64 | 19.62 | 2.76 | 3.42 | 0.30 | 0.30 |
| YRI | 19.48 | 19.48 | 2.17 | 2.46 | 0.27 | 0.27 |
| CEU+ASN | 35.53 | 37.11 | 1.71 | 2.00 | 0.39 | 0.37 |
| CEU+YRI | 34.58 | 36.82 | 1.30 | 1.29 | 0.38 | 0.36 |
| YRI+ASN | 33.85 | 35.87 | 1.16 | 1.24 | 0.37 | 0.34 |
| CEU+YRI+ASN | 49.37 | 53.36 | 1.01 | 0.98 | 0.43 | 0.39 |
χ2 is the average χ2 value of the causal variant. Avg. Rank is the average rank of the causal variant. FP Rate is the average fraction of noncausal SNPs with p values below 0.05. The slight differences are most likely due to the modeling of recombination events in HapGen that break the LD structure.
Supplemental Data
Supplemental Data include one figure and one table and can be found with this article online at http://www.ajhg.org.
Supplemental Data
Web Resources
The URL for data presentend herein is as follows:
Acknowledgments
N.Z., T.G., and E.H. were supported by the Israeli Science Foundation, grant no. 04514831. E.H. and B.P. were supported by the National Science Foundation, grant IIS-071325412. E.Z. was supported by the National Institutes of Health and the National Cancer Institute, grant R01CA120120, and by the Komen Foundation for Breast Cancer Research, grant KG080165. Part of this work was done when E.Z. was a fellow of the Edmond J. Safra Bioinformatics program at Tel-Aviv University. E.H. is a faculty fellow of the Edmond J. Safra Bioinformatics program at Tel-Aviv University. We kindly thank the reviewers for their insightful comments.
References
- 1.Udler M.S., Meyer K.B., Pooley K.A., Karlins E., Struewing J.P., Zhang J., Doody D.R., MacArthur S., Tyrer J., Pharoah P.D., SEARCH Collaborators FGFR2 variants and breast cancer risk: fine-scale mapping using African American studies and analysis of chromatin conformation. Hum. Mol. Genet. 2009;18:1692–1703. doi: 10.1093/hmg/ddp078. [DOI] [PMC free article] [PubMed] [Google Scholar]
- 2.Easton D.F., Pooley K.A., Dunning A.M., Pharoah P.D.P., Thompson D., Ballinger D.G., Struewing J.P., Morrison J., Field H., Luben R., SEARCH collaborators. kConFab. AOCS Management Group Genome-wide association study identifies novel breast cancer susceptibility loci. Nature. 2007;447:1087–1093. doi: 10.1038/nature05887. [DOI] [PMC free article] [PubMed] [Google Scholar]
- 3.Ioannidis J.P.A., Ntzani E.E., Trikalinos T.A. ‘Racial’ differences in genetic effects for complex diseases. Nat. Genet. 2004;36:1312–1318. doi: 10.1038/ng1474. [DOI] [PubMed] [Google Scholar]
- 4.Frazer K.A., Ballinger D.G., Cox D.R., Hinds D.A., Stuve L.L., Gibbs R.A., Belmont J.W., Boudreau A., Hardenbol P., Leal S.M., International HapMap Consortium A second generation human haplotype map of over 3.1 million SNPs. Nature. 2007;449:851–861. doi: 10.1038/nature06258. [DOI] [PMC free article] [PubMed] [Google Scholar]
- 5.Han B., Kang H.M., Eskin E. Rapid and accurate multiple testing correction and power estimation for millions of correlated markers. PLoS Genet. 2009;5:e1000456. doi: 10.1371/journal.pgen.1000456. [DOI] [PMC free article] [PubMed] [Google Scholar]
- 6.Conneely K.N., Boehnke M. So many correlated tests, so little time! rapid adjustment of p values for multiple correlated tests. Am. J. Hum. Genet. 2007;81 doi: 10.1086/522036. [DOI] [PMC free article] [PubMed] [Google Scholar]
- 7.Lawrence R., Evans D.M., Morris A.P., Ke X., Hunt S., Paolucci M., Ragoussis J., Deloukas P., Bentley D., Cardon L.R. Genetically indistinguishable SNPs and their influence on inferring the location of disease-associated variants. Genome Res. 2005;15:1503–1510. doi: 10.1101/gr.4217605. [DOI] [PMC free article] [PubMed] [Google Scholar]
- 8.Skol A.D., Scott L.J., Abecasis G.R., Boehnke M. Joint analysis is more efficient than replication-based analysis for two-stage genome-wide association studies. Nat. Genet. 2006;38:209–213. doi: 10.1038/ng1706. [DOI] [PubMed] [Google Scholar]
- 9.Pritchard J.K., Przeworski M. Linkage disequilibrium in humans: models and data. Am. J. Hum. Genet. 2001;69:1–14. doi: 10.1086/321275. [DOI] [PMC free article] [PubMed] [Google Scholar]
- 10.International HapMap Consortium A haplotype map of the human genome. Nature. 2005;437:1299–1320. doi: 10.1038/nature04226. [DOI] [PMC free article] [PubMed] [Google Scholar]
- 11.Spencer C.C.A., Su Z., Donnelly P., Marchini J. Designing genome-wide association studies: sample size, power, imputation, and the choice of genotyping chip. PLoS Genet. 2009;5:e1000477. doi: 10.1371/journal.pgen.1000477. [DOI] [PMC free article] [PubMed] [Google Scholar]
- 12.Li N., Stephens M. Modeling linkage disequilibrium and identifying recombination hotspots using single-nucleotide polymorphism data. Genetics. 2003;165:2213–2233. doi: 10.1093/genetics/165.4.2213. [DOI] [PMC free article] [PubMed] [Google Scholar]
- 13.Kavvoura F.K., Ioannidis J.P.A. Methods for meta-analysis in genetic association studies: a review of their potential and pitfalls. Hum. Genet. 2008;123:1–14. doi: 10.1007/s00439-007-0445-9. [DOI] [PubMed] [Google Scholar]
- 14.Zeggini E., Scott L.J., Saxena R., Voight B.F., Marchini J.L., Hu T., de Bakker P.I.W., Abecasis G.R., Almgren P., Andersen G., Wellcome Trust Case Control Consortium Meta-analysis of genome-wide association data and large-scale replication identifies additional susceptibility loci for type 2 diabetes. Nat. Genet. 2008;40:638–645. doi: 10.1038/ng.120. [DOI] [PMC free article] [PubMed] [Google Scholar]
- 15.Birney E., Stamatoyannopoulos J.A., Dutta A., Guigó R., Gingeras T.R., Margulies E.H., Weng Z., Snyder M., Dermitzakis E.T., Thurman R.E., ENCODE Project Consortium. NISC Comparative Sequencing Program. Baylor College of Medicine Human Genome Sequencing Center. Washington University Genome Sequencing Center. Broad Institute. Children's Hospital Oakland Research Institute Identification and analysis of functional elements in 1% of the human genome by the ENCODE pilot project. Nature. 2007;447:799–816. doi: 10.1038/nature05874. [DOI] [PMC free article] [PubMed] [Google Scholar]
- 16.Stacey S.N., Manolescu A., Sulem P., Thorlacius S., Gudjonsson S.A., Jonsson G.F., Jakobsdottir M., Bergthorsson J.T., Gudmundsson J., Aben K.K. Common variants on chromosome 5p12 confer susceptibility to estrogen receptor-positive breast cancer. Nat. Genet. 2008;40:703–706. doi: 10.1038/ng.131. [DOI] [PubMed] [Google Scholar]
- 17.Zheng W., Long J., Gao Y.-T.T., Li C., Zheng Y., Xiang Y.-B.B., Wen W., Levy S., Deming S.L., Haines J.L. Genome-wide association study identifies a new breast cancer susceptibility locus at 6q25.1. Nat. Genet. 2009;41:324–328. doi: 10.1038/ng.318. [DOI] [PMC free article] [PubMed] [Google Scholar]
- 18.Thomas G., Jacobs K.B., Kraft P., Yeager M., Wacholder S., Cox D.G., Hankinson S.E., Hutchinson A., Wang Z., Yu K. A multistage genome-wide association study in breast cancer identifies two new risk alleles at 1p11.2 and 14q24.1 (RAD51L1) Nat. Genet. 2009;41:579–584. doi: 10.1038/ng.353. [DOI] [PMC free article] [PubMed] [Google Scholar]
- 19.Gold B., Kirchhoff T., Stefanov S., Lautenberger J., Viale A., Garber J., Friedman E., Narod S., Olshen A.B., Gregersen P. Genome-wide association study provides evidence for a breast cancer risk locus at 6q22.33. Proc. Natl. Acad. Sci. USA. 2008;105:4340–4345. doi: 10.1073/pnas.0800441105. [DOI] [PMC free article] [PubMed] [Google Scholar]
- 20.Zaitlen N., Kang H.M., Eskin E. Linkage effects and analysis of finite sample errors in the HapMap. Hum. Hered. 2009;68:73–86. doi: 10.1159/000212500. [DOI] [PMC free article] [PubMed] [Google Scholar]
- 21.Siva N. 1000 Genomes project. Nat. Biotechnol. 2008;26:256. doi: 10.1038/nbt0308-256b. [DOI] [PubMed] [Google Scholar]
Associated Data
This section collects any data citations, data availability statements, or supplementary materials included in this article.