

Abstract
Barrett’s esophagus is the strongest risk for esophageal adenocarcinoma (EAC), a malignancy with persistently poor long-term outcomes. EAC is thought to develop through progression of metaplasia to dysplasia to invasive carcinoma. Identification of factors predicting progression to EAC would help in focusing surveillance, chemoprevention or ablation at those deemed to be at highest risk of progression. We performed a comprehensive review of the literature and summarized current evidence on risk factors for progression in subjects with known BE. Clinical and demographic factors (age, male gender, length of BE segment) are associated with modestly increased odds of progression to EAC in some studies. Biomarkers such as aneuploidy and p53 loss of heterozygosity have been associated with increased risk of progression to high-grade dysplasia and / or EAC in single center prospective cohort studies. Promising newer techniques and markers have been recently reported with the potential to help risk stratify BE subjects. Development of a comprehensive BE risk progression score comprised of both clinical and biomarker variables should be the ultimate goal and can be achieved by multicenter prospective collaborative efforts. Though challenging, creation of such a score has the potential to improve outcomes and make the management of patients with BE more cost effective.
INTRODUCTION
The incidence of esophageal adenocarcinoma (EAC) continues to rise faster than that of any other malignancy in the United States over the last few decades (1). Barrett’s esophagus (BE) is the most significant risk factor known for the development of EAC (2,3). The long-term survival of patients with EAC who present with symptoms remains dismal. This evidence from retrospective studies found that patients diagnosed with EAC in BE surveillance programs may have better survival than those diagnosed after the onset of symptoms (4,5) has led to recommendations for the endoscopic surveillance of patients diagnosed with BE to detect progression to dysplasia and / or EAC (6).
Surveillance of patients with BE is challenging given the low rate of progression to EAC, particularly in patients without dysplasia (7). The potentially large number of patients with BE (population prevalence of 1.6% reported by a Scandinavian study (8)), which makes the estimate of subjects requiring surveillance run into millions in the United States, is one of many barriers to efficient and effective surveillance (9). Despite multiple limitations (10), the grade of dysplasia remains the most widely used tool to assess the risk of progression in BE. However, surveillance of all patients with BE remains an expensive and not a cost-effective proposition (11).
Crucial to the determination of factors predictive of progression is a clear understanding of the rate of progression to EAC and / or high-grade dysplasia (HGD) in patients with BE. Early studies reported a fairly alarming rate of progression to EAC in BE (12–14). However, a landmark study by Shaheen et al. (7) revealed a publication bias in the reporting of progression rates in patients with BE (7). They estimated the risk of progression to EAC to be 0.5% per patient year of follow up. Two recent meta-analyses (15,16) provide very similar estimates of risk of progression in patients with BE. Results from these studies are summarized in Table 1. These relatively low estimates reinforce the need for the development of a risk stratification tool which allows the targeting of a high-risk group with intensive endoscopic surveillance to make surveillance truly cost-effective. Assessment of the current knowledge gaps would be of crucial importance in devising a future road map for the development of a practical, cost-effective and widely applicable tool for the risk stratification of patients with BE.
Table 1.
Summary of rates of progression to EAC/HGD in BE
| Reference | Sample size | EAC incidence rate | EAC or HGD incidence rate |
|---|---|---|---|
| Yousef et al. (16) | *11,279 patients *47,496 p-yr follow up |
*All patients included: 6.1/1,000 p-yr *Prevalent Ca (in 1 year) excluded: 5.3/1,000 p-yr *Prevalent Ca & HGD excluded: 4.1/1,000 p-yr |
*All patients included: 10/1,000 p-yr *Prevalent Ca & HGD (in 1 year) excluded: 9.3/1,000 p-yr *Prevalent HGD: 9.1/1,000 p-yr |
| Wani et al. (15) | *Baseline No dysplasia -6,847 patients *Baseline LGD -1,512 patients *Baseline HGD-236 |
*No dysplasia: 5.9/1,000 p-yr (WIR) *LGD: 16.9/1,000 p-yr (WIR) HGD: 65.8/1,000 p-yr (WIR) |
Not reported |
BE, Barrett’s esophagus; EAC, esophageal adenocarcinoma; HGD, high-grade dysplasia; LGD, low grade dysplasia; p-yr, patient-years.
A multitude of clinical, endoscopic, and genetic markers have been studied to either complement or replace dysplasia as a tool to risk stratify patients with BE in terms of their risk of progression to EAC. Development of such a predictive multipronged score (incorporating multiple clinical and genetic factors) has been described as the “holy grail” in the management of patients with BE (17), which would allow the focusing of surveillance endoscopy on subjects deemed to be at a higher risk of progression to EAC, making this strategy economically sound and cost effective.
In this review, we aimed to comprehensively review, critically assess, and summarize the current literature on factors predicting progression to EAC in patients with known BE. We restricted our review to studies focusing on the risk of progression to HGD / EAC in patients with known BE published as full manuscripts although a few recently published abstracts reporting potentially important developments in this area were included. References were obtained by searching the Medline database from 1970 to 2009 January using search terms: Barrett’s esophagus/oesophagus, esophageal/oesophageal adenocarcinoma, progression, predictors, esophageal neoplasia, and biomarkers. In addition, additional articles were obtained by cross referencing studies mentioned and cited in the articles obtained by initial searches.
PREDICTORS OF PROGRESSION IN BARRETT’S ESOPHAGUS
Patient predictors
Age
Though many investigators have identified increasing age as a risk factor for prevalent dysplasia/EAC in BE subjects (18–21), data on the influence of age on progression to EAC are limited. In an initial report from the Cleveland Clinic (22), age-predicted progression to any dysplasia; in a more recent report (23), the rate of incident dysplasia/EAC did not differ between BE patients younger and older than 50 years. Analysis from other larger cohorts has also not identified increasing age as a risk factor for progression (18,19). A recent preliminary report from a multicenter database comparing progressors and non progressors reported that the mean age at initiation of surveillance in progressors (77.1 years) was significantly greater than in non progressors (68.6 years) (24). In conclusion, there is insufficient data at this time to support age as a risk factor in the progression to HGD/EAC.
Gender
Male predominance in patients with EAC is well recognized (1). The influence of gender on the rate of progression to EAC/HGD is less clear. A recent systematic review (16) suggested that the incidence of EAC was more than twice as high in men with BE (1.01/100 patient years) compared with women (0.45/100 patient years). Bani-Hani et al. (25) reported that male gender was a risk factor for the development of EAC in patients with BE. The study included 44 patients with EAC, of whom only 13 were incident cases. A more recent hospital-based case – control study (26) also reported that male gender was a predictive factor in developing EAC (similar to some older studies (27)), but it is unclear if this was substantiated by multivariable analysis. Other prospective studies have not substantiated this finding (19). The preponderance of evidence appears to suggest that male gender is a risk factor for progression to HGD/EAC in patients with BE.
Body mass index/visceral adiposity
In the United States and other developed countries, obesity has increased in epidemic proportions (28). There is emerging consensus on the association between EAC and obesity particularly visceral/abdominal obesity (29–31). However, data on the effect of obesity on BE progression to cancer are sparse and conflicting (see Table 2). Though a case – control study suggested a positive correlation (26), this was not borne out by other studies (32). Cross-sectional studies have shown some association between measures of abdominal fat and biomarkers of progression (see Table 2). Indeed, waist – hip ratio of BE patients has been shown to correlate with the prevalence of combined LGD and HGD (33). Abdominal obesity is more common in men and this may explain the higher risk of progression in men as suggested in some studies. The influence of body fat on progression in BE may be predominantly mediated by abdominal adipose tissue, which has been shown to be metabolically active producing proinflammatory cytokines and chemokines. Though there is biological plausibility, evidence to support the role of obesity/visceral obesity on progression in BE is limited.
Table 2.
Summary of clinical factors influencing progression to EAC in patients with BE
| Clinical variable | Reference | Design | Sample size | End point | Predictive ability | Comments |
|---|---|---|---|---|---|---|
| Age | Guardino (23) | Cohort | 837 | EAC/HGD | No difference in rates of progres- sion in < 50 and > 50 year olds |
Only 10 patients with incident EAC/HGD |
| Weston (18) | Cohort | 550 | EAC/mHGD | No | HR not provided | |
| Oberg et al. (19) | Cohort | 140 | EAC/HGD | No HR 1.062 (0.98, 1.16) | Only 7 developed incident EAC/HGD |
|
| Male gender | Yousef (16) | Metanalysis | NA | EAC | Yes Incidence rate ratio (2.3) | Subgroup analysis of 11/47 studies included |
| Menke-Pluymers (27) |
Case–control | 96 BE, 62 EAC |
EAC | Yes 2.4 (CI not available) P=0.06 | ||
| Oberg (19) | Cohort | 140 | EAC/HGD | No 3.1 (0.01, 829) | Only 7 developed incident EAC/HGD |
|
| Adiposity BMI | DeJonge (26) BMI > 25 at age 20 |
Case–control | 91 EAC, 244 BE |
EAC | Yes OR 2.6 (1.2, 5.5) | Self reported BMI, non validated questionnaire |
| Waist – hip ratio | Vaughan (32) | Cross-Sec- tional study |
439 | Aneuploidy 17pLOH |
4.3 (1.2, 15) 3.9 (1.3, 11.4) | No association with BMI |
| Moe (33) | Cross-sec- tional study |
51 | Percentage of cells in S and G2 phase |
*WHR correlated with Percentage of S-phase cells (r=0.33) *Increasing weight after 25 years correlated with percentage of G2 phase cells (r=0.39) *WHR higher in group with HGD/LGD than in NDBE |
Surrogate markers of progression used. Subsequent publication did not fi nd that higher proliferative fractions were associated with progression to EAC (117) |
|
| BE segment length |
Weston (18) | Prospective cohort |
374 | EAC/mHGD EAC/anyHGD |
Yes HR 1.15 (1.03,1.29) No | Association with length lost when only patients with no HGD at baseline included in model |
| Sato (141) | Case–control study |
62 (35 progressors, and 27 non- progressors) |
EAC/HGD | Yes (component of model consisting of baseline path and methylations index) Individual HRs not provided. |
Small study, retrospective | |
| Yousef (16) | Meta-analysis | NA | EAC/HGD | Incidence in LSBE (6.7/1,000 pys) and in SSBE (6.1/1,000 pys) comparable |
Subset analysis, small number of end points |
|
| Rudolf (39) | Prospective cohort study |
309 | EAC, aneu- ploidy |
*No association between length and EAC risk in patients with baseline HGD *In the absence of baseline HGD, non-signifi cant trend toward increase in the risk of progression (most in those with > 10 cm of BE) |
*Importance of baseline dysplasia (especially HGD) highlighted. *Risk of EAC in SSBE not substantially lower than that in LSBE *Similar non-signifi cant trend noted for Aneuploidy as well. |
EAC, esophageal adenocarcinoma; HGD, high grade dysplasia; mHGD, multifocal high grade dysplasia; WHR, waist hip ratio; BMI, body mass index; LSBE, long segment barrett’s esophagus; SSBE, short segment barrett’s esophagus.
Age modelled as continuous variables in all studies except by Guardino (23) (where modelled as dichotomous variable: less than 50 years or more than 50 years). HRs refl ect estimates of risk per year of age except when modelled as a dichotomous variable.
Gender modelled as a dichotomous variable. Estimates refl ect risk estimate with male gender.
BMI modelled as dichotomous variable (greater than or less than 25).
WHR modelled as quartiles (4th vs. 1st). HRs refl ect risk of being in 4th (highest) vs. 1st (lowest) quartile. BE segment length modelled as continuous variable. HRs refl ect estimates of risk per cm increase in BE segment length.
Smoking
The association of smoking with Barrett’s progression to adenocarcinoma is much weaker than that with squamous cell carcinoma. Performing a multivariate analysis, the Rotterdam Esophageal Tumor Study Group found that the odds of EAC in smokers were 2.3 times higher compared with non-smokers (27). Gray et al. (34) similarly found the median duration as well as the number of pack-years of smoking to be higher with EAC compared with BE patients (median 29.5 vs. 38.5 years, P < 0.003 and median 15 vs. 55.25 pack-years, P < 0.001). Other investigators have not found smoking to be significant for progression (25,35). The published studies suffer from problems of variable definition of Barrett’s, inclusion of prevalent and incident cases together and relatively small sample sizes to adequately control for confounding factors. The association of smoking with Barrett’s progression to adenocarcinoma appears to be much weaker than that with squamous cell carcinoma.
Diet and nutritional supplementation
Several large case–control studies have suggested increased odds of EAC with high fat diet (36) and lower intake of fruits and vegetables (37) but none of them have used patients with BE as the control group. Using a self-administered questionnaire, the prospective Seattle Barrett’s registry with a mean follow up of 5 years showed decreased risk of EAC in consumers of multivitamins (HR 0.38, 95% CI 0.15–0.99), vitamin C (HR 0.25, 95% CI 0.11–0.58) and vitamin E (HR 0.25, 95% CI 0.10–0.60) (38). Serum selenium was shown to have a significant negative correlation with G 2 fraction, an important cell cycle marker for progression (33), and this was reinforced by another study that showed a lower risk of aneuploidy (OR = 0.4, 95% CI = 0.2–0.8), p53 loss of heterozygosity (LOH) (OR = 0.5, 95% CI = 0.2–0.9) and HGD (OR = 0.5, 95% CI = 0.3–0.9) in the upper three quartiles compared with lowest quartile of serum selenium levels (39). Thus, cross sectional evidence suggests a direct or indirect (via obesity) association of dietary factors with EAC risk but due to limitations of dietary assessments, it is likely to have poor predictive power.
Acid suppression (medical and surgical therapy), aspirin, NSAIDs
Although chronic GERD has been shown to be the most significant risk factor for EAC (40) acid suppression does not appear to be very efficacious in reducing the neoplastic progression in BE. Proton pump inhibitors were shown to reduce cell cycle abnormalities in BE (41) but can have variable biological effects. Consistent and profound intraesophageal acid suppression inhibits proliferation, (42) but leads to elevated gastrin, which is a proliferative stimulus for BE (43). A cohort study showed a multivariate HR of 0.25 (95% CI 013–0.47) for any dysplasia in BE patients treated with PPI (44). LGD may have been a poor ideal end point for this study as it can be confused with regenerative atypia (45). Another study reported that delay in PPI use following the diagnosis of BE was associated with higher odds of LGD/HGD/EAC diagnosis (46). Other epidemiological studies (4,47), randomized controlled trials (48) and meta-analyses (49) have failed to confirm the impact of acid suppression on the development of dysplasia or cancer irrespective of medical or anti-reflux surgical therapy. A rigorous meta-analysis of 25 studies (50) reached the conclusion that the risk reduction in progression to EAC reported in patients undergoing surgical therapy is most likely due to bias introduced by uncontrolled case series and not statistically different if controlled data are analyzed (6.5 cases/1,000 patient years in the medical group vs. 4.8/1,000 patient years in the surgical group). Long-term follow up of patients in the randomized controlled LOTUS trial will hopefully provide us with more information on the influence of surgical vs. medical acid suppression on outcomes in BE (51). Curiously, Carlson et al. (52) showed that acid suppression reduced oxidative damage in p53 negative, but not p53 positive biopsies arguing that once genetically unstable clones develop, acid suppression may be ineffective. Thus, timing of acid suppression may be important. Although chronic GERD has been shown to be the most significant risk factor for EAC (40) the evidence base for acid suppression in reducing the neoplastic progression in BE is weak. The ongoing AspECT trial (clinical trials.gov, NCT00357682) may provide some definitive answers with regards to use of these medications to reduce EAC risk (53).
Epidemiological data support the association of aspirin/NSAIDs and decreased EAC risk (54). Subsequently, a study of 350 participants with a mean follow up of 65.5 months showed a 5-year cumulative incidence of EAC to be 14.3% for never users and 6.6% for current users of NSAIDs with an NNT of 13 (55). Other cohort studies in high-risk populations also support this finding (56). The current evidence appears to support a role for the use of aspirin and NSAIDs in the prevention of progression to EAC, though stronger data (hopefully available from the AspECT study and another NCI-sponsored study: NCT00474903) will be needed to make a firm recommendation.
Endoscopy predictors
Length
The length of the BE segment has been intensively studied as a risk factor influencing the risk of progression to EAC/HGD by prospective and retrospective studies. Sample size limitations have impeded the ability of most studies to reach definitive conclusions (see Table 2). Retrospective studies (27,35) have found that length of the BE segment is a risk factor for HGD/EAC on multivariable analyses. However, these studies are biased by the inclusion of patients with prevalent HGD/EAC. Prospective studies (57,58) have reported increasing BE length as predictive of increasing risk of progression. In another report (22), increasing BE segment length predicted progression to any dysplasia or EAC. It is interesting to note that LGD was also an event in this analysis (comprised most of the events). Contrary views have been expressed by others (16,19,39). A large prospective cohort study found that after adjustment for histology at study entry, segment length was not a significant predictor of progression (39). A similar conclusion was drawn in a meta-analysis (16). The authors in the metaanalysis, however, point out that only six studies provided data to calculate the incidence of cancer in SSBE, and these studies included 1,400 person-years and only seven incident cancers. Another meta-analysis by Thomas (59) showed a trend toward lower incidence in patients with SSBE, but this analysis was also based on data from a small number of studies. The association of length of the BE segment with higher prevalence of dysplasia (21), is an important confounder in the association of BE segment length with the risk of progression.
In summary, though there appears to be a suggestion that increasing segment length may predict increased risk of progression to EAC in patients without HGD at baseline, larger studies with adjustment for baseline dysplasia are needed to definitively assess this trend. At this time, a cutoff length at which the risk of HGD/EAC increases significantly is not known.
Nodularity
The presence of nodularity or visible endoscopic lesions has been correlated with increased risk of progression to EAC in patients with HGD. A retrospective cohort study (60) found that the presence of a visible mucosal abnormality (defined as subtle mucosal elevation 1 cm or less in diameter) increased the risk of progression to EAC by 2.5 times on multivariable analysis (HR 2.6, 95% CI 1.2, 5.4). A second cross-sectional study (61) also reported that subjects with ulcers and HGD had a higher prevalence of invasive cancer (80%) than those without ulcers (52%). Both studies suggest that the presence of a visible lesion is perhaps indicative of more aggressive biology and may warrant more aggressive surveillance and therapy. It is interesting to note that the presence of visible lesions has not been studied in patients without HGD. It is also known that the best method of assessing the histology of visible lesions in BE is endoscopic mucosal resection which may upstage histology in 40–50% (62,63) of subjects. Hence, in a substantial proportion of patients, nodularity may reflect prevalent HGD or EAC than a marker of future progression. This has also been shown in studies which have correlated nodularity in HGD with the presence of undetected EAC (usually mucosally confined) at esophagectomy (64,65). Recent advances with imaging techniques such as narrow band imaging (66), high resolution imaging and autofluorescence imaging have improved the ability to detect prevalent (and perhaps incident) dysplasia in BE segments: this is however beyond the scope of this review. In summary, while the presence of nodularity does appear to increase the risk of progression in BE, this may also reflect prevalent HGD or EAC.
Hiatal Hernia length
Patients with BE are known to have more severe gastroesophageal reflux than those with non erosive or even erosive disease with more severe physiological defects as well (35). The length of the HH (greater than 6 cm and analyzed as a dichotomous variable) was predictive of progression to HGD/EAC on multivariate analysis in a large cohort study (58). However, it is noteworthy that this association disappeared if only the group with baseline no dysplasia or LGD was studied. A large case–control study (35) also found that the length of the HH (analyzed as a continuous variable) was an independent predictor for HGD/EAC on multivariable analysis (OR 1.2 95% CI 1.04, 1.27). In summary, increasing size of HH appears to be modestly correlated with a higher risk of progression to EAC in patients with BE. A possible explanation for this association would be that the length of the HH is a surrogate marker for the severity of gastroesophageal reflux, which has been shown in in vitro studies to promote proliferation of BE epithelial cells (42).
Pathology
Grade of dysplasia
The grade of dysplasia continues to be the bedrock of risk stratification in patients with BE. This classification is based on the categories developed for patients with inflammatory bowel disease (67) and continues to be used in the United States in patients with BE (68). The currently accepted paradigm attempts to correlate the risk of progression to the grade of dysplasia (69) based on circumstantial evidence that progression occurs in an orderly fashion from no dysplasia to LGD to HGD followed by EAC. However, this may not always occur (20,58,70).
The debate continues on whether LGD confers a higher risk of progression than NDBE (20,22,71–73). The reported rate of progression to EAC in patients with LGD has varied from 0.6–1.2% per year. A recent meta-analysis reported that the rate of progression to EAC in LGD was 16.98/1,000 person-years compared with 5.98/1,000 person-years in subjects with no dysplasia, (15) but there was significant heterogeneity between the studies. Another study reported that 9 of 34 patients with incident LGD progressed to EAC/HGD over 8 years; leading to a rate of progression of 2.3/1,000 person years (74). This study had a number of limitations. Other investigators have correlated the rate of progression to the number of pathologists who agree on the diagnosis of LGD (75); the cumulative rate of progression was higher when more than one pathologist agreed with the diagnosis of LGD (28 vs. 41%) and was 80% when three pathologists agreed with the diagnosis of LGD. This suggests that some of the limitations with LGD relate to interobserver variability. The most recent guidelines on the management of LGD in BE recommend that the diagnosis of LGD be confirmed by an expert GI pathologist (6).
Though there is a better consensus on the rate of progression of HGD to EAC (76), the reported rates of progression to EAC in patients with HGD varies from 16% (77) over 7 years to over 50% (60,78) in 5 years. Though different populations and study designs may account for some of this variation, other limitations of dysplasia grading in BE include significant interobserver variation among expert pathologists (79–81) as well as between community and academic pathologists (82) and sampling error that may contribute to the apparent “regression” of dysplasia during surveillance (3). In summary, the grade of dysplasia is an imperfect but perhaps the most widely used and accepted marker for risk stratification in BE.
Extent of dysplasia
In an effort to improve the predictive value of dysplasia grading, efforts have been made to correlate the extent of dysplasia to the risk of progression to EAC. In patients with HGD, the extent of dysplasia (focal: when confined to less than five crypts in one biopsy specimen, diffuse: more than 5 crypts or more than one biopsy specimen) was found to predict the risk of progression to EAC (14% at 3 years in focal HGD vs. 56% in diffuse HGD) in one study (60). However, a subsequent study failed to identify this correlation using a variety of classification criteria (83). A more recent study also found an association between the extent of LGD (measured by the total number and fraction of dysplastic crypts) and the risk of progression to EAC (84). However, this correlation did not extend to HGD. In summary, while the extent of dysplasia has some data to support its role as a predictor of progression in BE and is intuitively appealing, the labor intensive nature of this technique makes widespread application of this technique challenging (85).
Biomarker predictors
None of the currently known clinical and endoscopical criteria have sufficient predictive power to identify Barrett’s progressors in a clinically useful manner leading to interest in the identification of molecular biomarkers for progression. The feasibility of this approach is heightened based on data that show detection of p53 LOH in BE individuals to increase the odds of progression by as much as 16 (86). Biomarker-based prediction is very attractive but a pragmatic publication highlighted several problems associated with identification of clinically useful cancer biomarkers related tooverfitting (small ratios of subjects to predictive variables), bias from unconventional situations (e.g., analysis of samples by mass spectrophotometer on different days), impact of specimen handling on biomarker expression, lack of reproducibility of assays between laboratories (87) and lack of prospective controlled trials due to associated costs and need for large sample sizes. In fact, reanalysis by repeated random sampling of the largest published DNA microarray studies showed that genes able to predict prognosis were highly dependent on the selection of patients in the training set (88). This suggests need for caution in the interpretation of biomarker studies that use large data sets such as DNA microarray repositories. Nevertheless, molecular biomarkers have the potential to decrease the interobserver disagreement seen with the pathologist reading of dysplasia and provide a much longer detection window for risk stratification and intervention (86,89,90). With the goal of standardizing biomarker discovery and validation, the Early Detection Research Network (EDRN) has proposed five phases of biomarker study (91) (See Table 3). In the current review, where possible we have focused on discussing the biomarkers evaluated in phase 3 & 4 studies. None of the biomarkers for BE progression has been studied in phase 5 studies. Several important concepts related to biomarker predictors are important to understand before effective application of biomarkers for clinical use (see Table 4). The data on individual biomarkers are discussed below and the salient features are summarized in Table 5.
Table 3.
Phases of Biomarker Validation and Development (91)
| Phase 1 | Biomarkers of promise are identifi ed based on application in other cancers and elucidation of novel pathways |
| Phase 2 | Cross sectional studies validate the biomarker of interest to be suffi ciently discriminatory and biomarker assays are standardized |
| Phase 3 | Case–control studies confi rm the biomarker to be expressed before the development of cancer with a retrospective but longitudinal design |
| Phase 4 | Prospective longitudinal studies avoid biases associated with Case–control studies |
| Phase 5 | Population-based studies show impact of biomarker detection on disease burden and cancer control |
Table 4.
Important concepts relevant to clinical application of biomarkers
| Concepts | Supportive data | Clinical implications |
|---|---|---|
| 1. Size and number of clones |
Addition of p53 LOH clone size to mere presence of p53 LOH improved prediction of cancer risk (RR for 5 cm of clone: 7.37 vs. 1.27) (92) Barrett’s segments with more clones progressed to EAC more quickly than segments with fewer clones (142) |
Biopsies at several levels within the BE segment and not just 1–2 representative biopsies may be needed Impacts design of future biomarker-based studies. |
| 2. Method of detection | Detection of p53 alterations by IHC (100–102) vs. mutational analysis (103) has different sensitivities |
Technique of detection could affect perform- ance |
| 3. Biomarker panels | 17pLOH, aneuploidy, tetraploidy and 9pLOH predicted cancer risk in BE patients at 10 years follow up with an RR of 38.7 compared with 10.6 for 17pLOH alone (56) A panel of three performed better than the individual genes for accurate classifi cation of NDBE and EAC (143) |
Biomarker panels may be more effective predictors |
EAC, esophageal adenocarcinoma; IHC, Immunohistochemistry; LOH, loss of heterozygosity.
Table 5.
Summary of molecular biomarkers infl uencing progression to EAC in patients with BE
| Biomarker variable | Phase | Sample size/initial histology | Technique | End point | Predictive ability |
|---|---|---|---|---|---|
| DNA content Abn. | |||||
| Aneuploidy / tetraploidy |
4 (78) | 327 Variable | Flow Cytometrya | EAC | RR 11 (5.5–21) |
| 4 (90) | 30 All IM | Flow Cytometryb | HGD/EAC | RR 12 | |
| Tumor suppressor Loci | |||||
| p53 LOH | 4 (89) | 325 Variable | Locus specific PCR | EAC | RR 16 (6.2–39) |
| p53 staining | 3 (101) | 25 LGD | IHC | HGD/EAC | Sens. 100%, spec. 93%, PPV 56% |
| 4 (100) | 48 LGD | IHCc | HGD/EAC | RR 5.7 | |
| 3 (102) | 197 > 98% IM | IHC | EAC | OR 11.7 (1.93–71.4) | |
| Epigenetics | |||||
| p16 Methylation | 3 (108) | 53 Variable | RT-PCR | HGD/EAC | OR 1.74 (1.33 – 2.20) |
| Any p16 lesion | 4 (92) | 267 Variable | LOH, DNA sequencing, Methylation based PCR |
EAC | RR 1.84 (1.16 – 2.82)d |
| 2 (111) | 27 Variable | Flow Cytometrye | NA | Not significant | |
| Cell cycle markers | |||||
| Cyclin D1 | 3 (110) | 307 NA | IHC | EAC | OR 6.8 (1.6 – 29.9) |
| 3 (102) | 197 > 98% IM |
IHC | EAC | OR 0.81 (0.14 – 4.58) | |
| Proliferation | |||||
| Mcm2 | 3 (116) | 27 Variable | IHC | EAC | 28.4% in progressors vs. 3.4% in non- progressors, P< 0.001 |
| ↑G2 fraction | 4 (117) | 362 Variable | Flow Cytometrya | EAC | RR 1.36 (1.26 – 1.41)f |
| 2 (111) | 27 Variable | Flow Cytometryd | NA | Not significant |
EAC, esophageal adenocarcinoma; HGD, high grade dysplasia; IHC, Immunohistochemistry; LOH, loss of heterozygosity; NA, Not available.
Ki67/DNA content multiparameter fl ow cytometry.
DNA/protein fl ow cytometry.
Computerized quantitation.
For every 5 cm of a clone.
Modifi cation of Reid BJ et al.
For each 1% increase.
For analysis, aneuploidy, tetraploidy, p53 LOH, p53 staining, p16 methylation, p16 LOH and cyclin D1 were categorized as normal or abnormal. Mcm2 was reported as a continuous variable defi ned by percentage of positively stained surface cells. G2 fraction was expressed as a percentage and analyzed for each 1% increase.
DNA content abnormalities (aneuploidy/tetraploidy)
Aneuploidy and tetraploidy refer to numerical and/or structural changes in chromosomes leading to abnormal DNA content and are one of the most studied biomarkers for Barrett’s progression with at least four phase 4 studies (78,86,89,92). Aneuploidy refers to the condition when cells have an abnormal number of chromosomes (60, 90, etc.) unlike the normal complement of 46 chromosomes (2N). Tetraploidy refers to the specific instance of aneuploidy when the chromosomal number in a cell is double that of normal cells (4N vs. 2N). Although many of the published studies used overlapping populations from a single institution, in a large BE cohort, aneuploidy and/or tetraploidy proved to be substantially useful to risk stratify the difficult group of NDBE and LGD with 5-year cumulative cancer incidence rates of 28% compared with 0% without (86). Evaluating tetraploidy alone, the RR of cancer in patients with increased 4N compared with those without was 7.5 (95% CI 4.0, 14). This was also shown in another phase 3 study (90).
Despite good phase 4 data, aneuploidy/tetraploidy as a marker has not been widely used because of technical challenges with flow cytometry in addition to need for special media. To improve the clinical applicability of aneuploidy testing, laser scanning cytometry (LSC) that measures aneuploidy based on nuclear staining intensity has been performed on paraffin-embedded, formalinfixed tissues with encouraging results (93,94). To make LSC completely automated, we recently used cytokeratin labeling to identify epithelial cells and calculate aneuploidy as the ratio of intensity of nuclear staining between cytokeratin-positive and cytokeratin-negative cells (95) (see Figure 1). This remains to be further tested in prospective studies. Newer promising techniques such as array-based comparative genomic hybridization to detect copy number variations in BE tissue (which correlate well with aneuploidy) have been described (96). In summary, DNA content abnormalities appear to be an accurate marker of progression in subjects with BE, but have not been widely used due to technical challenges with flow cytometry in addition to need for special media.
Figure 1.
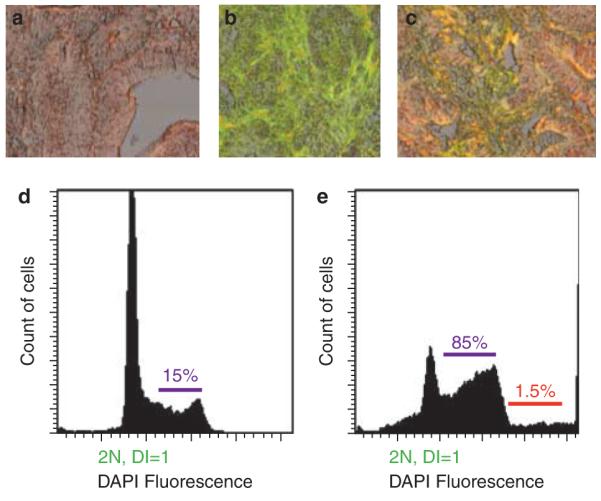
Automated cytokeratin-assisted laser scanning cytometry for calculations of aneuploidy. Representative images of DAPI staining for nuclei (a), cytokeratin staining to identify epithelial cells (b) and overlay of the two (c) (×20 magnification). The histograms show results of these calculations from sections with intestinal metaplasia (d) and high-grade dysplasia (e). More DAPI fluorescence indicates more DNA content. Note the shorter 2N (diploid) peak in (e) compared with (d) that suggests a higher number of cells with > 2N DNA content, hence aneuploidy. The red line in e indicates extreme aneuploidy (> 5N). The second smaller peak in d shows normal 4N (tetraploid) fraction that represents the normal doubling of chromosomes in the S phase of cell cycle.
Tumor suppressor loci abnormalities
LOH for p53, a tumor-suppressor gene, has been shown to be the strongest predictive factor for Barrett’s progression (97,98). LOH refers to loss of normal function of the other allele of a gene when one of the alleles is already inactivated. A phase 4 study of 325 patients showed that p53 LOH significantly increased risk of progression to EAC (relative risk 16, P < 0.0001) (89). p53 Immunohistochemistry (IHC) was shown to be 88–100% sensitive and 75–93% specific for progression to HGD/CA with LGD (99–101) but only 32% sensitive with NDBE (102). Even though p53 LOH does not directly correlate with p53 expression, p53 IHC performs reasonably well as mutations in one of the alleles of p53 gene prevent degradation of the p53 protein allowing it to be more readily detected in neoplastic cells. This highlights an important point; biomarker evaluation may supplement dysplasia grade to predict future cancer development. TP53 mutational analysis has also been shown to hold promise in small studies, but may be more technically demanding (103). Based on these strong data, p53 LOH and p53 immunostaining are strong candidate biomarkers for a future biomarker panel to be tested in large scale, multi-center trials. Another important tumor suppressor gene APC, a regulator of the WNT pathway, appears to be altered in BE by methylation (104) and LOH (105) but the predictive ability remains unclear. The other important tumor suppressor gene p16 has been discussed under the epigenetics section. In summary, p53 allelic loss appears to be a well studied and accurate marker of progression in BE, but accurate evaluation of p53 LOH requires genotyping that is currently limited to the research setting.
Epigenetic changes
Epigenetics refers to post-transcriptional silencing of specific genes by a variety of mechanisms such as methylation or acetylation. Methylation induced inactivation of the p16 tumor-suppressor gene is one of the most common genetic abnormalities in Barrett’s metaplasia and regulates cell cycle progression. In patients with BE, p16 methylation is highly prevalent (34–66%) (92,106–108), but its predictive power for progression (OR 1.74, P = 0.05) (56,108) is lower than aneuploidy (86) and p53 LOH (OR 16, P < 0.001) (89). Based on the increasing prevalence of p53 LOH, aneuploidy and tetraploidy with progression from p16 +/+ to p16 −/−, it is felt that p16 lesions undergo clonal expansion creating a field permissive for superimposition of other genetic abnormalities eventually leading to EAC (109). Other genes such as APC (104), RUNX3 (108), and TIMP1 have been shown be hypermethylated in BE, but convincing data about their predictive ability are lacking. In summary, p16 methylation is a promising marker for the risk of progression in BE.
Cell cycle predictors
Cell cycle regulator proteins such as cyclins are potentially useful biomarkers for progression especially because of intimate modulation by p16, a common clonal abnormality in BE. Cyclin D1 is an antagonist of p16 and together they regulate cell cycle progression. Bani-Hani et al. in a phase 3 study (110) showed that BE patients positive for cyclin D1 were 6–7 times more likely to develop EAC. In contrast, Murray et al. did not find a significant difference in cyclin D1 staining between BE cases that progressed to EAC when compared with non-progressors, (102) but it may have been due to an older cohort of BE patients with a short duration of follow up. An interesting study by Fitzgerald et al. studied cyclin D1 expression as a function of proliferation suggested that cyclin D1 has a variable expression that may affect its clinical usefulness (111). Owing to significant limitations, cyclins cannot be recommended to monitor for progression at the present time and need to be further tested.
Proliferation abnormalities
Controversy continues whether proliferation is accompanied by dysplasia, with some studies showing increasing proliferation with worsening grades of dysplasia (111–113) and others showing no difference (114,115). These discrepancies may be related to differences in techniques used and focusing on the entire thickness of BE mucosa rather than the luminal surface. Focusing on the luminal compartment, a phase-3 study showed that BE biopsies in patients who progressed to EAC had Mcm2 expression (marker for proliferation) in 28.4% of the luminal cells as compared with 3.4% in non-progressors (116). A recent phase 4 study calculated the S and G 2 cell cycle fractions as markers for proliferation and at a mean follow up of 6.3 years found the hazard ratio for EAC per 1% increase to be 1.16 and 1.35, respectively (117). However, using similar techniques, cell cycle fractions were not found to be significant predictors of dysplasia (111). Future larger studies with standardized techniques and definitions to measure proliferation are needed.
Other promising biomarkers
Several other biomarkers of promise have been studied in cross sectional, phase 2 studies but phase 3 & 4 data are lacking. These include, but are not limited to, HEr2/Neu (118), c MYC (119,120), COX-2 (121) and EGFR (122,123). Further studies are needed before definitive conclusions can be made.
Fluorescence in-situ hybridization
Fluorescence in-situ hybridization (FISH) is a technique which allows the detection of DNA content and loci abnormalities in cells with the use of fluorescent-tagged DNA probes. The technique has been studied in other organs/sites such as the bladder, lung, and bile ducts (124–127). The use of FISH has been reported in patients with BE to detect genetic abnormalities by investigators from multiple centers (118,123,128–132). FISH can detect various types of cytogenetic alterations including aneusomy (abnormalities of chromosome copy number), duplication, amplification, deletion, and translocation at tumor suppressor loci (such as 9p21 and 17p13.1) as well as at protooncogene loci (such as 8q24.2 and 17q11.2). In initial studies, FISH was performed on cytology specimens (acquired by brushing the BE segment with a conventional cytology brush). Cytology specimens may provide an advantage given the absence of sectioning artifacts (present on paraffi n sections) (129) and being more representative of the entire BE segment as opposed to biopsies which are typically taken in 1–2 cm segments: this being especially relevant given the spotty distribution of dysplasia in BE segments (133).
A multicolored FISH four probe set has been developed for the detection of dysplasia in BE (134) with the ability to identify HGD and EAC with reasonable sensitivity (84–93%) and specificity (93%). This probe set was found to be more sensitive and specific than routine cytology and digital image analysis: a method to assess the DNA content of cells, for the detection of HGD/EAC in BE (135). This study also provided initial data on the ability of FISH results to risk stratify BE subjects. Presence of polysomy (defined as gains of two or more proto-oncogene loci in the probe set) was predictive of subsequent development of HGD/EAC. A large proportion of patients in this study had a previous history of HGD and hence validation in a lower risk group will make these results more generalizable. A recent multicenter study reported in abstract form appears to substantiate the utility of polysomy detected by FISH (performed on paraffi n-embedded tissue) in predicting risk of progression to HGD/EAC (136).
In summary, genetic abnormalities detected by FISH appear to be promising as markers for progression in subjects with BE and await validation in larger prospective studies.
Barriers to biomarker-based clinical trials in BE
Clinical trials to test the utility of biomarkers need cooperation between clinical researchers with access to specimens and biologists wiThexpertise in molecular techniques. A critical bottleneck is the need for large scale clinical and tissue databases with sufficient outcomes of dysplasia/cancer to permit meaningful statistical analysis. Construction of such clinical and tissue repositories will require multicenter cooperation and support from organizations such as NIH/NCI and the VA. Biomarker discovery has to undergo validation through several different phases before clinical application (Table 3). The last few phases—phase 4 (prospective trials) and phase 5 (randomized controlled intervention trials) and perhaps phase 6 (phase 4 & 5 studies done at multiple centers) present significant challenges of samples sizes, long follow up and prohibitive costs (137). At present, none of the biomarkers discussed in this review have undergone this phasic rigorous validation (91). To demonstrate efficacy of a particular biomarker, prolonged follow up of 5–10 years will be required leading to logistical problems. Another issue relates to the method of specimen collection. Microarray studies require high quality RNA that is best extracted from fresh frozen tissues using liquid nitrogen requires special storage equipment and may not be readily accessible to the clinical scientist. An alternative method is collecting specimens in RNAlater (Applied Biosystems) that preserves RNA at room temperature for at least 1 week before storage in dedicated – 20 or – 80 degree freezers. Successful creation of tissue repositories of BE patients using RNAlater followed by RNA extraction of highest quality can be performed (RNA integrity numbers varying from 8–9.6 (1 complete degradation, 10 no degradation)). Lately, there has been a great deal of interest in molecular profiling using formalin-fixed paraffi n-embedded (FFPE) specimens because of their easy availability. The feasibility of large scale (> 6,000) gene profiling was shown in a study of patients with hepatocellular carcinoma where > 90% of the specimens provided high quality data even from specimens archived for as long as 24 years (138). Performing molecular studies on previously collected FFPE samples could thus obviate the need for freshly collected tissue. A technique that provides robust biomarker data, but is not practical will have diminished clinical utility. For instance, aneuploidy has been measured by flow cytometry, a tool that requires special collection media and sophisticated sorting methods. However, it is now feasible to measure aneuploidy by laser scanning cytometry on FFPE sections (139). Clinical applicability of biomarkers in BE resides on the premise that identified molecular abnormalities represent one dominant clone (monoclonality) and its ability to progress.
However, Leedham et al. in a painstaking, high-resolution mapping study of individual crypts in BE showed marked clonal heterogeneity with multiple independent clones (polyclonality). Stated simply, this means that molecular patterns analyzed on the whole biopsy may mask important biomarker abnormalities in individual crypts and may not accurately reflect the potential for progression of that patient as even small clones (that may not contribute to the overall molecular profile of that biopsy) could develop into cancers (140). This polyclonality within BE undoubtedly adds to the problem of validation of biomarkers for clinical use. Last but not the least, there is need for getting the clinical researcher and endoscopist interested in molecular biology as they have the first encounter with the patient with access to specimens. This will not only promote effective translational research but also train the next generation of practicing gastroenterologists to clinically apply molecular biology data to provide high-quality, cost-effective individualized medicine potentially with improved patient outcomes.
SUMMARY AND FUTURE DIRECTIONS
As is evident from the above synopsis, significant work needs to be done before a comprehensive and clinically useful BE prediction model can be developed. If one were to view the “holy grail” as half full (rather than half empty), a few factors such as aneuploidy and p53 LOH have shown predictive ability with significantly increased odds for Barrett’s progression. Although the molecular markers appear to be most predictive (OR 7–16), there are associated problems with need for special media, interlaboratory variation in methodology, lack of standardization and paucity of prospective trials. To translate the use of these biomarkers into practice, some techniques with the potential for clinical application include FISH (for chromosomal abnormalities), laser scanning cytometry (for aneuploidy) and immunostaining (for p53 and proliferation markers). Future molecular studies will provide further leads that should undergo validation based on the Early Detection Research Network (EDRN) Guidelines. As an individual variable does not appear to have sufficient predictive power, efforts need to focus on the development of a Barrett’s risk score similar to Gail score for breast cancer and MELD score for chronic liver disease. An ideal BE progression score should incorporate both clinical and biomarker variables to be optimized in a training data set followed by validation in a second independent data set. Barriers to such a score include difficulty in assembling cohorts large enough to contain adequate numbers of events (progression to EAC and/or HGD), and the need for comprehensive multifaceted information at baseline and follow up collected in a standardized fashion. With the inclusion of clinical factors (age, gender, length of BE segment) and a biomarker panel (including for example aneuploidy/polysomy, p53 LOH, p16LOH), 1,500 subjects with BE without dysplasia would need to be followed for 5 years to prospectively determine the ability of this panel to predict progression in patients with BE (assuming a rate of progression to HGD or EAC of 1 per 100 patient years, which would provide 75–100 progressors in this cohort). Development of such a validated score would allow the categorization of patients into low-risk and high-risk subsets. Intensive surveillance could then be focused on those at highest risk of progression decreasing the costs and potential complications of surveillance, which currently is recommended for all patients with BE. Decreasing the pool of subjects who undergo intensive surveillance has the potential to make surveillance more cost-effective. It appears that a multicenter collaborative effort would be the most practical way to achieve this goal. Though daunting, this task should be begun in earnest to begin addressing this crucial question in the management of patients with BE.
ACKNOWLEDGMENTS
We appreciate Dr Richard Sampliner’s assistance with comments on the article.
Financial support: The Miles and Shirley Fiterman Center for Digestive Diseases, Mayo Clinic, the National Institutes of Health (NCI grant RO3CA 135991-01 to GAP) and the Junior Faculty Development Award from the American College of Gastroenterology (to GAP, AB) and the VISN 15 Research Grant from the Veterans Affairs Medical Center, Kansas City (to AB).
Footnotes
CONFLICT OF INTEREST
Guarantor of the article: Ganapathy A. Prasad, MD.
Potential competing interests: None.
Specific author contributions: Initial concept and planning of the article, literature review, initial draft and review: G.A. Prasad; planning of the article, literature review, initial draft and review: A. Bansal; review of the article: P. Sharma and K.K. Wang.
REFERENCES
- 1.Pohl H, Welch HG. The role of overdiagnosis and reclassification in the marked increase of esophageal adenocarcinoma incidence. J Natl Cancer Inst. 2005;97:142–6. doi: 10.1093/jnci/dji024. [DOI] [PubMed] [Google Scholar]
- 2.Vakil N, van Zanten SV, Kahrilas P, et al. The Montreal definition and classification of gastroesophageal reflux disease:a global evidence-based consensus. Am J Gastroenterol. 2006;101:1900–20. doi: 10.1111/j.1572-0241.2006.00630.x. quiz 1943. [DOI] [PubMed] [Google Scholar]
- 3.Overholt BF, Lightdale CJ, Wang KK, et al. Photodynamic therapy with porfimer sodium for ablation of high-grade dysplasia in Barrett’s esophagus:international, partially blinded, randomized phase III trial. Gastrointest Endosc. 2005;62:488–98. doi: 10.1016/j.gie.2005.06.047. [DOI] [PubMed] [Google Scholar]
- 4.Corley DA, Levin TR, Habel LA, et al. Surveillance and survival in Barrett’s adenocarcinomas:a population-based study. Gastroenterology. 2002;122:633–40. doi: 10.1053/gast.2002.31879. [DOI] [PubMed] [Google Scholar]
- 5.Ferguson MK, Durkin A. Long-term survival after esophagectomy for Barrett’s adenocarcinoma in endoscopically surveyed and nonsurveyed patients. J Gastrointest Surg. 2002;6:29–35. doi: 10.1016/s1091-255x(01)00052-x. discussion 36. [DOI] [PubMed] [Google Scholar]
- 6.Wang KK, Sampliner RE. Updated guidelines 2008 for the diagnosis, surveillance and therapy of Barrett’s esophagus. Am J Gastroenterol. 2008;103:788–97. doi: 10.1111/j.1572-0241.2008.01835.x. [DOI] [PubMed] [Google Scholar]
- 7.Shaheen NJ, Crosby MA, Bozymski EM, et al. Is there publication bias in the reporting of cancer risk in Barrett’s esophagus? Gastroenterology. 2000;119:333–8. doi: 10.1053/gast.2000.9302. [DOI] [PubMed] [Google Scholar]
- 8.Ronkainen J, Aro P, Storskrubb T, et al. Prevalence of Barrett’s esophagus in the general population:an endoscopic study. Gastroenterology. 2005;129:1825–31. doi: 10.1053/j.gastro.2005.08.053. [DOI] [PubMed] [Google Scholar]
- 9.Barritt ASt, Shaheen NJ. Should patients with Barrett’s oesophagus be kept under surveillance? The case against. Best Pract Res Clin Gastroenterol. 2008;22:741–50. doi: 10.1016/j.bpg.2007.12.005. [DOI] [PubMed] [Google Scholar]
- 10.Spechler SJ. Dysplasia in Barrett’s esophagus:limitations of current management strategies. Am J Gastroenterol. 2005;100:927–35. doi: 10.1111/j.1572-0241.2005.41201.x. [DOI] [PubMed] [Google Scholar]
- 11.Inadomi JM, Sampliner R, Lagergren J, et al. Screening and surveillance for Barrett esophagus in high-risk groups:a cost-utility analysis. Ann Intern Med. 2003;138:176–86. doi: 10.7326/0003-4819-138-3-200302040-00009. [DOI] [PubMed] [Google Scholar]
- 12.Ovaska J, Miettinen M, Kivilaakso E. Adenocarcinoma arising in Barrett’s esophagus. Dig Dis Sci. 1989;34:1336–9. doi: 10.1007/BF01538065. [DOI] [PubMed] [Google Scholar]
- 13.Attwood SE, Barlow AP, Norris TL, et al. Barrett’s oesophagus:effect of antireflux surgery on symptom control and development of complications. Br J Surg. 1992;79:1050–3. doi: 10.1002/bjs.1800791021. [DOI] [PubMed] [Google Scholar]
- 14.Komorowski RA, Hogan WJ, Chausow DD. Barrett’s ulcer:the clinical significance today. Am J Gastroenterol. 1996;91:2310–3. [PubMed] [Google Scholar]
- 15.Wani S, Puli SR, Shaheen NJ, et al. Esophageal adenocarcinoma in Barrett’s esophagus after endoscopic ablative therapy:a meta-analysis and systematic review. Am J Gastroenterol. 2009;104:502–13. doi: 10.1038/ajg.2008.31. [DOI] [PubMed] [Google Scholar]
- 16.Yousef F, Cardwell C, Cantwell MM, et al. The incidence of esophageal cancer and high-grade dysplasia in Barrett’s esophagus:a systematic review and meta-analysis. Am J Epidemiol. 2008;168:237–49. doi: 10.1093/aje/kwn121. [DOI] [PubMed] [Google Scholar]
- 17.Shaheen NJ. Should we worry about the length of Barrett’s esophagus? Gastrointest Endosc. 2005;62:682–5. doi: 10.1016/j.gie.2005.06.024. [DOI] [PubMed] [Google Scholar]
- 18.Connor MJ, Weston AP, Mayo MS, et al. The prevalence of Barrett’s esophagus and erosive esophagitis in patients undergoing upper endoscopy for dyspepsia in a VA population. Dig Dis Sci. 2004;49:920–4. doi: 10.1023/b:ddas.0000034549.55326.67. [DOI] [PubMed] [Google Scholar]
- 19.Oberg S, Wenner J, Johansson J, et al. Barrett esophagus:risk factors for progression to dysplasia and adenocarcinoma. Ann Surg. 2005;242:49–54. doi: 10.1097/01.sla.0000167864.46462.9f. [DOI] [PMC free article] [PubMed] [Google Scholar]
- 20.Sharma P, Falk GW, Weston AP, et al. Dysplasia and cancer in a large multicenter cohort of patients with Barrett’s esophagus. Clin Gastroenterol Hepatol. 2006;4:566–72. doi: 10.1016/j.cgh.2006.03.001. [DOI] [PubMed] [Google Scholar]
- 21.Anandasabapathy S, Jhamb J, Davila M, et al. Clinical and endoscopic factors predict higher pathologic grades of Barrett dysplasia. Cancer. 2007;109:668–74. doi: 10.1002/cncr.22451. [DOI] [PubMed] [Google Scholar]
- 22.O’Connor JB, Falk GW, Richter JE. The incidence of adenocarcinoma and dysplasia in Barrett’s esophagus:report on the Cleveland Clinic Barrett’s Esophagus Registry. Am J Gastroenterol. 1999;94:2037–42. doi: 10.1111/j.1572-0241.1999.01275.x. [DOI] [PubMed] [Google Scholar]
- 23.Guardino JM, Khandwala F, Lopez R, et al. Barrett’s esophagus at a tertiary care center:association of age on incidence and prevalence of dysplasia and adenocarcinoma. Am J Gastroenterol. 2006;101:2187–93. doi: 10.1111/j.1572-0241.2006.00736.x. [DOI] [PubMed] [Google Scholar]
- 24.Sampliner R, Wang K, Shaheen N, et al. InterSPORE/EDRN Barrett’s Esophagus (BE) study:Interim Report of a Multicenter Case-Control Study of Progressors to High Grade Dysplasia/Adenocarcinoma vs. Nonprogressors. Gastroenterology. 2008:134. [Google Scholar]
- 25.Bani-Hani KE, Bani-Hani BK, Martin IG. Characteristics of patients with columnar-lined Barrett’s esophagus and risk factors for progression to esophageal adenocarcinoma. World J Gastroenterol. 2005;11:6807–14. doi: 10.3748/wjg.v11.i43.6807. [DOI] [PMC free article] [PubMed] [Google Scholar]
- 26.de Jonge PJ, Steyerberg EW, Kuipers EJ, et al. Risk factors for the development of esophageal adenocarcinoma in Barrett’s esophagus. Am J Gastroenterol. 2006;101:1421–9. doi: 10.1111/j.1572-0241.2006.00626.x. [DOI] [PubMed] [Google Scholar]
- 27.Menke-Pluymers MB, Hop WC, Dees J, et al. Risk factors for the development of an adenocarcinoma in columnar-lined (Barrett) esophagus. The Rotterdam Esophageal Tumor Study Group. Cancer. 1993;72:1155–8. doi: 10.1002/1097-0142(19930815)72:4<1155::aid-cncr2820720404>3.0.co;2-c. [DOI] [PubMed] [Google Scholar]
- 28.Ogden CL, Yanovski SZ, Carroll MD, et al. The epidemiology of obesity. Gastroenterology. 2007;132:2087–102. doi: 10.1053/j.gastro.2007.03.052. [DOI] [PubMed] [Google Scholar]
- 29.Edelstein ZR, Farrow DC, Bronner MP, et al. Central adiposity and risk of Barrett’s esophagus. Gastroenterology. 2007;133:403–11. doi: 10.1053/j.gastro.2007.05.026. [DOI] [PubMed] [Google Scholar]
- 30.Hampel H, Abraham NS, El-Serag HB. Meta-analysis:obesity and the risk for gastroesophageal reflux disease and its complications. Ann Intern Med. 2005;143:199–211. doi: 10.7326/0003-4819-143-3-200508020-00006. [DOI] [PubMed] [Google Scholar]
- 31.Kubo A, Corley DA. Body mass index and adenocarcinomas of the esophagus or gastric cardia:a systematic review and meta-analysis. Cancer Epidemiol Biomarkers Prev. 2006;15:872–8. doi: 10.1158/1055-9965.EPI-05-0860. [DOI] [PubMed] [Google Scholar]
- 32.Vaughan TL, Kristal AR, Blount PL, et al. Nonsteroidal anti-inflammatory drug use, body mass index, and anthropometry in relation to genetic and flow cytometric abnormalities in Barrett’s esophagus. Cancer Epidemiol Biomarkers Prev. 2002;11:745–52. [PubMed] [Google Scholar]
- 33.Moe GL, Kristal AR, Levine DS, et al. Waist-to-hip ratio, weight gain, and dietary and serum selenium are associated with DNA content flow cytometry in Barrett’s esophagus. Nutr Cancer. 2000;36:7–13. doi: 10.1207/S15327914NC3601_2. [DOI] [PubMed] [Google Scholar]
- 34.Gray MR, Donnelly RJ, Kingsnorth AN. The role of smoking and alcohol in metaplasia and cancer risk in Barrett’s columnar lined oesophagus. Gut. 1993;34:727–31. doi: 10.1136/gut.34.6.727. [DOI] [PMC free article] [PubMed] [Google Scholar]
- 35.Avidan B, Sonnenberg A, Schnell TG, et al. Hiatal hernia size, Barrett’s length, and severity of acid reflux are all risk factors for esophageal adenocarcinoma. Am J Gastroenterol. 2002;97:1930–6. doi: 10.1111/j.1572-0241.2002.05902.x. [DOI] [PubMed] [Google Scholar]
- 36.Mayne ST, Risch HA, Dubrow R, et al. Nutrient intake and risk of subtypes of esophageal and gastric cancer. Cancer Epidemiol Biomarkers Prev. 2001;10:1055–62. [PubMed] [Google Scholar]
- 37.Mehta S, Johnson IT, Rhodes M. Systematic review:the chemoprevention of oesophageal adenocarcinoma. Aliment Pharmacol Ther. 2005;22:759–68. doi: 10.1111/j.1365-2036.2005.02667.x. [DOI] [PubMed] [Google Scholar]
- 38.Dong LM, Kristal AR, Peters U, et al. Dietary supplement use and risk of neoplastic progression in esophageal adenocarcinoma:a prospective study. Nutr Cancer. 2008;60:39–48. doi: 10.1080/01635580701586762. [DOI] [PMC free article] [PubMed] [Google Scholar]
- 39.Rudolph RE, Vaughan TL, Storer BE, et al. Effect of segment length on risk for neoplastic progression in patients with Barrett esophagus. Ann Intern Med. 2000;132:612–20. doi: 10.7326/0003-4819-132-8-200004180-00003. [DOI] [PubMed] [Google Scholar]
- 40.Lagergren J, Bergstrom R, Lindgren A, et al. Symptomatic gastroesophageal reflux as a risk factor for esophageal adenocarcinoma. N Engl J Med. 1999;340:825–31. doi: 10.1056/NEJM199903183401101. [DOI] [PubMed] [Google Scholar]
- 41.Umansky M, Yasui W, Hallak A, et al. Proton pump inhibitors reduce cell cycle abnormalities in Barrett’s esophagus. Oncogene. 2001;20:7987–91. doi: 10.1038/sj.onc.1204947. [DOI] [PubMed] [Google Scholar]
- 42.Fitzgerald RC, Omary MB, Triadafilopoulos G. Dynamic effects of acid on Barrett’s esophagus. An ex vivo proliferation and differentiation model. J Clin Invest. 1996;98:2120–8. doi: 10.1172/JCI119018. [DOI] [PMC free article] [PubMed] [Google Scholar]
- 43.Haigh CR, Attwood SE, Thompson DG, et al. Gastrin induces proliferation in Barrett’s metaplasia through activation of the CCK2 receptor. Gastroenterology. 2003;124:615–25. doi: 10.1053/gast.2003.50091. [DOI] [PubMed] [Google Scholar]
- 44.El-Serag HB, Aguirre TV, Davis S, et al. Proton pump inhibitors are associated with reduced incidence of dysplasia in Barrett’s esophagus. Am J Gastroenterol. 2004;99:1877–83. doi: 10.1111/j.1572-0241.2004.30228.x. [DOI] [PubMed] [Google Scholar]
- 45.Sharma P. Low-grade dysplasia in Barrett’s esophagus. Gastroenterology. 2004;127:1233–8. doi: 10.1053/j.gastro.2004.07.061. [DOI] [PubMed] [Google Scholar]
- 46.Hillman LC, Chiragakis L, Shadbolt B, et al. Proton-pump inhibitor therapy and the development of dysplasia in patients with Barrett’s oesophagus. Med J Aust. 2004;180:387–91. doi: 10.5694/j.1326-5377.2004.tb05991.x. [DOI] [PubMed] [Google Scholar]
- 47.Ye W, Chow WH, Lagergren J, et al. Risk of adenocarcinomas of the esophagus and gastric cardia in patients with gastroesophageal reflux diseases and after antireflux surgery. Gastroenterology. 2001;121:1286–93. doi: 10.1053/gast.2001.29569. [DOI] [PubMed] [Google Scholar]
- 48.Parrilla P, Martinez de Haro LF, Ortiz A, et al. Long-term results of a randomized prospective study comparing medical and surgical treatment of Barrett’s esophagus. Ann Surg. 2003;237:291–8. doi: 10.1097/01.SLA.0000055269.77838.8E. [DOI] [PMC free article] [PubMed] [Google Scholar]
- 49.Corey KE, Schmitz SM, Shaheen NJ. Does a surgical antireflux procedure decrease the incidence of esophageal adenocarcinoma in Barrett’s esophagus? A meta-analysis. Am J Gastroenterol. 2003;98:2390–4. doi: 10.1111/j.1572-0241.2003.08702.x. [DOI] [PubMed] [Google Scholar]
- 50.Chang EY, Morris CD, Seltman AK, et al. The effect of antireflux surgery on esophageal carcinogenesis in patients with barrett esophagus:a systematic review. Ann Surg. 2007;246:11–21. doi: 10.1097/01.sla.0000261459.10565.e9. [DOI] [PMC free article] [PubMed] [Google Scholar]
- 51.Lundell L, Attwood S, Ell C, et al. Comparing laparoscopic antireflux surgery with esomeprazole in the management of patients with chronic gastro-oesophageal reflux disease:a 3-year interim analysis of the LOTUS trial. Gut. 2008;57:1207–13. doi: 10.1136/gut.2008.148833. [DOI] [PMC free article] [PubMed] [Google Scholar]
- 52.Carlson N, Lechago J, Richter J, et al. Acid suppression therapy may not alter malignant progression in Barrett’s metaplasia showing p53 protein accumulation. Am J Gastroenterol. 2002;97:1340–5. doi: 10.1111/j.1572-0241.2002.05770.x. [DOI] [PubMed] [Google Scholar]
- 53.Jankowski J, Barr H. Improving surveillance for Barrett’s oesophagus:AspECT and BOSS trials provide an evidence base. BMJ. 2006;332:1512. doi: 10.1136/bmj.332.7556.1512. [DOI] [PMC free article] [PubMed] [Google Scholar]
- 54.Corley DA, Kerlikowske K, Verma R, et al. Protective association of aspirin/ NSAIDs and esophageal cancer:a systematic review and meta-analysis. Gastroenterology. 2003;124:47–56. doi: 10.1053/gast.2003.50008. [DOI] [PubMed] [Google Scholar]
- 55.Vaughan TL, Dong LM, Blount PL, et al. Non-steroidal anti-inflammatory drugs and risk of neoplastic progression in Barrett’s oesophagus:a prospective study. Lancet Oncol. 2005;6:945–52. doi: 10.1016/S1470-2045(05)70431-9. [DOI] [PubMed] [Google Scholar]
- 56.Galipeau PC, Li X, Blount PL, et al. NSAIDs modulate CDKN2A, TP53, and DNA content risk for progression to esophageal adenocarcinoma. PLoS Med. 2007;4:e67. doi: 10.1371/journal.pmed.0040067. [DOI] [PMC free article] [PubMed] [Google Scholar]
- 57.Weston AP, Badr AS, Hassanein RS. Prospective multivariate analysis of factors predictive of complete regression of Barrett’s esophagus. Am J Gastroenterol. 1999;94:3420–6. doi: 10.1111/j.1572-0241.1999.01603.x. [DOI] [PubMed] [Google Scholar]
- 58.Weston AP, Sharma P, Mathur S, et al. Risk stratification of Barrett’s esophagus:updated prospective multivariate analysis. Am J Gastroenterol. 2004;99:1657–66. doi: 10.1111/j.1572-0241.2004.30426.x. [DOI] [PubMed] [Google Scholar]
- 59.Thomas T, Abrams KR, De Caestecker JS, et al. Meta analysis:cancer risk in Barrett’s oesophagus. Aliment Pharmacol Ther. 2007;26:1465–77. doi: 10.1111/j.1365-2036.2007.03528.x. [DOI] [PubMed] [Google Scholar]
- 60.Buttar NS, Wang KK, Sebo TJ, et al. Extent of high-grade dysplasia in Barrett’s esophagus correlates with risk of adenocarcinoma. Gastroenterology. 2001;120:1630–9. doi: 10.1053/gast.2001.25111. [DOI] [PubMed] [Google Scholar]
- 61.Montgomery E, Bronner MP, Greenson JK, et al. Are ulcers a marker for invasive carcinoma in Barrett’s esophagus? Data from a diagnostic variability study with clinical follow-up. Am J Gastroenterol. 2002;97:27–31. doi: 10.1111/j.1572-0241.2002.05420.x. [DOI] [PubMed] [Google Scholar]
- 62.Peters FP, Brakenhoff KP, Curvers WL, et al. Histologic evaluation of resection specimens obtained at 293 endoscopic resections in Barrett’s esophagus. Gastrointest Endosc. 2008;67:604–9. doi: 10.1016/j.gie.2007.08.039. [DOI] [PubMed] [Google Scholar]
- 63.Hull MJ, Mino-Kenudson M, Nishioka NS, et al. Endoscopic mucosal resection:an improved diagnostic procedure for early gastroesophageal epithelial neoplasms. Am J Surg Pathol. 2006;30:114–8. doi: 10.1097/01.pas.0000180438.56528.a0. [DOI] [PubMed] [Google Scholar]
- 64.Kariv R, Plesec TP, Goldblum JR, et al. The Seattle protocol does not more reliably predict the detection of cancer at the time of esophagectomy than a less intensive surveillance protocol. Clin Gastroenterol Hepatol. 2009;7:653–8. doi: 10.1016/j.cgh.2008.11.024. quiz 606. [DOI] [PubMed] [Google Scholar]
- 65.Tharavej C, Hagen JA, Peters JH, et al. Predictive factors of coexisting cancer in Barrett’s high-grade dysplasia. Surg Endosc. 2006;20:439–43. doi: 10.1007/s00464-005-0255-x. [DOI] [PubMed] [Google Scholar]
- 66.Wolfsen HC, Crook JE, Krishna M, et al. Prospective, controlled tandem endoscopy study of narrow band imaging for dysplasia detection in Barrett’s esophagus. Gastroenterology. 2008;135:24–31. doi: 10.1053/j.gastro.2008.03.019. [DOI] [PubMed] [Google Scholar]
- 67.Riddell RH, Goldman H, Ransohoff DF, et al. Dysplasia in inflammatory bowel disease:standardized classification with provisional clinical applications. Hum Pathol. 1983;14:931–68. doi: 10.1016/s0046-8177(83)80175-0. [DOI] [PubMed] [Google Scholar]
- 68.Reid BJ, Haggitt RC, Rubin CE, et al. Observer variation in the diagnosis of dysplasia in Barrett’s esophagus. Hum Pathol. 1988;19:166–78. doi: 10.1016/s0046-8177(88)80344-7. [DOI] [PubMed] [Google Scholar]
- 69.Montgomery E, Goldblum JR, Greenson JK, et al. Dysplasia as a predictive marker for invasive carcinoma in Barrett esophagus:a follow-up study based on 138 cases from a diagnostic variability study. Hum Pathol. 2001;32:379–88. doi: 10.1053/hupa.2001.23511. [DOI] [PubMed] [Google Scholar]
- 70.Weston AP, Krmpotich PT, Cherian R, et al. Prospective long-term endoscopic and histological follow-up of short segment Barrett’s esophagus:comparison with traditional long segment Barrett’s esophagus. Am J Gastroenterol. 1997;92:407–13. [PubMed] [Google Scholar]
- 71.Dulai GS, Shekelle PG, Jensen DM, et al. Dysplasia and risk of further neoplastic progression in a regional Veterans Administration Barrett’s cohort. Am J Gastroenterol. 2005;100:775–83. doi: 10.1111/j.1572-0241.2005.41300.x. [DOI] [PubMed] [Google Scholar]
- 72.Wani S, Choi W, Sharma P. Low-grade dysplasia in Barrett’s esophagus—an innocent bystander? Pro Endoscopy. 2007;39:643–6. doi: 10.1055/s-2007-966650. [DOI] [PubMed] [Google Scholar]
- 73.Wani S, Mathur S, Sharma P. How to manage a Barrett’s esophagus patient with low-grade dysplasia. Clin Gastroenterol Hepatol. 2009;7:27–32. doi: 10.1016/j.cgh.2008.08.014. [DOI] [PubMed] [Google Scholar]
- 74.Lim CH, Treanor D, Dixon MF, et al. Low-grade dysplasia in Barrett’s esophagus has a high risk of progression. Endoscopy. 2007;39:581–7. doi: 10.1055/s-2007-966592. [DOI] [PubMed] [Google Scholar]
- 75.Skacel M, Petras RE, Gramlich TL, et al. The diagnosis of low-grade dysplasia in Barrett’s esophagus and its implications for disease progression. Am J Gastroenterol. 2000;95:3383–7. doi: 10.1111/j.1572-0241.2000.03348.x. [DOI] [PubMed] [Google Scholar]
- 76.Rastogi A, Puli S, El-Serag HB, et al. Incidence of esophageal adenocarcinoma in patients with Barrett’s esophagus and high-grade dysplasia:a meta-analysis. Gastrointest Endosc. 2008;67:394–8. doi: 10.1016/j.gie.2007.07.019. [DOI] [PubMed] [Google Scholar]
- 77.Schnell TG, Sontag SJ, Chejfec G, et al. Long-term nonsurgical management of Barrett’s esophagus with high-grade dysplasia. Gastroenterology. 2001;120:1607–19. doi: 10.1053/gast.2001.25065. [DOI] [PubMed] [Google Scholar]
- 78.Reid BJ, Levine DS, Longton G, et al. Predictors of progression to cancer in Barrett’s esophagus:baseline histology and flow cytometry identify low- and high-risk patient subsets. Am J Gastroenterol. 2000;95:1669–76. doi: 10.1111/j.1572-0241.2000.02196.x. [DOI] [PMC free article] [PubMed] [Google Scholar]
- 79.Downs-Kelly E, Mendelin JE, Bennett AE, et al. Poor interobserver agreement in the distinction of high-grade dysplasia and adenocarcinoma in pretreatment Barrett’s esophagus biopsies. Am J Gastroenterol. 2008;103:2333–40. doi: 10.1111/j.1572-0241.2008.02020.x. quiz 2341. [DOI] [PubMed] [Google Scholar]
- 80.Montgomery E, Bronner MP, Goldblum JR, et al. Reproducibility of the diagnosis of dysplasia in Barrett esophagus:a reaffirmation. Hum Pathol. 2001;32:368–78. doi: 10.1053/hupa.2001.23510. [DOI] [PubMed] [Google Scholar]
- 81.Ormsby AH, Petras RE, Henricks WH, et al. Observer variation in the diagnosis of superficial oesophageal adenocarcinoma. Gut. 2002;51:671–6. doi: 10.1136/gut.51.5.671. [DOI] [PMC free article] [PubMed] [Google Scholar]
- 82.Alikhan M, Rex D, Khan A, et al. Variable pathologic interpretation of columnar lined esophagus by general pathologists in community practice. Gastrointest Endosc. 1999;50:23–6. doi: 10.1016/s0016-5107(99)70339-1. [DOI] [PubMed] [Google Scholar]
- 83.Dar MS, Goldblum JR, Rice TW, et al. Can extent of high grade dysplasia in Barrett’s oesophagus predict the presence of adenocarcinoma at oesophagectomy? Gut. 2003;52:486–9. doi: 10.1136/gut.52.4.486. [DOI] [PMC free article] [PubMed] [Google Scholar]
- 84.Srivastava A, Hornick JL, Li X, et al. Extent of low-grade dysplasia is a risk factor for the development of esophageal adenocarcinoma in Barrett’s esophagus. Am J Gastroenterol. 2007;102:483–93. doi: 10.1111/j.1572-0241.2007.01073.x. quiz 694. [DOI] [PubMed] [Google Scholar]
- 85.Falk GW, Goldblum JR. Extent of low-grade dysplasia in Barrett’s esophagus:is it useful for risk stratification? Am J Gastroenterol. 2007;102:494–6. doi: 10.1111/j.1572-0241.2007.01067.x. [DOI] [PubMed] [Google Scholar]
- 86.Rabinovitch PS, Longton G, Blount PL, et al. Predictors of progression in Barrett’s esophagus III:baseline flow cytometric variables. Am J Gastroenterol. 2001;96:3071–83. doi: 10.1111/j.1572-0241.2001.05261.x. [DOI] [PMC free article] [PubMed] [Google Scholar]
- 87.Wilson JF. The rocky road to useful cancer biomarkers. Ann Intern Med. 2006;144:945–8. doi: 10.7326/0003-4819-144-12-200606200-00022. [DOI] [PubMed] [Google Scholar]
- 88.Michiels S, Koscielny S, Hill C. Prediction of cancer outcome with microarrays:a multiple random validation strategy. Lancet. 2005;365:488–92. doi: 10.1016/S0140-6736(05)17866-0. [DOI] [PubMed] [Google Scholar]
- 89.Reid BJ, Prevo LJ, Galipeau PC, et al. Predictors of progression in Barrett’s esophagus II:baseline 17p (p53) loss of heterozygosity identifies a patient subset at increased risk for neoplastic progression. Am J Gastroenterol. 2001;96:2839–48. doi: 10.1111/j.1572-0241.2001.04236.x. [DOI] [PMC free article] [PubMed] [Google Scholar]
- 90.Teodori L, Gohde W, Persiani M, et al. DNA/protein flow cytometry as a predictive marker of malignancy in dysplasia-free Barrett’s esophagus:thirteen-year follow-up study on a cohort of patients. Cytometry. 1998;34:257–63. doi: 10.1002/(sici)1097-0320(19981215)34:6<257::aid-cyto3>3.0.co;2-s. [DOI] [PubMed] [Google Scholar]
- 91.Pepe MS, Etzioni R, Feng Z, et al. Phases of biomarker development for early detection of cancer. J Natl Cancer Inst. 2001;93:1054–61. doi: 10.1093/jnci/93.14.1054. [DOI] [PubMed] [Google Scholar]
- 92.Maley CC, Galipeau PC, Li X, et al. The combination of genetic instability and clonal expansion predicts progression to esophageal adenocarcinoma. Cancer Res. 2004;64:7629–33. doi: 10.1158/0008-5472.CAN-04-1738. [DOI] [PubMed] [Google Scholar]
- 93.Huang Q, Yu C, Klein M, et al. DNA index determination with Automated Cellular Imaging System (ACIS) in Barrett’s esophagus:comparison with CAS 200. BMC Clin Pathol. 2005;5:7. doi: 10.1186/1472-6890-5-7. [DOI] [PMC free article] [PubMed] [Google Scholar]
- 94.Yu C, Zhang X, Huang Q, et al. High-fidelity DNA histograms in neoplastic progression in Barrett’s esophagus. Lab Invest. 2007;87:466–72. doi: 10.1038/labinvest.3700531. [DOI] [PubMed] [Google Scholar]
- 95.Bansal A, Slusser JG, Mathur SC, et al. Cytokeratin Assisted Laser Scanning Cytometry (LSC) permits fully automated detection of aneuploidy in fixed Barrett’s biopsies [abstract] Gastroenterology. 2009 [Google Scholar]
- 96.Paulson TG, Maley CC, Li X, et al. Chromosomal instability and copy number alterations in Barrett’s esophagus and esophageal adenocarcinoma. Clin Cancer Res. 2009;15:3305–14. doi: 10.1158/1078-0432.CCR-08-2494. [DOI] [PMC free article] [PubMed] [Google Scholar]
- 97.Christophorou MA, Ringshausen I, Finch AJ, et al. The pathological response to DNA damage does not contribute to p53-mediated tumour suppression. Nature. 2006;443:214–7. doi: 10.1038/nature05077. [DOI] [PubMed] [Google Scholar]
- 98.Efeyan A, Garcia-Cao I, Herranz D, et al. Tumour biology:policing of oncogene activity by p53. Nature. 2006;443:159. doi: 10.1038/443159a. [DOI] [PubMed] [Google Scholar]
- 99.Skacel M, Petras RE, Rybicki LA, et al. p53 expression in low grade dysplasia in Barrett’s esophagus:correlation with interobserver agreement and disease progression. Am J Gastroenterol. 2002;97:2508–13. doi: 10.1111/j.1572-0241.2002.06032.x. [DOI] [PubMed] [Google Scholar]
- 100.Weston AP, Banerjee SK, Sharma P, et al. p53 protein overexpression in low grade dysplasia (LGD) in Barrett’s esophagus:immunohistochemical marker predictive of progression. Am J Gastroenterol. 2001;96:1355–62. doi: 10.1111/j.1572-0241.2001.03851.x. [DOI] [PubMed] [Google Scholar]
- 101.Younes M, Ertan A, Lechago LV, et al. p53 Protein accumulation is a specific marker of malignant potential in Barrett’s metaplasia. Dig Dis Sci. 1997;42:697–701. doi: 10.1023/a:1018828207371. [DOI] [PubMed] [Google Scholar]
- 102.Murray L, Sedo A, Scott M, et al. TP53 and progression from Barrett’s metaplasia to oesophageal adenocarcinoma in a UK population cohort. Gut. 2006;55:1390–7. doi: 10.1136/gut.2005.083295. [DOI] [PMC free article] [PubMed] [Google Scholar]
- 103.Dolan K, Walker SJ, Gosney J, et al. TP53 mutations in malignant and premalignant Barrett’s esophagus. Dis Esophagus. 2003;16:83–9. doi: 10.1046/j.1442-2050.2003.00302.x. [DOI] [PubMed] [Google Scholar]
- 104.Clement G, Braunschweig R, Pasquier N, et al. Alterations of the Wnt signaling pathway during the neoplastic progression of Barrett’s esophagus. Oncogene. 2006;25:3084–92. doi: 10.1038/sj.onc.1209338. [DOI] [PubMed] [Google Scholar]
- 105.Zhuang Z, Vortmeyer AO, Mark EJ, et al. Barrett’s esophagus:metaplastic cells with loss of heterozygosity at the APC gene locus are clonal precursors to invasive adenocarcinoma. Cancer Res. 1996;56:1961–4. [PubMed] [Google Scholar]
- 106.Bian YS, Osterheld MC, Fontolliet C, et al. p16 inactivation by methylation of the CDKN2A promoter occurs early during neoplastic progression in Barrett’s esophagus. Gastroenterology. 2002;122:1113–21. doi: 10.1053/gast.2002.32370. [DOI] [PubMed] [Google Scholar]
- 107.Eads CA, Lord RV, Wickramasinghe K, et al. Epigenetic patterns in the progression of esophageal adenocarcinoma. Cancer Res. 2001;61:3410–8. [PubMed] [Google Scholar]
- 108.Schulmann K, Sterian A, Berki A, et al. Inactivation of p16, RUNX3, and HPP1 occurs early in Barrett’s-associated neoplastic progression and predicts progression risk. Oncogene. 2005;24:4138–48. doi: 10.1038/sj.onc.1208598. [DOI] [PubMed] [Google Scholar]
- 109.Maley CC, Galipeau PC, Li X, et al. Selectively advantageous mutations and hitchhikers in neoplasms:p16 lesions are selected in Barrett’s esophagus. Cancer Res. 2004;64:3414–27. doi: 10.1158/0008-5472.CAN-03-3249. [DOI] [PubMed] [Google Scholar]
- 110.Bani-Hani K, Martin IG, Hardie LJ, et al. Prospective study of cyclin D1 overexpression in Barrett’s esophagus:association with increased risk of adenocarcinoma. J Natl Cancer Inst. 2000;92:1316–21. doi: 10.1093/jnci/92.16.1316. [DOI] [PubMed] [Google Scholar]
- 111.Lao-Sirieix P, Brais R, Lovat L, et al. Cell cycle phase abnormalities do not account for disordered proliferation in Barrett’s carcinogenesis. Neoplasia. 2004;6:751–60. doi: 10.1593/neo.04280. [DOI] [PMC free article] [PubMed] [Google Scholar]
- 112.Going JJ, Keith WN, Neilson L, et al. Aberrant expression of minichromosome maintenance proteins 2 and 5, and Ki-67 in dysplastic squamous oesophageal epithelium and Barrett’s mucosa. Gut. 2002;50:373–7. doi: 10.1136/gut.50.3.373. [DOI] [PMC free article] [PubMed] [Google Scholar]
- 113.Hong MK, Laskin WB, Herman BE, et al. Expansion of the Ki-67 proliferative compartment correlates with degree of dysplasia in Barrett’s esophagus. Cancer. 1995;75:423–9. doi: 10.1002/1097-0142(19950115)75:2<423::aid-cncr2820750202>3.0.co;2-5. [DOI] [PubMed] [Google Scholar]
- 114.Pellish LJ, Hermos JA, Eastwood GL. Cell proliferation in three types of Barrett’s epithelium. Gut. 1980;21:26–31. doi: 10.1136/gut.21.1.26. [DOI] [PMC free article] [PubMed] [Google Scholar]
- 115.Reid BJ, Sanchez CA, Blount PL, et al. Barrett’s esophagus:cell cycle abnormalities in advancing stages of neoplastic progression. Gastroenterology. 1993;105:119–29. doi: 10.1016/0016-5085(93)90017-7. [DOI] [PubMed] [Google Scholar]
- 116.Sirieix PS, O’Donovan M, Brown J, et al. Surface expression of minichromosome maintenance proteins provides a novel method for detecting patients at risk for developing adenocarcinoma in Barrett’s esophagus. Clin Cancer Res. 2003;9:2560–6. [PubMed] [Google Scholar]
- 117.Chao DL, Sanchez CA, Galipeau PC, et al. Cell proliferation, cell cycle abnormalities, and cancer outcome in patients with Barrett’s esophagus:a long-term prospective study. Clin Cancer Res. 2008;14:6988–95. doi: 10.1158/1078-0432.CCR-07-5063. [DOI] [PMC free article] [PubMed] [Google Scholar]
- 118.Rossi E, Grisanti S, Villanacci V, et al. Her-2 overexpression/amplification in Barrett’s esophagus predicts early transition from dysplasia to adenocarcinoma:a clinico-pathologic study. J Cell Mol Med. 2008 doi: 10.1111/j.1582-4934.2008.00517.x. [DOI] [PMC free article] [PubMed] [Google Scholar]
- 119.Albrecht B, Hausmann M, Zitzelsberger H, et al. Array-based comparative genomic hybridization for the detection of DNA sequence copy number changes in Barrett’s adenocarcinoma. J Pathol. 2004;203:780–8. doi: 10.1002/path.1576. [DOI] [PubMed] [Google Scholar]
- 120.Wiech T, Nikolopoulos E, Weis R, et al. Genome-wide analysis of genetic alterations in Barrett’s adenocarcinoma using single nucleotide polymorphism arrays. Lab Invest. 2009;89:385–97. doi: 10.1038/labinvest.2008.67. [DOI] [PubMed] [Google Scholar]
- 121.Mobius C, Stein HJ, Spiess C, et al. COX2 expression, angiogenesis, proliferation and survival in Barrett’s cancer. Eur J Surg Oncol. 2005;31:755–9. doi: 10.1016/j.ejso.2005.01.006. [DOI] [PubMed] [Google Scholar]
- 122.Miller CT, Moy JR, Lin L, et al. Gene amplification in esophageal adenocarcinomas and Barrett’s with high-grade dysplasia. Clin Cancer Res. 2003;9:4819–25. [PubMed] [Google Scholar]
- 123.Rygiel AM, Milano F, Ten Kate FJ, et al. Gains and amplifications of c-myc, EGFR, and 20.q13 loci in the no dysplasia-dysplasia-adenocarcinoma sequence of Barrett’s esophagus. Cancer Epidemiol Biomarkers Prev. 2008;17:1380–5. doi: 10.1158/1055-9965.EPI-07-2734. [DOI] [PubMed] [Google Scholar]
- 124.Halling KC, Kipp BR. Fluorescence in situ hybridization in diagnostic cytology. Hum Pathol. 2007;38:1137–44. doi: 10.1016/j.humpath.2007.04.015. [DOI] [PubMed] [Google Scholar]
- 125.Halling KC, Kipp BR. Bladder cancer detection using FISH (UroVysion assay) Adv Anat Pathol. 2008;15:279–86. doi: 10.1097/PAP.0b013e3181832320. [DOI] [PubMed] [Google Scholar]
- 126.Kipp BR, Tanasescu M, Else TA, et al. Quantitative fluorescence in situ hybridization and its ability to predict bladder cancer recurrence and progression to muscle-invasive bladder cancer. J Mol Diagn. 2009;11:148–54. doi: 10.2353/jmoldx.2009.080096. [DOI] [PMC free article] [PubMed] [Google Scholar]
- 127.Levy MJ, Baron TH, Clayton AC, et al. Prospective evaluation of advanced molecular markers and imaging techniques in patients with indeterminate bile duct strictures. Am J Gastroenterol. 2008;103:1263–73. doi: 10.1111/j.1572-0241.2007.01776.x. [DOI] [PMC free article] [PubMed] [Google Scholar]
- 128.Falk GW, Skacel M, Gramlich TL, et al. Fluorescence in situ hybridization of cytologic specimens from Barrett’s esophagus:a pilot feasibility study. Gastrointest Endosc. 2004;60:280–4. doi: 10.1016/s0016-5107(04)01687-6. [DOI] [PubMed] [Google Scholar]
- 129.Prasad GA, Wang KK, Halling KC, et al. Utility of biomarkers in prediction of response to ablative therapy in Barrett’s esophagus. Gastroenterology. 2008;135:370–9. doi: 10.1053/j.gastro.2008.04.036. [DOI] [PMC free article] [PubMed] [Google Scholar]
- 130.Rygiel AM, Milano F, Ten Kate FJ, et al. Assessment of chromosomal gains as compared to DNA content changes is more useful to detect dysplasia in Barrett’s esophagus brush cytology specimens. Genes Chromosomes Cancer. 2008;47:396–404. doi: 10.1002/gcc.20543. [DOI] [PubMed] [Google Scholar]
- 131.Rossi E, Villanacci V, Bassotti G, et al. Her-2/neu in barrett esophagus:a comparative study between histology, immunohistochemistry, and fluorescence in situ hybridization. Diagn Mol Pathol. 2006;15:125–30. doi: 10.1097/01.pdm.0000213455.22527.f7. [DOI] [PubMed] [Google Scholar]
- 132.Cestari R, Villanacci V, Rossi E, et al. Fluorescence in situ hybridization to evaluate dysplasia in Barrett’s esophagus:a pilot study. Cancer Lett. 2007;251:278–87. doi: 10.1016/j.canlet.2006.11.033. [DOI] [PubMed] [Google Scholar]
- 133.Cameron AJ, Carpenter HA. Barrett’s esophagus, high-grade dysplasia, and early adenocarcinoma:a pathological study. Am J Gastroenterol. 1997;92:586–91. [PubMed] [Google Scholar]
- 134.Brankley SM, Wang KK, Harwood AR, et al. The development of a fluorescence in situ hybridization assay for the detection of dysplasia and adenocarcinoma in Barrett’s esophagus. J Mol Diagn. 2006;8:260–7. doi: 10.2353/jmoldx.2006.050118. [DOI] [PMC free article] [PubMed] [Google Scholar]
- 135.Barr Fritcher EG, Kipp BR, Slezak JM, et al. Correlating routine cytology, quantitative nuclear morphometry by digital image analysis, and genetic alterations by fluorescence in situ hybridization to assess the sensitivity of cytology for detecting pancreatobiliary tract malignancy. Am J Clin Pathol. 2007;128:272–9. doi: 10.1309/BC6DY755Q3T5W9EE. [DOI] [PubMed] [Google Scholar]
- 136.Wang KK, Barr Fritcher E, Halling KC, et al. The use of FISH in a multicenter blinded study to predict development of neoplasia in Barrett’s esophagus. Gastroenterology. 2009;136:A 157. [Google Scholar]
- 137.Jankowski JA, Odze RD. Biomarkers in gastroenterology:between hope and hype comes histopathology. Am J Gastroenterol. 2009;104:1093–6. doi: 10.1038/ajg.2008.172. [DOI] [PubMed] [Google Scholar]
- 138.Hoshida Y, Villanueva A, Kobayashi M, et al. Gene expression in fixed tissues and outcome in hepatocellular carcinoma. N Engl J Med. 2008;359:1995–2004. doi: 10.1056/NEJMoa0804525. [DOI] [PMC free article] [PubMed] [Google Scholar]
- 139.Fang M, Lew E, Klein M, et al. DNA abnormalities as marker of risk for progression of Barrett’s esophagus to adenocarcinoma:image cytometric DNA analysis in formalin-fixed tissues. Am J Gastroenterol. 2004;99:1887–94. doi: 10.1111/j.1572-0241.2004.30886.x. [DOI] [PubMed] [Google Scholar]
- 140.Leedham SJ, Preston SL, McDonald SA, et al. Individual crypt genetic heterogeneity and the origin of metaplastic glandular epithelium in human Barrett’s oesophagus. Gut. 2008;57:1041–8. doi: 10.1136/gut.2007.143339. [DOI] [PMC free article] [PubMed] [Google Scholar]
- 141.Sato F, Jin Z, Schulmann K, et al. Three-tiered risk stratification model to predict progression in Barrett’s esophagus using epigenetic and clinical features. PLoS ONE. 2008;3:e1890. doi: 10.1371/journal.pone.0001890. [DOI] [PMC free article] [PubMed] [Google Scholar]
- 142.Maley CC, Galipeau PC, Finley JC, et al. Genetic clonal diversity predicts progression to esophageal adenocarcinoma. Nat Genet. 2006;38:468–73. doi: 10.1038/ng1768. [DOI] [PubMed] [Google Scholar]
- 143.Brabender J, Marjoram P, Salonga D, et al. A multigene expression panel for the molecular diagnosis of Barrett’s esophagus and Barrett’s adenocarcinoma of the esophagus. Oncogene. 2004;23:4780–8. doi: 10.1038/sj.onc.1207663. [DOI] [PubMed] [Google Scholar]