

Abstract
The use of the effective antineoplastic agent cisplatin is limited by its serious side effects, such as oto- and nephrotoxicity. Ototoxicity is a problem of special importance in children, because deafness hampers their language and psychosocial development. Recently, organic cation transporters (OCTs) were identified in vitro as cellular uptake mechanisms for cisplatin. In the present study, we investigated in an in vivo model the role of OCTs in the development of cisplatin oto- and nephrotoxicity. The functional effects of cisplatin treatment on kidney (24 hours excretion of glucose, water, and protein) and hearing (auditory brainstem response) were studied in wild-type and OCT1/2 double-knockout (KO) mice. No sign of ototoxicity and only mild nephrotoxicity were observed after cisplatin treatment of knockout mice. Comedication of wild-type mice with cisplatin and the organic cation cimetidine protected from ototoxicity and partly from nephrotoxicity. For the first time we showed that OCT2 is expressed in hair cells of the cochlea. Furthermore, cisplatin-sensitive cell lines from pediatric tumors showed no expression of mRNA for OCTs, indicating the feasibility of therapeutic approaches aimed to reduce cisplatin toxicities by competing OCT2-mediated cisplatin uptake in renal proximal tubular and cochlear hair cells. These findings are very important to establish chemotherapeutical protocols aimed to maximize the antineoplastic effect of cisplatin while reducing the risk of toxicities.
Cisplatin, one of the most effective and potent anticancer drugs, is used in the treatment of a wide variety of both pediatric and adult malignancies.1 When combined with bleomycin and etoposide, cisplatin is considered to be curative treatment for testicular cancer.2 However, the chemotherapeutic use of cisplatin is limited by serious side effects, such as nephrotoxicity and ototoxicity, sometimes requiring a reduction in dose or discontinuation of treatment. Even though nephrotoxicity can be managed with some success by concomitant use of i.v. hydration, it is still a major factor that limits the administration and efficacy of cisplatin in cancer therapy.3 Ototoxicity remains an unresolved clinical problem, especially in infants and younger children, where it leads to a considerable risk of delayed language development because of impaired perception of higher frequency consonant sounds that is of great importance in the presence of background noise. This may have devastating consequences for a young child's social and educational development.4
The molecular mechanisms of cellular cisplatin toxicity have been investigated intensively.2 The ototoxic effects of cisplatin include loss of outer hair cells, blebbing of outer and inner hair cells, degeneration of the stria vascularis, and a decrease in the number of spiral ganglion cells.5 In the kidney, cisplatin highly accumulates in cells of the terminal proximal tubule and of the distal nephron, where it causes either apoptosis or necrosis, depending on exposure time and concentration.2 Recently, some attention has been paid to the role of specific cellular uptake processes in cisplatin toxicity. The copper transporter (Ctr)1 seems to be involved in cisplatin accumulation in tumor cells6 as well as in the renal epithelial cells.7 However, the cisplatin uptake into renal tubular cells is also mediated by organic cation transporter (OCT)2 and the function of OCT2 is critically involved in the development of toxicity.8,9 In humans, OCT2 (hOCT2) is highly expressed at the basolateral side of all three segments of the proximal tubule.10 It represents a subtype of three OCTs that belong to the SLC22 transporter family. OCTs are highly expressed in intestine, liver, and/or kidney and play a pivotal role in drug absorption and excretion.11 They are polyspecific, electrogenic uniporters that may operate in both directions. Because the membrane potential provides part of the driving force, they preferably mediate organic cation uptake into cells at normal membrane potential.12 OCT2 has been proposed as target for protective therapeutic interventions accompanying cisplatin treatment. In vitro studies showed that administration of cisplatin together with a second substrate of organic cation transporters decreases cellular cisplatin accumulation protecting renal cells from cisplatin toxicity.8,9
In the present study, we demonstrated in an in vivo model that OCT2 plays a pivotal role in the development of cisplatin induced oto- and nephrotoxicity. For the first time we showed that cisplatin ototoxicity is linked to the expression of OCT2 in hair cells of the cochlea. Furthermore, the feasibility of a therapeutic approach aimed to reduce cisplatin toxicities has been demonstrated in vivo. These findings are very important to establish chemotherapeutic protocols aimed to maximize the antineoplastic effect of cisplatin while reducing the risk of toxicities.
Materials and Methods
Animals
Male FVB (Harlan-Winkelmann, Borchen, Germany) and OCT1/2−/− knockout (KO) mice (Prof. Schinkel, The Netherlands Cancer Institute, Amsterdam, The Netherlands) ∼7 to 9 weeks old and weighing 25 to 30 grams were used. The OCT1/2−/− KO mice have been described in detail elsewhere.13 Experiments were approved by a governmental-committee on animal welfare and were performed in accordance with national animal protection guidelines.
Study Protocol
Dosage of Cisplatin Treatment
To determine the dose of cisplatin that induces significant ototoxic and nephrotoxic effects in mice, the effects of i.p. injection of 5, 10, 15, and 20 mg/kg cisplatin were investigated. At day 4 after injection, doses of 15 or 20 mg/kg caused evident oto- and nephrotoxicity (data not shown). Because 20 mg/kg cisplatin was often lethal, a dose of 15 mg/kg cisplatin was used throughout the study. Using the animal dosage calculator of the U.S. Federal Drug Administration, this dose corresponds to administration of 52 mg cisplatin/m2 body surface area. For patient treatment, doses between 50 and 100 mg cisplatin/m2 body surface area are used (U.S. Federal Drug Administration).
Treatment
Animals were housed in metabolic cages for at least 3 days before treatment. At day 0, mice received single i.p. doses of vehicle (saline) or cisplatin (15 mg/kg body weight). Cisplatin (Teva Pharma, Kirchzarten, Germany) was freshly prepared on the day of administration in isotonic saline at a concentration of 1 mg/ml. Eight hours before cisplatin administration, drinking water was withheld. Preliminary studies revealed that inconsistent renal failure occurred when mice had free access to water before injection of more diluted (0.5 mg/ml) cisplatin, whereas development of ototoxicity was not influenced by the hydration status (Table 1, hydration profile). In some experiments, FVB mice were treated with cisplatin together with the organic cation cimetidine at an equimolar concentration (12.6 mg/kg body weight). Cimetidine was given i.p. (in a volume of 30 to 35 μl/mouse) immediately before the cisplatin injection. At day −1 and at day 4, blood from the retro-orbital plexus and 24-hours urines were collected for the determinations of blood urea nitrogen (BUN) concentration, and of glucose, protein, and water excretion. The functional parameters of the different treatment groups at day −1 are illustrated in Table 2. Auditory brainstem response (ABR) measurements were performed to monitor hearing function. After the measurements at day 4, the left kidney was removed and frozen in liquid nitrogen. The right kidney and the cochlea were removed after perfusion fixation with 4% neutral buffered formalin for histological analyses.
Table 1.
Effect on Hydration on Nephrotoxicity and Ototoxicity Measured 4 Days after Treatment with 15 mg/kg Cisplatin
| Nephrotoxicity | Ototoxicity | |
|---|---|---|
| No water deprivation Administration of cisplatin in a large volume (∼1 ml/mouse) | Inconsistent | Present |
| Water deprivation 8 hours before administration of cisplatin in a small volume (∼0.4 ml/mouse) | Present | Present |
Table 2.
Body Weight, 24 Hours Protein, Urine, and Glucose Excretion and BUN in Wild-Type and KO Animals at Day −1
| Body weight (g) | Protein excretion (mg/24 h) | Urine excretion (μl/24 h) | BUN (mg/dl) | Glucose excretion (mg/24 h) | |
|---|---|---|---|---|---|
| Wild-type | 26.2 ± 0.4 | 4.5 ± 0.2 | 1046 ± 56 | 72.4 ± 3.6 | 0.56 ± 0.04 |
| n = 58 | n = 58 | n = 59 | n = 29 | n = 57 | |
| +NaCl | 25.8 ± 0.8 | 4.6 ± 0.5 | 1130 ± 109 | 79.9 ± 7.9 | 0.52 ± 0.04 |
| n = 17 | n = 17 | n = 17 | n = 9 | n = 16 | |
| +Cisp | 25.9 ± 0.4 | 5.2 ± 0.4 | 1016 ± 67 | 66.5 ± 6.1 | 0.59 ± 0.04 |
| n = 19 | n = 18 | n = 16 | n = 11 | n = 18 | |
| +Cisp+Cim | 27.9 ± 0.8 | 4.5 ± 0.3 | 1114 ± 105 | 72.1 ± 3.4 | 0.67 ± 0.13 |
| n = 15 | n = 16 | n = 19 | n = 9 | n = 16 | |
| KO | 24.9 ± 0.5 | 3.9 ± 0.3 | 928 ± 71 | 65.8 ± 2.7 | 0.48 ± 0.02 |
| n = 21 | n = 19 | n = 21 | n = 17 | n = 21 | |
| +NaCl | 24.9 ± 0.7 | 3.7 ± 0.4 | 972 ± 112 | 66.6 ± 3.7 | 0.46 ± 0.03 |
| n = 11 | n = 11 | n = 11 | n = 9 | n = 11 | |
| +Cisp | 25.0 ± 0.7 | 3.6 ± 10 | 880 ± 88 | 64.9 ± 4.1 | 0.50 ± 0.03 |
| n = 10 | n = 10 | n = 10 | n = 8 | n = 10 |
ABR Measurements
For ABR measurements, needle electrodes were placed s.c. to the ipsilateral and contralateral postauricular area (−), the vertex (+), and the back (ground electrode). Mice were placed in an air-conditioned acoustical protected box (Industrial Acoustics, Niederkruchten, Germany). Stimuli were generated using a self-programmed Matlab-based software (R2006b; The Mathworks, Natick, MA) and an external soundcard (Edirol UA-25; Edirol, London, UK). After preamplifying (Electrostatic Speaker Driver ED1; Tucker-Davis Technologies, Alachua, FL), stimuli were applied to the left ear using an in-earphone (EC1; Tucker-Davis Technologies). The ABR stimulation system was calibrated before recording sessions with an ear simulator (Type 4157, Brüel & Kjaer, Naerum, Denmark) connected to a Falcon microfone preamplifier (Type 2669; Brüel & Kjaer) and a PULSE Analyzer acquisition system (Type 7700; Brüel & Kjaer). Biphasic click stimuli of alternating polarity with a duration of 0.1 ms and tone bursts of 8, 16, and 32 kHz with a duration of 2 ms were presented. Sampling rate was 96 kHz, and stimulus onset asynchrony varied randomly between 21 and 23 ms. Stimulation started at 95-dB sound pressure level and was decreased in 10-dB steps. When no more ABR response could be detected, the sound pressure level was increased in 5-dB steps until ABR responses was detectable again. Minimum stimulating level with measurable ABR response was defined as threshold. A measurable ABR response at near threshold levels was identified by repeated measurement to estimate the reproducibility and by comparing the pattern with responses at the next two higher levels. For each stimulus, number of sweeps per presentation was 2000. ABRs were detected using a Nicolet Bravo EP-System (VIASYS Health Care, Höchberg, Germany) with a recording sampling rate of 39.7 kHz. Personnel performing these measurements had no information about the kind of animal treatment.
Measurements of BUN, Proteins, and Glucose and Histology
BUN was measured using the QuantiChrom Urea assay (BioAssay Systems, Hayward, CA), proteins using a modified Bradford method (Bradford Blue; Bio-Rad, Munchen, Germany), and glucose was measured by the hexokinase method with a Roche Hitachi Modular automatic analyzer (Gluco-quant Glucose; Roche, Mannheim, Germany). Paraffin sections of the kidney were stained with the periodic acid-Schiff method.
Cochlea Preparation
The cochleae were obtained by rapid dissection as described previously.14 Briefly, the skull was opened, the brain removed, and the cochlea was dissected from the surrounding temporal bones and transferred to a petri dish. A small hole was made in the apex of the cochlea to enhance the penetration of fixative (4% paraformaldehyde in 0.1 M PBS (pH 7.4)). The cochlea was then immersed in fresh fixation solution and postfixed overnight at 4°C. After fixation, the cochlea was washed three times for 3 × 10 minutes in 0.1 M PBS at room temperature and decalcified by incubation with a 10% EDTA solution in PBS at 4°C. The EDTA solution was changed daily until decalcified. Sufficient decalcification for cryosectioning was achieved after 3 days with mice of this age.
For analysis of mRNA expression in the cochlea, four anesthetized wild-type animals were perfused with PBS, cochleae were rapidly dissected from the temporal bones, the bony wall was removed, and the modiulus with the whole cochlear tissue was stored in RNAlater (Qiagen, Hilden, Germany) until analysis. To quantify the relative expression of various genes, cochlea cDNAs from the four animals were pooled and analyzed by real-time PCR.
OCT2 Protein Expression
Expression of OCT2 in the kidney and the cochlea was investigated using a specific antibody (Supplemental Figure 1, see http://ajp.amjpathol.org) raised against a specific 19-aa sequence (SLQSLTADEDTGMKLNPSC) in the large intracellular loop of mouse OCT2 (mOCT2) (317-334). Five- or seven-micrometer-thick cryosections were prepared from mouse kidneys and cochleae (n = 5), respectively, which have been fixed in melting 2-methylbutane. Cryosections were incubated for 1 hour at room temperature in PBS containing 10% normal goat serum (pH 7.4) and then for 90 minutes at room temperature with affinity-purified primary antibodies at a dilution of 1/200 (kidney sections) and 1/100 (cochlea sections). After washing in PBS, the sections were incubated for 45 minutes at room temperature with PBS-diluted secondary antibodies (Alexa Fluor 488 goat anti-rabbit-Ig, 1/1000; Invitrogen, Karlsruhe, Germany). Sections were rinsed with PBS, coverslipped with Crystal Mount (GeneTex, San Antonio, TX), and evaluated by epifluorescence microscopy (Observer Z1 with apotome; Zeiss, Göttingen, Germany). Negative control slides were included without addition of primary antibody or by incubation with the control peptide.
Determination of Platinum in Mouse Kidney
Platinum in mouse tissue samples was determined by graphite furnace atomic absorption spectrometry using a model AAnalyst 600 instrument (PerkinElmer, Shelton, CT). Tissue samples of 30 to 85 mg were weighed into 1.5-ml sample cups and solubilized in tetrametylammonium hydroxid. Solubilization of tissue samples took place during 24 hours at room temperature. To improve the sensitivity of the method, high amounts of the resulting sample slurry were injected into the furnace using the so-called multi-injection technique and end-capped graphite tubes with integrated platforms. Up to four 30-μl aliquots of the sample slurry were injected onto the platform of the furnace, each one followed by a drying and pyrolysis step (1300°C), to reduce the matrix loading before the final atomization. Background absorption signals produced during the following atomization at 2200°C by the residual amounts of sample matrix left over in the furnace after pyrolysis were corrected by the Zeeman-type background correction technique. Quantification was realized by external calibration with aqueous standards.
mRNA-Expression of hOCTs and hCtr1 in Cisplatin-Sensitive Cell Lines Derived from Human Tumors
The mRNA expression of OCTs and hCtr1 was analyzed on a panel of 18 permanent human tumor cell lines consisting of six different tumor types including four Ewing sarcoma cell lines (CADO-ES-1, STA-ET-1, STA-ET-2.1, VH-64), four neuroblastoma cell lines (IMR5, KCN, SHEP-SF, SH-SY5Y), two medulloblastoma cell lines (MNNG-HOS, UW228.2), two rhabdomyosarcoma cell lines (RD, RH30), two human acute lymphoblastic leukemia T cell lines (CCRF-CEM and MOLT-4), the human B cell precursor acute lymphoblastic leukemia cell line REH, and the human acute myeloid leukemia cell line HL-60. Except the human acute myeloid leukemia cell line HL-60 all cell lines originated from pediatric malignancies. CCRF-CEM, MOLT-4, REH, HL-60, CADO-ES-1, SH-SY5Y, and RH-30 were purchased from the German Collection of Microorganisms and Cell Cultures (DSMZ, Braunschweig, Germany). DAOY, RD, and IMR-5 were acquired from ATCC-LGC (Promochem, Wesel, Germany). KCN, SHEP-SF, OST, and MNNG-HOS were provided by C. Poremba (Institute of Pathology, University of Düsseldorf, Düsseldorf, Germany). UW228.2 was allocated by M. Frühwald (University Children's Hospital Münster, Department of Pediatric Hematology and Oncology, Münster, Germany) with kind permission of J. Silber (Department of Neurological Surgery, University of Washington, Seattle, WA). Finally, STA-ET-1, STA-ET-2.1, and VH-64 were obtained by courtesy of F. van Valen (University Hospital Münster, Department of Orthopedics, Münster, Germany). All cell lines were maintained in RPMI 1640 medium (Invitrogen, Karlsruhe, Germany) supplemented with 200 mmol/L l-glutamine, 100 U/ml penicillin G, 100 μg/ml streptomycin, 25 μg/ml amphotericin B, and 10% fetal calf serum in 7.5-cm2 tissue culture flasks in a humidified atmosphere of 5% CO2 at 37°C. The Ewing sarcoma cell lines were grown on collagen-coated tissue culture flasks. All cell lines were sensitive to cisplatin (C. Lanvers-Kaminsky, unpublished results). Human embryonic kidney (HEK293) cells stably transfected with hOCT1, hOCT2, or hOCT3 served as control for OCT expression. For transfection protocols see, Ref. 15.
Cell Viability Assay
Chemosensitivity was evaluated by a modified 3-(4,5-dimethylthiazol-2-yl)-2,5-diphenyl-2H-tetrazolium bromide (MTS) proliferation assay.16,17 MOLT 4 cells, which do not express hOCT2 (see Table 3), were plated on 96-well flat-bottom microtiter plates (BD Biosciences, Heidelberg, Germany). One hundred μl of cell suspension (50,000 cells/ml) were added to each well and plates were incubated in a humidified atmosphere with 5% CO2 at 37°C. After 24 hours, 100 μl of complete cell culture medium containing cisplatin or cisplatin combined with different concentrations of cimetidine were added. The solutions added contained twice the desired drug concentration to result in the final concentrations of 100 μmol/L for cisplatin and 20, 50, and 100 μmol/L for cimetidine. Control cells were incubated with both drug-free complete cell culture medium. After 24, 48, and 72 hours, 20 μl of MTS reagent (CellTiter 96 AQueous Nonradioactive Cell Proliferation Assay (MTS); Promega, Mannheim, Germany) was added to each well and the cells were incubated for another 3 hours. Mitochondrial dehydrogenases of viable cells reduced the yellow MTS to the blue formazan dye, whose absorbance correlates to the amount of viable cells. Absorbance was measured at 490 nm using an automated microplate reader (Multiskan Ascent; Thermo Scientific, Langenselbold, Germany). Each drug concentration was tested in four replicates from which mean values and SEM were calculated. The percentage of viable cells was compared in untreated controls versus drug concentrations.
Table 3.
Expression of mRNA for Human OCT, Ctr1, and GAPDH in 16 Permanent Human Tumor Cell Lines
| mRNA expression |
|||||
|---|---|---|---|---|---|
| Cell line | hOCT1 | hOCT2 | hOCT3 | hCtr1 | GAPDH |
| CADO-ES-1 | − | − | − | + | + |
| STA-ET-1 | − | − | − | + | + |
| STA-ET-2.1 | − | − | − | + | + |
| VH-64 | − | − | − | + | + |
| IMR5 | − | − | − | + | + |
| KCN | − | − | − | + | + |
| SHEP-SF | − | − | − | + | + |
| SH-SY5Y | − | − | − | + | + |
| MNNG-HOS | − | − | − | + | + |
| UW228.2 | − | − | − | + | + |
| RD | − | − | − | + | + |
| RH30 | − | − | − | + | + |
| CCRF-CEM | − | − | − | + | + |
| MOLT-4 | − | − | − | + | + |
| REH | − | − | − | + | + |
| HL-60 | − | − | − | + | + |
| hOCT1-HEK | + | − | − | n.i. | + |
| hOCT2-HEK | − | + | − | n.i. | + |
| hOCT3-HEK | − | − | + | n.i. | + |
Human embryonic kidney (HEK) cells stably transfected with the different OCT isoforms were used as control. +, present; −, absent; n.i., not investigated.
PCR Analysis
For PCR analysis total RNA was isolated using the Qiagen RNeasy Midikit (Qiagen, Gilden, Germany) according to the manufacturer's recommendation. Reverse transcription was performed using the Superscript II system (Invitrogen, Carlsbad, CA) according to the manufacturer's recommendation. Standard PCR was performed using specific primer pairs as listed in Table 4. The PCR products were separated using agarose-gel electrophoresis. Real-time PCR was performed using the SYBR Green PCR Master Mix with the ABI PRISM 7900 Sequence Detection System. All instruments and reagents were purchased by Applied Biosystems (Darmstadt, Germany). Relative gene expression values were evaluated with the 2−ΔΔCt method using glyceraldehyde-3-phosphate dehydrogenase (Gapdh) as housekeeping genes.18
Table 4.
Primer Sequences
| Gene name | Primer sequence (5′→3′) | Accession no. |
|---|---|---|
| Homo sapiens | ||
| Solute carrier family 31 member 1 (SLC31A1, hCtr1) | S CCTCACACTCCCATGGTGGAG | NM_001859.3 |
| AS GCTGTATTGATCACCAAACCGG | ||
| GAPDH | S CAAGCTCATTTCCTGGTATGAC | BC013852 |
| AS GTGTGGTGGGGGACTGAGTGTGG | ||
| Solute carrier family 22 member 1 (SLC22A1, hOCT1) | S CATCATAATCATGTGTGTTGGCC | NM_003057 |
| AS CAAACAAAATGAGGGGCAAGGCTT | ||
| Solute carrier family 22 member 2 (SLC22A2, hOCT2) | S CATTGAACTAAGAAGAGAGACCG | NM 153191 |
| AS CCACAGTGTACAATAGACTCCA | ||
| Solute carrier family 22 member 3 (SLC22A3, hOCT3) | A GGAATAGCATGGTGGAGGACCA | NM_021977 |
| AS GGGGCTATGATTCCCCCAAAA | ||
| Mus musculus | ||
| Solute carrier family 22, member 1 (Slc22a1, mOCT1) | S TGCCGTGTCAGGAGCTGAGTGG | NM 009202 |
| AS GGTTGGGAATTCATTTGGAACCTGGT | ||
| Solute carrier family 22, member 2 (Slc22a2, mOCT2) | S CAACCCAACCTCACTTACCCCTGA | NM 013667 |
| AS GCATTCCCCAGGACTGTTGAGAG | ||
| Solute carrier family 22, member 3 (Slc22a3, mOCT3) | S GGACCTGGCTGTGGTATTGTGAAG | NM 013667 |
| AS TGGGAAATCCAAATCCGTGCTT | ||
| Gapdh | S TGGCCTTCCGTGTTCCTACC | BC083149 |
| AS GGTCCTCAGTGTAGCCCAAGATG | ||
| Solute carrier family 31, member 1 (Slc31a1, mCtr1) | S CCTCACACTCCCACGGTGGAG | NM_175090 |
| AS CACTGCCACGAAGGCTCCAGC |
S, Sense; AS, Antisense.
In Situ Detection of DNA Fragmentation
DeadEnd Colorimetric TUNEL System (Promega) was used to detect apoptosis in kidney tissue from five mice of every group. Paraffin blocks were sectioned at 4-μm thickness on slides. Sections were deparaffined in Clear Rite 3 (Thermo Fisher Scientific, Waltham, MA) and rehydrated in graded ethanol and PBS. Positive and negative controls of terminal deoxynucleotidyl transferase-mediated dUTP nick-end labeling (TUNEL) stain were also performed. The number of TUNEL-positive cells in the sections from three different kidneys for every group was counted in at least 15 nonoverlapping fields/section under ×400 magnification in a blinded fashion and averaged.
Statistics
Data were analyzed by the help of using GraphPad Prism, Version 4.0 (GraphPad Software, San Diego, CA). Paired or unpaired two-sided Student's t-test and analysis of variance variance analysis with Newman-Keuls post-test for multiple comparisons were used where appropriate to prove statistical significance of the effects. Data are presented as mean values ± SEM (n = number of animals, samples, or experiments). Significance was inferred at the P < 0.05 level.
Results
Effects of Cisplatin Treatment on Renal Function
Before cisplatin treatment (day −1) wild-type and KO mice showed similar body weight, similar excretion of urine, protein, glucose (during 24 hours), and similar BUN concentration (Table 2). For treatment with saline, cisplatin, or cisplatin plus cimetidine, the animals were randomly divided into subgroups that showed similar functional parameters (Table 2). To investigate effects of cisplatin treatment on kidney function, body weight, 24 hours urine-, glucose excretion, protein-excretion, and BUN were compared at day −1 and 4. Because of occasional urine contamination with drinking water or with excrements, the number of paired observations is sometimes different from the number of animals used in every group.
Compared with day −1, treatment of wild-type mice with cisplatin induced a significant reduction in body weight at day 4 (−2.3 ± 0.4 g, n = 18; Figure 1A). However, in KO mice, a similar reduction in body weight was induced by cisplatin (−1.8 ± 0.5 g, n = 10; Figure 1A), and also coadministration of cimetidine with cisplatin did not decrease the body weight reduction in wild-type mice (−2.6 ± 0.4 g, n = 15; Figure 1A). The comparison of the effects at day 4 shows that wild-type mice treated with cisplatin or with cisplatin and cimetidine had a significantly higher weight loss compared with untreated wild-type and KO mice (Figure 1A). Compared with day −1, cisplatin treatment also caused a significant polyuria in wild-type mice at day 4 (+637 ± 176 μl/24 hours, n = 17; Figure 1B) and in KO animals (+294 ± 127 μl/24 hours, n = 10; Figure 1B). Comedication of cimetidine in wild-type mice had no protective effect (increase of urine excretion: +690 ± 128 μl/24 hours, n = 15; Figure 1B). The comparison of the effects at day 4 shows that wild-type mice treated with cisplatin or with cisplatin and cimetidine had a significantly higher urine excretion compared with untreated wild-type mice. Compared with day −1, after treatment of wild-type mice with cisplatin the excretion of proteins was significantly increased at day 4 (+2.0 ± 0.5 mg/24 hours, n = 17; Figure 1C). This effect was not observed in KO mice (+0.4 ± 0.4 mg/24 hours, n = 10; Figure 1C); however, cimetidine was not able to suppress the proteinuria in wild-type mice (+2.0 ± 0.4 mg/24 hours, n = 14; Figure 1C). The comparison of the effects at day 4 shows that wild-type mice treated with cisplatin or with cisplatin and cimetidine had a significantly higher protein excretion compared with untreated wild-type mice. The mechanisms for the cisplatin induced changes in body weight, urine, and protein excretion are complex and only partially dependent on cisplatin uptake by OCT2.
Figure 1.
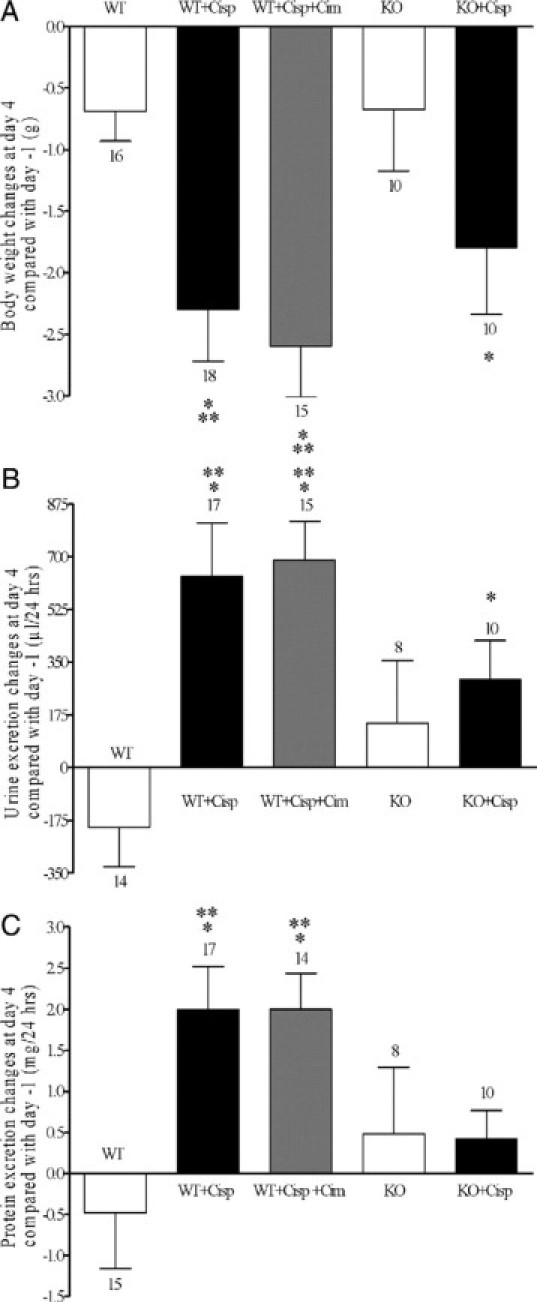
Effects of saline (white bar) or cisplatin treatment on body weight (A), 24 hours urine (B), and protein (C) excretion in wild-type (WT) and KO mice. The effects of comedication with an equimolar dose of cimetidine are also shown. Values are expressed as difference between day 4 after and day −1 before treatment. Compared with day −1, cisplatin treatment caused a significant body weight loss and a significant polyuria at day 4 in WT and KO mice and also under contemporaneous administration of cimetidine. The comparison of the effects at day 4 shows that the weight loss after cisplatin or cisplatin and cimetidine treatment of WT mice was significantly higher than in WT and KO mice treated with saline. B: WT mice treated with cisplatin or with cisplatin and cimetidine had a significantly higher urine excretion than WT mice treated with saline. C: Compared with day −1, cisplatin treatment caused a significant proteinuria at day 4 in WT and also in WT mice treated with cimetidine and cisplatin. This proteinuria was significantly higher in these two groups compared with wild-type mice treated with saline. No significant proteinuria was observed in KO mice after cisplatin injection. The number of animals tested in every group is shown for each column. *P < 0.05 paired t-test; **P < 0.05, analysis of varience with Newman-Keuls post-test.
Cisplatin treatment caused an OCT dependent increase in BUN. Four days after application of cisplatin to wild-type mice, BUN increased by 59 ± 17 mg/dl (n = 9) compared with day −1, whereas application of saline had no effect (−4 ± 5 mg/dl, n = 9) (Figure 2A). Most of cisplatin dependent BUN increase could be prevented by comedication with cimetidine (increase of 18 ± 9 mg/dl, n = 9; Figure 2A). In KO mice, no significant increase in BUN was observed after application of saline (+12 ± 5 mg/dl, n = 9; Figure 2A). Since also only a small increase of BUN was observed after application of cisplatin (+23 ± 9 mg/dl, n = 6, no significant difference to day −1; Figure 2A), cisplatin had no specific effect on BUN levels in the KO mice. The comparison of the effects at day 4 shows that wild-type mice treated with cisplatin had a significantly higher increase in BUN compared with the other groups.
Figure 2.
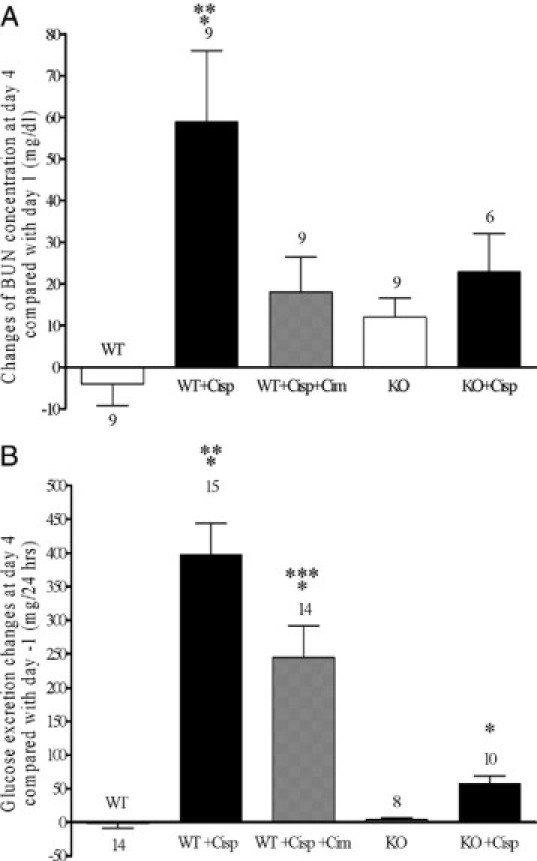
Effects of saline (white bar) or cisplatin treatment on BUN (A) and 24 hours glucose excretion (B) in wild-type (WT) and KO mice. The effects of comedication with an equimolar dose of cimetidine are also shown. Values are expressed as difference between day 4 after and day −1 before treatment. Compared with day −1, cisplatin treatment caused a significant increase of BUN level in wild-type. In KO mice and also in wild-type mice contemporaneously given cimetidine and cisplatin, no significant BUN increase could be observed (P > 0.05, paired t-test). The BUN increase observed in wild-type mice treated with cisplatin was significantly higher than what observed in the other groups. Compared with day −1, cisplatin treatment caused a dramatic glucosuria at day 4 in wild-type mice. Also in KO mice and in wild-type mice comedicated with cimetidine, a significant glucosuria was detected. However, at day 4, the glucose excretion in wild-type mice was significantly higher than that observed in the other groups. Glucose excretion under treatment with cimetidine and cisplatin was significantly different from all other groups including the cisplatin treatment group. The number of animals tested in every group is shown for each column. *P < 0.05 paired t-test; **P < 0.05, analysis of varience with Newman-Keuls post-test; ***P < 0.05, analysis of varience with Newman-Keuls multiple comparison test.
In wild-type mice, at day 4 cisplatin treatment induced a dramatic glucosuria (+398 ± 46 mg/24 hours, n = 15; Figure 2B) compared with day −1. Administration of cimetidine before cisplatin mitigated this effect significantly (+245 ± 47 mg/24 hours, n = 14; Figure 2B). In OCT-KO animals, effects of cisplatin treatment on glucose excretion were drastically reduced (+58 ± 11 mg/24 hours, n = 10; Figure 2B). The comparison of the effects at day 4 shows that wild-type mice treated with cisplatin or with cisplatin and cimetidine had a significantly higher glucose excretion compared with the other groups. However, the level of glucosuria was significantly lower in wild-type mice treated with cisplatin and cimetidine compared with wild-type mice treated with cisplatin alone.
Cisplatin treatment increased the number of apoptotic cells in the kidneys of wild-type animals (Figure 3, A and B). Cotreatment with cimetidine was not able to diminish the increased number of renal apoptotic cells induced by cisplatin (Figure 3C). In KO animals, no significant increase of apoptotic cells could be observed after cisplatin treatment (Figure 3, D and E). The TUNEL-positive nuclei/field were 15 ± 4, 207 ± 19, 203 ± 21, 13 ± 4, and 18 ± 4 all n = 3 in wild-type + NaCl, wild-type + cisplatin, wild-type + cisplatin + cimetidine, KO + NaCl, and KO + cisplatin, respectively (Figure 3F). The high number of TUNEL-positive nuclei after cisplatin or cisplatin + cimetidine treatments of wild-type animals could be explained by the fact that “reparable” DNA strand breaks may also become TUNEL labeled.19
Figure 3.

Representative photomicrographs of histology of renal corticomedullary junctions (×630) showing apoptosis induced by cisplatin. Formalin-fixed, paraffin-embedded kidneys were stained for fragmented DNA by the TUNEL method. A: Saline-treated control wild-type (WT) mouse. B: Cisplatin-treated WT mouse. C: Cisplatin + cimetidine-treated WT mouse. D: Saline-treated control KO mouse. E: Cisplatin-treated KO mouse. Apoptosis is evident after treatment of WT mice with cisplatin (B). Cotreatment with cimetidine did not suppress the induction of apoptosis (C). No apoptosis induction by cisplatin treatment was detected in KO mice (D and E). F shows the number of TUNEL-positive cells in the sections from three different kidneys for every group counted in at least 15 nonoverlapping fields/section in a blinded fashion and averaged. Significantly more apoptotic cells are evident in WT mice treated with cisplatin or cisplatin and cimetidine compared with the other groups (*P < 0.05, analysis of variance with Newman-Keuls multiple comparison test). The number of kidneys tested in every group is shown above the columns.
Morphological signs of renal toxicity (tubular protein casts and vacuolization of proximal tubular cells) were evident only in wild-type animals treated with cisplatin alone (for periodic acid-Schiff staining of the kidney in Supplemental Figure 2, see http://ajp.amjpathol.org).
The role of OCT mediated accumulation of cisplatin in the kidney was further investigated by comparing the renal platinum content at day 4 in wild-type and KO mice. As evident from Figure 4, wild-type mice accumulated significantly more platinum in the kidneys compared with KO mice (573 ± 129 pg platinum/mg kidney tissue; n = 5 and 133 ± 25 pg platinum/mg kidney tissue; n = 4, respectively) furnishing additional evidence for the important contribution of OCT in the renal transport of cisplatin.
Figure 4.

Kidney platinum content in wild-type (WT) and KO mice at day 4 after cisplatin injection. Kidneys from WT mice contain significantly more platinum than those from KO mice (*P < 0.05, unpaired t-test). The number of kidneys tested in every group is shown above the columns.
Functional Effects of Cisplatin Treatment in the Inner Ear
Mean changes in hearing thresholds in different groups are shown in Figure 5. Because measurements were stopped when mice woke up from anesthesia, numbers of tested animals vary for different frequencies. Compared with day −1, at day 4 only wild-type mice treated with cisplatin showed a significant ABR threshold shift at 16 kHz (9.62 dB) and 32 kHz (20.83 dB), while no significant changes of hearing threshold could be detected at any frequency in control wild-type mice and KO mice. Cotreatment with cimetidine suppressed the cisplatin-induced ABR threshold shift observed in wild-type mice. In KO mice, treatment with cisplatin caused no significant ABR threshold shift compared with untreated mice.
Figure 5.

Mean changes in hearing thresholds in wild-type (WT) and KO mice treated with saline or cisplatin at the frequencies of 8, 16, and 32 kHz. The effects of comedication of WT mice with an equimolar dose of cimetidine are also shown. Four days after treatment, cisplatin caused a significant hearing loss in WT mice at 16 and also 32 kHz (*P < 0.05, paired t-test) compared with day −1, whereas no significant change of hearing threshold could be detected at any frequency in KO mice. Cotreatment with cimetidine suppressed the cisplatin-induced hearing loss observed in WT mice. Changes in hearing thresholds under treatment with cisplatin at the frequency of 32 kHz were significantly different from all other groups (**P < 0.05, analysis of variance with Newman-Keuls multiple comparison test). The number of animals tested in every group is shown for each column.
In click stimulus and other frequencies, no significant differences could be detected apart from a small significant difference in click threshold between wild-type mice treated with cisplatin and wild-type mice treated with cisplatin and cimetidine (difference 11.25; P = 0.012).
In KO mice, treatment with cisplatin caused no significant ABR threshold shift compared with untreated mice.
OCT and Ctr1 Expression in the Mouse Cochlea
The presence and functional importance of OCT1, OCT2, and Ctr1 in the mouse kidney is well-known.7,13,20,21 However, there is no information about their presence in the mouse cochlea. Figure 6A shows a representative PCR analysis of the mouse cochlea, where a strong signal for mOCT2, and weaker signals for mOCT1 and mCtr1 are evident. No specific amplification of mOCT3 could be detected (Figure 6A). The same results were obtained using the cochleae of three other animals. In an attempt to quantify the differences in expression, the cDNA from the cochleae of all four animals were pooled and measured by real-time PCR. OCT2 was expressed 2.2 and 48.2 times higher than OCT1 and Ctr1, respectively (the Ct values were 29.0 (OCT2), 30.2 (OCT1), 34.6 (Ctr1), and 22.3 (Gapdh)). These findings suggest that mOCT2 is the principal OCT isoform and that the Ctr1 has a low expression in the mouse cochlea. Because the KO mice showed no sign of ototoxicity on cisplatin treatment and since OCT2 and not OCT1 transports cisplatin at least in humans and rats,8,9,22 we have focused our immunohistochemical analysis on mOCT2. As evident from Figure 6B, mOCT2 labeling appears to be specifically associated with outer and inner hair cells. Specifically, mOCT2 seems to be localized at the apical pole of outer hair cells, whereas in inner hair cells, it is distributed across the entire cell. In KO mice, no labeling for mOCT2 could be detected in these cells (Figure 6C). No base to apex gradient in the labeling of mOCT2 in the Corti organ was observed. A specific mOCT2 expression was detected also in the stria vascularis cells, with an apparently stronger signal in the basal turns of the cochlea (Figure 7). No specific mOCT2 labeling of spiral ganglion cells was observed.
Figure 6.
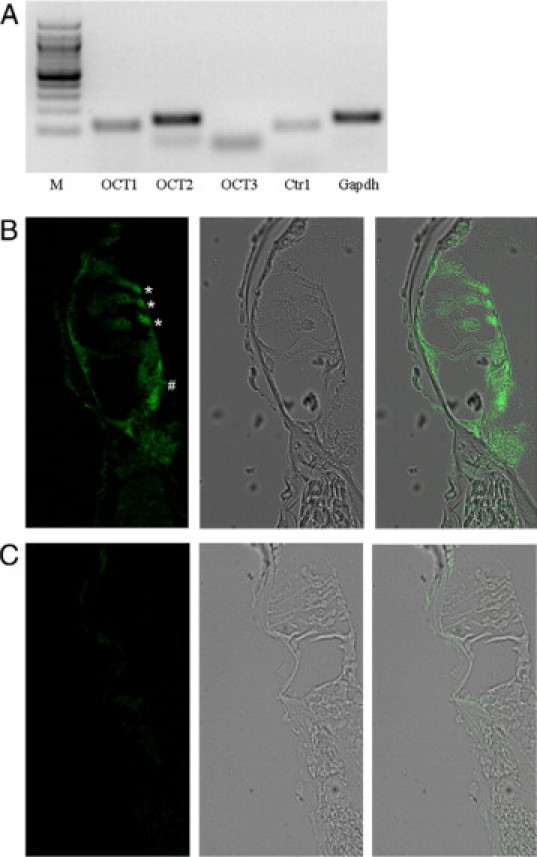
Expression of OCT and CTR1 in the cochlea. A: Representative PCR analysis of OCT and CTr1 in the mouse cochlea. M is the molecular weight marker lane. B: Immunohistochemistry of mOCT2 expression in the cochlea from a wild-type (WT) mouse. The microphotography in B (left) shows that the labeling for mOCT2 is localized both in the inner (#) and outer (*) hair cells, and also in inner spiral bundle fibers. Middle: bright-field imaging of the same cochlea; right: overlay imaging. C: Labeling of mOCT2 in KO mice. The microphotography in C (left) has been obtained using the same illumination conditions as for B (left). Bright field (middle) and overlay imaging (right) of the Corti organ. No specific labeling of inner and outer hair cells was observed.
Figure 7.

Expression of mOCT2 in the stria vascularis. Representative immunohistochemistry of mOCT2 expression in the stria vascularis of mouse cochlea from apical (A) and basal (C) turns, with the respective (B and D) negative controls in the presence of the blocking peptide. Green is the OCT2 and blue the 4′,6-diamidino-2-phenylindole (DAPI) labeling of cell nuclei. The pictures have been obtained using the same illumination conditions. On the right the respective bright field microphotographs are shown.
Expression of OCT and Ctr1 in Cisplatin-Sensitive Human Tumor Cell Lines and Cisplatin Toxicity in MOLT4 Cells
PCR-analysis of several different cell lines derived from tumors that are sensitive to cisplatin (C. Lanvers-Kaminisky, unpublished observations) showed that these cells do not express any OCT isoform. Importantly, these cells all express the human Ctr1 (Table 3).
Only after 48 and 72 hours, incubation with 100 μmol/L cisplatin gave rise to a significant decrease in viability of MOLT4 cells as compared with control experiments (Figure 8). Coincubation with 20, 50, and also 100 μmol/L cimetidine did not change the toxic effects of cisplatin, suggesting that cimetidine does not neutralize cisplatin toxicity by a direct chemical interaction with cisplatin.
Figure 8.
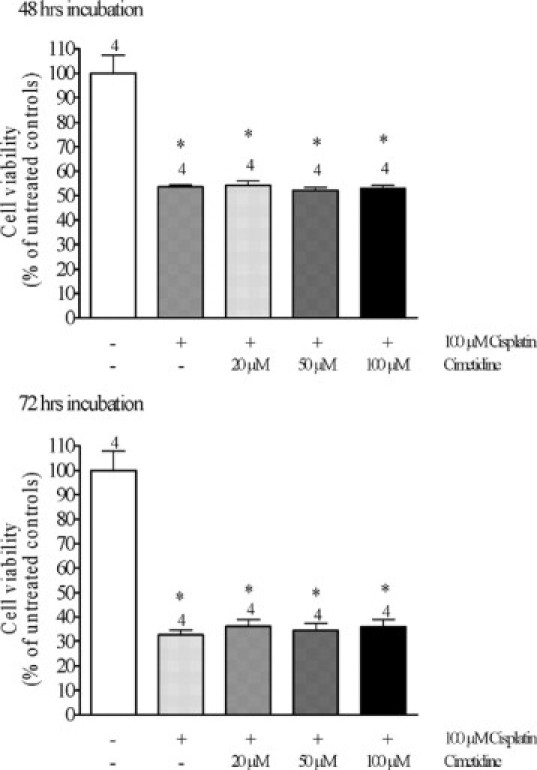
Effects of 48 (upper panel) or 72 hours (lower panel) incubation of MOLT4 cells, which do not express hOCT2, with 100 μmol/L cisplatin in the presence of 0, 20, 50, or 100 μmol/L cimetidine on the cell viability as measured with the 3-(4,5-dimethylthiazol-2-yl)-2,5-diphenyl-2H-tetrazolium bromide proliferation assay. Cisplatin caused a significant decrease in cell viability only after 48 hours incubation. Addition of cimetidine at any concentration did not change the effect of cisplatin both after 48 and 72 hours incubation (*P < 0.05, significantly different from controls, analysis of variance with Newman-Keuls multiple comparison test).
Discussion
Even though very effective in the treatment of several tumor types, antineoplastic therapy with cisplatin is limited by its specific toxicities against renal, cochlear, and nervous cells. Especially nephrotoxic risks preclude the use of higher doses to maximize the therapeutic effect of cisplatin.23
Many aspects of the cytotoxic cisplatin interactions with DNA and cellular proteins have been described in detail.24 However, they do not explain its specific toxic side effects in some organs or even substructures of these organs. Recently, the presence of specific uptake systems for cisplatin, such as OCT2 and Ctr1,7–9,25 in renal tubular cells has been demonstrated to be important for its toxicity, at least in vitro. In tumor cells a role of copper influx (Ctr1) and efflux (ATP7A and ATP7B) transporters for mediation of cisplatin uptake and efflux has been proposed.26 The exact knowledge of cisplatin transport systems in tumor and normal cells will contribute on one side to design platinum derivatives with better uptake by or slower release from tumor cells and on the other side to reduce toxic side effects in normal tissues and establish suitable therapeutic protocols to protect renal, cochlear and nervous cells from cisplatin toxicity.
In this study, to determine the role of OCT in the development of cisplatin nephro- and ototoxicity in vivo, the effects of cisplatin on kidney and cochlear functions in wild-type and OCT1/2−/− KO mice were compared. Moreover, the efficacy of a protective intervention consisting of competition of cisplatin uptake at the OCT level by the organic cation cimetidine was also tested. Under cisplatin treatment the wild-type animals showed a significant body weight reduction and also signs of both nephrotoxicity (such as a significant increase of BUN concentration, significant polyuria, proteinuria, glucosuria and apoptosis) and ototoxicity (such as a significant hearing loss at high frequencies). The absence of OCT in KO mice did not change the effects of cisplatin on body weight and polyuria, probably because cisplatin is able to reduce the expression of renal water channels (aquaporins, AQPs) along the entire nephron, as already shown in rat kidneys.27 These studies showed that the expression of AQP1 and AQP2 was decreased after cisplatin treatment in the cortex, the outer medulla, and the inner medulla and that of AQP3 in the outer medulla and the inner medulla. This fact, together with an apparent missing adaptation of drinking behavior after cisplatin treatment (data not shown), can explain the weight loss independently from OCT. In contrast, glucosuria, a marker for dysfunction of the proximal tubule, was markedly lower in KO compared with wild-type mice after cisplatin treament. Proteinuria or apoptosis of renal cells as consequences of cisplatin treatment were not observed in KO mice. Furthermore, the renal platinum accumulation was substantially higher in wild-type than KO mice. These findings show the important contribution of OCT to the cisplatin uptake and, as a consequence, its nephrotoxic effects.
Given the cochlea's function as a neurosensory organ and its need to maintain the unique ionic homeostasis of endolymph, it is conceivable that several genes encoding ion transporters that can transport a variety of substrates including neurotransmitters are expressed in this tissue. cisplatin specifically induced a marked high frequency hearing loss in wild-type mice, which is in accordance with hearing loss observed in humans, especially in children undergoing cisplatin therapy.28
For the first time we show here that OCT2 plays a primary role also for cisplatin-induced ototoxicity. OCT2 expression in inner and outer hair cells and in the stria vascularis cells of the cochlea was clearly demonstrated. Although the labeling of mOCT2 was not different in Corti organs from basal compared with that from apical turns of the cochlea, the labeling of mOCT2 in stria vascularis cells in basal turns appears stronger than in the same cells of apical turns, suggesting a role of this structure in inducing cisplatin toxicities first in the cells of the basal turns. However, other specific cellular intrinsic factors, such as the stronger expression of antioxidative enzymes in apical compared with basal turn outer hair cells,29 play of course an important role in determining the higher sensitivity of the basal part of the cochlea against cisplatin, resulting in high frequency hearing loss.
Both in KO animals and in wild-type mice comedicated with the competitive OCT substrate cimetidine, cisplatin-induced ototoxicity was totally absent, although some signs of nephrotoxicity still persisted. This fact could be explained when considering that the mouse kidney expresses the Ctr1 both in proximal and distal tubules,7 which is also able to mediate the uptake of cisplatin to some degree. An explanation why animals comedicated with cisplatin and cimetidine still developed some signs of nephrotoxicity, such as proteinuria and apoptosis, is indeed at this point very difficult and can be only of speculative nature. Cimetidine is an inhibitor of several isoforms of Na+/H+ exchangers,30 and Na+/H+ exchanger 3 seems to play an important role in the endocytosis of proteins in proximal tubule cells.31 Because treatment with cimetidine alone does not induce proteinuria (data not shown), it might be speculated that cimetidine interference with the endosome acidification and therefore with protein digestion does not lead to increases in proteinuria under normal conditions. However, when proximal tubule cells are additionally stressed by cisplatin treatment this effect of cimetidine on endosomes results in tubular cell damage (as seen in our TUNEL labeling experiments) and failure in protein reabsorption (as seen by measurement of protein excretion). On the other hand, less cell damage due to cisplatin and reduced loss of transport function may occur as result of the competition at the transporter level, thereby resulting in a partial renal protection. Unlike in the cochlea, where comedication with another organic cation offers the first protective intervention, additional protection against renal toxicity can be obtained by parallel hydration of the patient during cisplatin treatment.
Furthermore, simple tubular concentration of cisplatin along the nephron may also lead to toxic effects especially in the distal nephron segments independent of OCT. Ctr1 expression at the mRNA level was much lower than that of OCT2 in the mouse cochlea, suggesting that in this organ OCT2 plays a pivotal role for cisplatin uptake.
Our data indicate that competition of the cisplatin uptake process with another OCT substrate can be effective in avoiding ototoxicity and reducing nephrotoxicity. However, to be applied as an accompanying protective clinical protocol of cisplatin antineoplastic therapy, the uptake of cisplatin by its target cells, the tumor cells, should not be compromised. Our analysis of mRNA expression of several cell lines originating from pediatric malignancies and one from the human acute myeloid leukemia cell line (HL-60) showed that no OCT isoform is expressed, while each of these cell lines expresses Ctr1. All these cell lines are sensitive to cisplatin toxicity (C. Lanvers-Kaminsky, unpublished results). However, since some samples from colorectal cancer express OCT1 and/or OCT2,32 care has to be taken when deciding if and for which type of cancer such a protective approach can be used. A detailed knowledge of transporters expressed in the different cancer types should be obtained in the future. The possibility that cimetidine protection from cisplatin toxicity is a consequence of a cisplatin inactivation following a direct reaction with cimetidine was already excluded by in vitro studies, which revealed no binding.32 In this study, we confirmed this by showing that in cells, which do not express hOCT2, the toxicity of cisplatin was not changed by coincubation with cimetidine.
It is well-known that different patients respond differently to the same medication, these differences being greater among members of a population than within the same person at different times or between monozygotic twins 33. This large variation of sensitivity to a drug in a population together with the small variability when considering repetitive treatments of the same patient is consistent with inheritance as a determinant of drug response.33 It has been estimated that genetics can account for 20 to 95 percentage of variability in drug disposition and effects.34 Because the activity of OCT is regulated by several different pathways,35 it can be hypothesized that polymorphisms of OCT or of their regulating proteins can influence the patients’ susceptibility to cisplatin therapy. In fact, in the time of revision of the present manuscript, a study confirming the role in vivo of OCT for the renal uptake of cisplatin and showing that the nonsynonymous single nucleotide polymorphism in the OCT2 gene SLC22A2 (rs316019) was associated with reduced cisplatin-induced nephrotoxicity in patients has been published.36 However, further studies are necessary to answer these questions in more detail.
In summary, in these in vivo studies, we discovered OCT2 as the common mediator of oto- and nephrotoxic effects of cisplatin. Furthermore, the feasibility of uptake competition at the transporter level as protective approach against cisplatin induced ototoxicity and in part also nephrotoxicity was demonstrated in vivo. Although nephroprotection is important for all patients treated with cisplatin, otoprotection is of special significance in children, because deafness severely hampers their psychosocial and language development.
Acknowledgements
We thank Julia Humberg, Bernadette Gelschefarth, Rita Schröter and Ute Neugebauer for the excellent technical assistance and Prof. Anthony W. Gummer (University of Tübingen, Tubingen, Germany) for the help with cochlea preparation.
Footnotes
Supported by the Deutsche Krebshilfe grant 108539 (to G.C., A.a.Z.-D., and H.J.) and the Deutsche Forschungsgemeinschaft grant SFB487/A4 (to H.K.).
Supplemental material for this article can be found on http://ajp.amjpathol.org.
Web Extra Material
References
- 1.Ramesh G, Reeves WB. TNF-α mediates chemokine and cytokine expression and renal injury in cisplatin nephrotoxicity. J Clin Invest. 2002;110:835–842. doi: 10.1172/JCI15606. [DOI] [PMC free article] [PubMed] [Google Scholar]
- 2.Rabik CA, Dolan ME. Molecular mechanisms of resistance and toxicity associated with platinating agents. Cancer Treat Rev. 2007;33:9–23. doi: 10.1016/j.ctrv.2006.09.006. [DOI] [PMC free article] [PubMed] [Google Scholar]
- 3.Pabla N, Dong Z. Cisplatin nephrotoxicity: mechanisms and renoprotective strategies. Kidney Int. 2008;73:994–1007. doi: 10.1038/sj.ki.5002786. [DOI] [PubMed] [Google Scholar]
- 4.Skinner R. Best practice in assessing ototoxicity in children with cancer. Eur J Cancer. 2004;40:2352–2354. doi: 10.1016/j.ejca.2004.08.002. [DOI] [PubMed] [Google Scholar]
- 5.Ramirez-Camacho R, Garcia-Berrocal JR, Trinidad A, Verdaguer JM, Nevado J. Blebs in inner and outer hair cells: a pathophysiological hypothesis. J Laryngol Otol. 2008;122:1151–1155. doi: 10.1017/S002221510700134X. [DOI] [PubMed] [Google Scholar]
- 6.Larson CA, Blair BG, Safaei R, Howell SB. The role of the mammalian copper transporter 1 in the cellular accumulation of platinum-based drugs. Mol Pharmacol. 2009;75:324–330. doi: 10.1124/mol.108.052381. [DOI] [PMC free article] [PubMed] [Google Scholar]
- 7.Pabla N, Murphy RF, Liu K, Dong Z. The copper transporter Ctr1 contributes to cisplatin uptake by renal tubular cells during cisplatin nephrotoxicity. Am J Physiol Renal Physiol. 2009;296:F505–F511. doi: 10.1152/ajprenal.90545.2008. [DOI] [PMC free article] [PubMed] [Google Scholar]
- 8.Ciarimboli G, Ludwig T, Lang D, Pavenstadt H, Koepsell H, Piechota HJ, Haier J, Jaehde U, Zisowsky J, Schlatter E. Cisplatin nephrotoxicity is critically mediated via the human organic cation transporter 2. Am J Pathol. 2005;167:1477–1484. doi: 10.1016/S0002-9440(10)61234-5. [DOI] [PMC free article] [PubMed] [Google Scholar]
- 9.Yonezawa A, Masuda S, Nishihara K, Yano I, Katsura T, Inui K. Association between tubular toxicity of cisplatin and expression of organic cation transporter rOCT2 (Slc22a2) in the rat. Biochem Pharmacol. 2005;70:1823–1831. doi: 10.1016/j.bcp.2005.09.020. [DOI] [PubMed] [Google Scholar]
- 10.Motohashi H, Sakurai Y, Saito H, Masuda S, Urakami Y, Goto M, Fukatsu A, Ogawa O, Inui KK. Gene expression levels and immunolocalization of organic ion transporters in the human kidney. J Am Soc Nephrol. 2002;13:866–874. doi: 10.1681/ASN.V134866. [DOI] [PubMed] [Google Scholar]
- 11.Koepsell H, Endou H. The SLC22 drug transporter family. Pflugers Arch. 2004;447:666–676. doi: 10.1007/s00424-003-1089-9. [DOI] [PubMed] [Google Scholar]
- 12.Koepsell H, Schmitt BM, Gorboulev V. Organic cation transporters. Rev Physiol Biochem Pharmacol. 2003;150:36–90. doi: 10.1007/s10254-003-0017-x. [DOI] [PubMed] [Google Scholar]
- 13.Jonker JW, Wagenaar E, Van Eijl S, Schinkel AH. Deficiency in the organic cation transporters 1 and 2 (Oct1/Oct2 [Slc22a1/Slc22a2]) in mice abolishes renal secretion of organic cations. Mol Cell Biol. 2003;23:7902–7908. doi: 10.1128/MCB.23.21.7902-7908.2003. [DOI] [PMC free article] [PubMed] [Google Scholar]
- 14.Hardie NA, MacDonald G, Rubel EW. A new method for imaging and 3D reconstruction of mammalian cochlea by fluorescent confocal microscopy. Brain Res. 2004;1000:200–210. doi: 10.1016/j.brainres.2003.10.071. [DOI] [PubMed] [Google Scholar]
- 15.Lee WK, Reichold M, Edemir B, Ciarimboli G, Warth R, Koepsell H, Thévenod F. The organic cation transporters OCT1, 2, and 3 mediate high affinity transport of the mutagenic vital dye ethidium in the kidney proximal tubule. Am J Physiol Renal Physiol. 2009;296:F1504–F1513. doi: 10.1152/ajprenal.90754.2008. [DOI] [PubMed] [Google Scholar]
- 16.Mosmann T. Rapid colorimetric assay for cellular growth and survival: application to proliferation and cytotoxicity assays. J Immunol Methods. 1983;65:55–63. doi: 10.1016/0022-1759(83)90303-4. [DOI] [PubMed] [Google Scholar]
- 17.Tada H, Shiho O, Kuroshima K, Koyama M, Tsukamoto K. An improved colorimetric assay for interleukin 2. J Immunol Methods. 1986;93:157–165. doi: 10.1016/0022-1759(86)90183-3. [DOI] [PubMed] [Google Scholar]
- 18.Livak KJ, Schmittgen TD. Analysis of relative gene expression data using real-time quantitative PCR and the 2−ΔΔC(T) method. Methods. 2001;25:402–408. doi: 10.1006/meth.2001.1262. [DOI] [PubMed] [Google Scholar]
- 19.Hughes J, Gobe G. Identification and quantification of apoptosis in the kidney using morphology, biochemical and molecular markers. Nephrology. 2007;12:452–458. doi: 10.1111/j.1440-1797.2007.00854.x. [DOI] [PubMed] [Google Scholar]
- 20.Alnouti Y, Petrick JS, Klaassen CD. Tissue distribution and ontogeny of organic cation transporters in mice. Drug Metab Dispos. 2006;34:477–482. doi: 10.1124/dmd.105.006932. [DOI] [PubMed] [Google Scholar]
- 21.Kuo YM, Gybina AA, Pyatskowit JW, Gitschier J, Prohaska JR. Copper transport protein (Ctr1) levels in mice are tissue specific and dependent on copper status. J Nutr. 2006;136:21–26. doi: 10.1093/jn/136.1.21. [DOI] [PMC free article] [PubMed] [Google Scholar]
- 22.Yokoo S, Yonezawa A, Masuda S, Fukatsu A, Katsura T, Inui K. Differential contribution of organic cation transporters, OCT2 and MATE1, in platinum agent-induced nephrotoxicity. Biochem Pharmacol. 2007;74:477–487. doi: 10.1016/j.bcp.2007.03.004. [DOI] [PubMed] [Google Scholar]
- 23.Ludwig T, Riethmuller C, Gekle M, Schwerdt G, Oberleithner H. Nephrotoxicity of platinum complexes is related to basolateral organic cation transport. Kidney Int. 2004;66:196–202. doi: 10.1111/j.1523-1755.2004.00720.x. [DOI] [PubMed] [Google Scholar]
- 24.Wang D, Lippard SJ. Cellular processing of platinum anticancer drugs. Nat Rev Drug Discov. 2005;4:307–320. doi: 10.1038/nrd1691. [DOI] [PubMed] [Google Scholar]
- 25.Yonezawa A, Masuda S, Yokoo S, Katsura T, Inui K. Cisplatin and oxaliplatin, but not carboplatin and nedaplatin, are substrates for human organic cation transporters (SLC22A1–3 and multidrug and toxin extrusion family) J Pharmacol Exp Ther. 2006;319:879–886. doi: 10.1124/jpet.106.110346. [DOI] [PubMed] [Google Scholar]
- 26.Safaei R, Howell SB. Copper transporters regulate the cellular pharmacology and sensitivity to Pt drugs. Crit Rev Oncol Hematol. 2005;53:13–23. doi: 10.1016/j.critrevonc.2004.09.007. [DOI] [PubMed] [Google Scholar]
- 27.Kim SW, Lee JU, Nah MY, Kang DG, Ahn KY, Lee HS, Choi KC. Cisplatin decreases the abundance of aquaporin water channels in rat kidney. J Am Soc Nephrol. 2001;12:875–882. doi: 10.1681/ASN.V125875. [DOI] [PubMed] [Google Scholar]
- 28.Pasic TR, Dobie RA. Cisplatinum ototoxicity in children. Laryngoscope. 1991;101:985–991. doi: 10.1288/00005537-199109000-00001. [DOI] [PubMed] [Google Scholar]
- 29.Sha SH, Taylor R, Forge A, Schacht J. Differential vulnerability of basal and apical hair cells is based on intrinsic susceptibility to free radicals. Hear Res. 2001;155:1–8. doi: 10.1016/s0378-5955(01)00224-6. [DOI] [PubMed] [Google Scholar]
- 30.Turner JR, Black ED, Ward J, Tse CM, Uchwat FA, Alli HA, Donowitz M, Madara JL, Angle JM. Transepithelial resistance can be regulated by the intestinal brush-border Na+/H+ exchanger NHE3. Am J Physiol Cell Physiol. 2000;279:C1918–C1924. doi: 10.1152/ajpcell.2000.279.6.C1918. [DOI] [PubMed] [Google Scholar]
- 31.Gekle M, Volker K, Mildenberger S, Freudinger R, Shull GE, Wiemann M. NHE3 Na+/H+ exchanger supports proximal tubular protein reabsorption in vivo. Am J Physiol Renal Physiol. 2004;287:F469–F473. doi: 10.1152/ajprenal.00059.2004. [DOI] [PubMed] [Google Scholar]
- 32.Zhang S, Lovejoy KS, Shima JE, Lagpacan LL, Shu Y, Lapuk A, Chen Y, Komori T, Gray JW, Chen X, Lippard SJ, Giacomini KM. Organic cation transporters are determinants of oxaliplatin cytotoxicity. Cancer Res. 2006;66:8847–8857. doi: 10.1158/0008-5472.CAN-06-0769. [DOI] [PMC free article] [PubMed] [Google Scholar]
- 33.Kerb R. Implications of genetic polymorphisms in drug transporters for pharmacotherapy. Cancer Lett. 2006;234:4–33. doi: 10.1016/j.canlet.2005.06.051. [DOI] [PubMed] [Google Scholar]
- 34.Kalow W, Endrenyi L, Tang B. Repeat administration of drugs as a means to assess the genetic component in pharmacological variability. Pharmacology. 1999;58:281–284. doi: 10.1159/000028292. [DOI] [PubMed] [Google Scholar]
- 35.Ciarimboli G. Organic cation transporters. Xenobiotica. 2008;38:936–971. doi: 10.1080/00498250701882482. [DOI] [PubMed] [Google Scholar]
- 36.Filipski KK, Mathijssen RH, Mikkelsen TS, Schinkel AH, Sparreboom A. Contribution of organic cation transporter 2 (OCT2) to cisplatin-induced nephrotoxicity. Clin Pharmacol Ther. 2009;86:396–402. doi: 10.1038/clpt.2009.139. [DOI] [PMC free article] [PubMed] [Google Scholar]
Associated Data
This section collects any data citations, data availability statements, or supplementary materials included in this article.