

Abstract
Many serine hydrolases catalyze perhydrolysis – the reversible formation of per-acids from carboxylic acids and hydrogen peroxide. Recently we showed that a single amino acid substitution in the alcohol binding pocket - L29P - in Pseudomonas fluorescens (SIK WI) aryl esterase (PFE) increased the specificity constant of PFE for peracetic acid formation >100-fold [Bernhardt et al. Angew. Chem. Intl. Ed. 2005, 44, 2742]. In this paper, we extend this work to address the three following questions. First, what is the molecular basis of the increase in perhydrolysis activity? We previously proposed that the L29P substitution creates a hydrogen bond between the enzyme and hydrogen peroxide in the transition state. Here we report two x-ray structures of L29P PFE that support this proposal. Both structures show a main chain carbonyl oxygen closer to the active-site serine as expected. One structure further shows acetate in the active site in an orientation consistent with reaction by an acyl-enzyme mechanism. We also detected an acyl-enzyme intermediate in the hydrolysis of ε-caprolactone by mass spectrometry. Second, can we further increase perhydrolysis activity? We discovered that the reverse reaction – hydrolysis of peracetic acid to acetic acid and hydrogen peroxide – occurs at nearly the diffusion limited rate. Since the reverse reaction cannot increase further, neither can the forward reaction. Consistent with this prediction, two variants with additional amino acid substitutions showed two fold higher kcat, but Km also increased so the specificity constant, kcat/Km, remained similar. Third, how does the L29P substitution change the esterase activity? Ester hydrolysis decreased for most esters (75-fold for ethyl acetate), but not for methyl esters. In contrast, L29P PFE catalyzed hydrolysis of ε-caprolactone five times more efficiently than wild-type PFE. Molecular modeling suggests that moving the carbonyl group closer to the active site blocks access for larger alcohol moieties, but binds ε-caprolactone more tightly. These results are consistent with the natural function of perhydrolases being either hydrolysis of peroxycarboxylic acids or hydrolysis of lactones.
Many serine hydrolases catalyze perhydrolysis – the reversible formation of peroxycarboxylic acids from carboxylic acids and hydrogen peroxide (1-3). Enhancing this reactivity could offer new catalysts for organic synthesis and industry. Peracids can introduce oxygen into olefins, cyclic ketones, amines, and organic sulfur compounds, making them essential oxidants for organic synthesis (4, 5). Industry uses peracids for disinfecting, waste water treatment, de-staining of fabrics, pulp bleaching, and removal of lignin from biomass. Unfortunately, concentrated peracids are explosive and corrosive, but the in situ generation of dilute peracids minimizes these hazards. Chemical in situ generation of peracids often involves two steps or harsh reaction conditions or hazardous catalysts, or a combination thereof (5). Enzyme-catalyzed reactions are an environmentally friendly alternative that avoid harsh reaction conditions and hazardous catalysts.
Perhydrolases are a subgroup of serine hydrolases that are particularly efficient at catalyzing perhydrolysis. Perhydrolases have an α/β-hydrolase fold (6) and use a Ser-His-Asp catalytic triad (7-9). Perhydrolysis likely takes place with a ping-pong bi-bi mechanism (9, 10), Figure 1A. The catalytic serine attacks the carbonyl carbon of a carboxylic acid and displaces water to form an acyl-enzyme intermediate. Next, hydrogen peroxide reacts with this acyl enzyme to form the peracid product and to regenerate the catalyst. Hydrogen bonds from two main-chain amides, called the oxyanion hole, activate the carbonyl group for attack and stabilize the tetrahedral intermediate.
Figure 1.

Proposed mechanisms for perhydrolysis of acetic acid. The numbering corresponds to the active site of PFE. a) The ping-pong bi-bi mechanism involves an acetyl-enzyme intermediate. The first diagram shows the enzyme-acetic acid complex. The γ-hydroxyl group of active site serine 94 is a nucleophile that attacks the carbonyl group of acetic acid to form a tetrahedral intermediate (not shown) via the black curved arrows. Next, this tetrahedral intermediate collapses via the release of water (gray curved arrows) to form an acetyl-enzyme intermediate. Finally hydrogen peroxide binds to yield the complex shown in the second diagram. The N–H's of M95 and W28, called the oxyanion hole, donate hydrogen bonds to the carbonyl oxygen. Nucleophilic attack of hydrogen peroxide on the acyl enzyme forms a second tetrahedral intermediate. In wild-type PFE, the carbonyl oxygen of W28 is too far from the hydrogen peroxide to form a hydrogen bond. The L29P substitution moves this carbonyl 0.5 Å closer to the catalytic serine side-chain allowing a hydrogen bond to form and stabilize the tetrahedral intermediate. b) The ordered bi-bi noncovalent mechanism proposed by Bugg (11) does not form an acyl-enzyme intermediate. Both acetic acid and hydrogen peroxide bind the enzyme simultaneously. In this mechanism, acetic acid does not bind to the oxyanion hole, but the γ-hydroxyl group of active site S94 and N–H of W28 donate a hydrogen bond to the carbonyl oxygen of acetic acid. Hydrogen peroxide attacks the bound acetic acid to form a tetrahedral intermediate without covalent links to the enzyme.
Some reactions catalyzed by α/β-hydrolases do not involve a covalent acyl-enzyme intermediate (11). For example, hydroxynitrile lyases catalyze the direct attack of cyanide on the aldehyde to form a cyanohydrin (12). Bugg proposed that perhydrolysis could also occur by direct attack by hydrogen peroxide on acetic acid without the formation of an acetyl-enzyme intermediate (11), Figure 1B. Support for this mechanism was an x-ray crystal structure of propionate bound to the active site of a perhydrolase in the orientation suggested in Figure 1B.
Pseudomonas fluorescens esterase (PFE) is a hydrolase, but its amino acid sequence most closely resembles perhydrolases. The amino acid sequence of PFE is 54% identical and 69% similar to that for a perhydrolase from P. fluorescens (CPO-F). However, CPO-F is a good perhydrolase (kcat = 1.9 s-1), while PFE is a poor one (kcat = 0.12 s-1). The x-ray structures of the active sites showed subtle differences, but it was unclear which ones were responsible for the different catalytic activities (9). Recently, we reported a single amino acid substitution, L29P in PFE that increased the perhydrolase activity 28-fold to 3.5 s-1 (13), which is higher than that for CPO-F (14). We attributed the increased catalytic efficiency to a new hydrogen bond between a carbonyl oxygen of W28 and the peroxy group of the second tetrahedral intermediate (C=O…O distance 2.7 Å) using molecular modeling, Figure 1A. The wild-type enzyme could not form this hydrogen bond because the carbonyl group was 0.5 Å further away from the active site (C=O…O distance 3.2 Å). In this paper we confirm the structure of the L29P variant by crystallography and the ping-pong bi-bi mechanism for this enzyme by characterization of an enzyme-acetate complex by x-ray crystallography and by detection of an acyl-enzyme intermediate by mass spectrometry. Further kinetic characterization of the L29P PFE shows that it is as nearly efficient for perhydrolysis as physically possible because it catalyzes the reverse reaction – hydrolysis of peracetic acid – at a nearly diffusion controlled rate. The L29P substitution also decreases the efficiency of ester hydrolysis, but increases the efficiency of lactone hydrolysis.
Materials and Methods
General
Water was 18-ohm purity using Milli-Q Water System (Millipore, Billerica, MA). All chemicals including acetic acid, hydrogen peroxide and peracetic acid were bought from Sigma Aldrich. Specific activity measurements were done using Costar 3635 96-well plates (Corning, Lowell, MA) and read using SpectraMax plus-384 plate reader (Molecular Devices, Sunnyvale, CA). Kinetic constants were determined by measuring the specific activity as a function of change in substrate concentration. Data was fit to the Michaelis-Menten equation: rate = Vmax * [S] / (Km + [S]) using software from either OriginPro 7.5 (Origin Lab, Northampton, MA) or Kaleidagraph 4 (Synergy Software, Reading, PA). R2 values were >0.97 for both mutants and wild-type PFE.
Mutagenesis
Plasmid pJOE2792 (13), which is an E. coli expression vector, has the PFE gene from P. fluorescens SIK WI inserted as an NdeI/BamHI fragment. Expression is regulated by a rhamnose-inducible promoter. Previously, the L29P variant of PFE was made using polymerase chain reaction (PCR)-based site-directed mutagenesis (13). In this paper, the plasmid containing the L29P PFE plasmid (pL29P) was used as the template for the new mutants. Mutagenic primers, Table 1, were designed using PrimerX (http://bioinformatics.org/primerx/) and synthesized by Integrated DNA Technologies (IDT, Coralville, IA). A typical PCR reaction (50 μL) for mutagenesis, using Pfu Turbo polymerase kit (Stratagene, La Jolla, CA), was performed by initially heating the mixture of pL29P, dNTPs, primers, and 1× buffer to 95 °C for 30 s, followed by 16 cycles of 95 °C for 30 s, 55 °C for 1 min and 68 °C for 5 min 30. The amplified PCR product was treated with DpnI (1 U for 1 h at 37 °C), an endonuclease that cleaves template DNA, which is methylated, but not the amplified product DNA. Next, the PCR product was transformed into E. coli DH5α–T1 competent cells (Invitrogen) by the heat-shock method. Transformed cells were plated on LB (Luria-Bertani broth)-agar containing ampicillin (0.1 mg/mL) and grown for 17 h at 37 °C. Individual colonies were picked and inoculated into 15-mL sterile tubes containing LB (5 mL with 0.1 mg/mL ampicillin) and grown for 17 h at 37 °C. Plasmids were isolated from the 17-h culture using a plasmid mini-prep kit (Qiagen, Valencia, CA). The mutations were confirmed DNA sequencing using sequencing primers in both the forward (64 bp upstream from the start codon, ATG) and reverse (15 bp downstream from the stop codon, TGA) by the Biomedical Genomics Center (U. of Minnesota) using ABI BigDye Terminator version 3.1 chemistry. The 17-h grown culture of E. coli were mixed with glycerol (20% v/v), then frozen at −80 °C for long-term storage.
Table 1.
Nucleotide sequences of primers for mutagenesis and sequencing of pL29Pa
| Primer name | 5′ to 3′ forward sequence | 5′ to 3′ reverse sequence |
|---|---|---|
| sequencing primers | CGA-GAAGGTCGCGAATTC | CTCTCATCCGCCAAAACA |
| L29P/F93H | AAG-GAGGTGACCCTGGTGGGCCATTCCATGGGCGGC | GCCGCCCATGGAATGGCCCAC-CAGGGTCACCTCCTT |
| L29P/F57H | ACCGCCGCGGCCATGGCCGCTCGG | CCGAGCGGCCATGGCCGCGGCGGT |
aMutation sites in the primers are marked in bold.
Protein expression and purification
Typically, LB media (5 mL containing 0.1 mg/mL ampicillin) was inoculated with a single colony, then grown overnight at 37 °C. The overnight grown culture was diluted (1:100) with fresh LB media (100 mL containing 0.1 mg/mL ampicillin) and grown at 37 °C until the absorbance at 600 nm reached 0.6. Filter-sterilized rhamnose (20% w/v) was added to a concentration of 2% (w/v) to induce protein expression and the culture was incubated for an additional 3 h at 37 °C. The induced culture was centrifuged (4,000 × g, 15 min) and the cell paste was resuspended in buffer A (50 mM NaH2PO4, 300 mM NaCl, 10 mM imidazole) to a concentration of 20% (w/v). The resuspended culture was flash frozen in liquid nitrogen, thawed to room temperature, lysozyme added (final concentration of 1 mg/mL) and incubated on ice for 30 min. The cell lysate was centrifuged (10,000 × g, 60 min) and the supernatant was poured onto a column of Ni-NTA agarose resin (5 mL, Invitrogen) pre-equilibrated with buffer A (25 mL). The column was washed with buffer B (50 mL, 50 mM NaH2PO4, 300 mM NaCl, 20 mM imidazole) and the protein was eluted with buffer C (10 mL, 50 mM NaH2PO4, 300 mM NaCl, 250 mM imidazole). Typical yield was 10-15 mg protein or 100-150 mg/L of culture broth. Protein concentrations were measured by absorbance at 280 nm using the calculated extinction coefficient of PFE (35,410 M-1 cm-1) (15).
Detection of acyl-enzyme intermediate by ESI mass spectrometry
A solution of ε-caprolactone substrate (100 mM in 2 mM citrate buffer, pH 5.5, 10 μL) was mixed with enzyme PFE-L29P (9 mg/mL, 10 μL) at 4 °C. Water: acetonitrile (50:50 with 0.1% formic acid, 20 μL) was added immediately, the sample was loaded in a 50-μL syringe and injected into a 10-μL loop. Addition of formic acid did not significantly alter the pH (pH paper). The reaction likely occurred in the syringe as the solution warmed to room temperature, 23 °C. Electrospray ionization (ESI) mass spectrometry was analyzed using Qstar Pulsar (Applied Biosystems, Foster City, CA) using a Turbo Ionspray as the nebulizer. Bayesian protein reconstruction was used to deconvolute the multiply charged spectra (see Figure S-1 in the supporting information) to yield the spectra shown in Figure 3.
Figure 3.

Deconvoluted electrospray-ionization spectra show an acyl-enzyme intermediate during the PFE-L29P-catalyzed hydrolysis of ε-caprolactone in citrate/formate buffer pH ∼5.5. Without substrate shows the major peak at 30,912 Da, which is consistent with the calculated value of 30,911.9 Da using ProtParam (15). Addition of 25 mM ε-caprolactone shows an additional peak at 31,026 Da, which is 114 Da higher that the free enzyme. This peak is assigned as the covalent acyl-enzyme intermediate. Peaks at lower mass are present in both spectra and are not identified.
Steady-state kinetic constants for perhydrolysis of acetic acid
Kinetic constants for perhydrolysis were determined using the monochlorodimedone (MCD) assay (16), where the amount of enzyme added was adjusted to give a linear dependence of the reaction rate to enzyme concentration at 23 °C. All reactions contained MCD (0.047 mM) and sodium bromide (149 mM). The concentrations of hydrogen peroxide and acetate were varied to give evenly spaced data points on both sides of apparent Km, solubility limited acetate concentrations to <1.5 M, and enzyme stability limited hydrogen peroxide concentrations to <150 mM. When varying the concentration of hydrogen peroxide, the concentration of acetate was 1.00 M, when varying the concentration of acetate, the concentration of hydrogen peroxide was 9.9 mM. Some of the kinetic constants in this paper differ slightly from those in the preliminary communication (13). The current values are believed to be accurate, but we do not clearly understand why they differ.
pH activity profiles for perhydrolysis of acetic acid
The initial rate of PFE-catalyzed perhydrolysis was measured with near saturating amount of acetate (1.00 M) and hydrogen peroxide (9.9 mM) while varying the pH with either NaOH (1.00 N) or HCl (1.00 N) at 23 °C. Acetic acid served as both a substrate and buffer, which was adjusted to the desired pH immediately before the reaction was initiated with enzyme. The amount of enzyme used varied from 0.050 to 5 μg depending on the mutant being tested and the pH. The data were fit to the equation for a doubly ionizing system using the Solver function of Microsoft Excel. The equation used is: rate = C[H+]K1/(K1K2 + [H+]K1 + [H+]2), where K1 is the first acid ionization constant and K2 is the second acid ionization constant (17). C is an arbitrary constant. This equation assumes that only the singly ionized form contributes to catalysis.
Steady-state kinetic constants for hydrolysis of peracetic acid
Initial rates of peracetic acid hydrolysis were measured using a pHstat at pH 5.5 at 23 °C. A typical assay (50 mL) contained peracetic acid (0.03 to 1 mM), enzyme (typically 3.2 μg for L29P PFE and 11.6 μg for wild-type PFE) constantly mixed with a magnetic stirring bar while monitoring the amount of NaOH (0.01 N) added. The pHstat could not detect hydrolysis below 0.03 mM peracetic acid. To account for the incomplete ionization of acetic acid at pH 5.5, the kcatapp value was increased according to the equation below, which was derived from the Hendersen-Hasselbach equation.
Steady state kinetics of L29P PFE-catalyzed hydrolysis of ε-caprolactone
Hydrolysis of ε-caprolactone was monitored colorimetrically by measuring acid release using p-nitrophenol as the pH indicator (18). Reactions were run at room temperature by mixing ε-caprolactone stock solution (19 μL in acetonitrile), 171 μL buffer (4.0 mM N, N-bis[2-hydroxyethyl]-2-aminoethanesulfonic acid (BES), pH 7.2, 0.50 mM p-nitrophenol, 0.33 mM Triton X-100) and 10 μL enzyme (in 4 mM BES buffer, pH 7.2). The hydrolysis rates were determined from the decrease in absorbance at 404 nm as a function of time. The extinction coefficient for p-nitrophenoxide is 16600 M-1 cm-1. The ratio of [BES]: [p-nitrophenol] is 8.47:1 so the protonation of one p-nitrophenol molecule indicated the release of 9.47 protons. Each reaction was run in triplicate and the average values were used for calculations. The formula for the rate calculation is
Steady-state kinetic constants for hydrolysis of methyl and ethyl acetate
Initial rates were measured using a pH indicator assay which monitors the decrease in absorption of p-nitrophenoxide upon protonation to the phenol (pNP) (ε404 = 16.6 × 10³ M-1 cm-1) at pH = 7.2 (18) at 23 °C. To stabilize the pH, the assay mixture contained a small amount of buffer (5 mM N, N-bis(2-hydroxyethyl)-2-aminoethanesulfonic acid (BES), so the initial rates were adjusted to include the protons that were buffered by BES: vtrue = vobs.*(1 + 5 mM BES)/(0.81 mM pNP). A typical reaction mixture contained 50 to 500 mM of either methyl or ethyl acetate with 0.81 mM pNP, 5 mM BES and 0.050 to 5 μg enzyme.
Crystallization, data collection and structure determination of L29P PFE
Initial crystallization screens were performed using the hanging-drop vapor-diffusion method in a 24-well plate. The precipitant solutions ranged in pH from 5.0-7.5 and contained between 1 and 2 M (NH4)2SO4 and 0-2% polyethylene glycol. Drops contained 3 μL protein solution (10 mg/mL) and 5 μL precipitant solution. The best crystallization conditions were 1.7 M (NH4)2SO4, 0.1 M NaKH2PO4 pH 7.5, which are similar to the best ones for wild-type PFE (19). Crystals were flash-frozen to 93 K after brief immersion in a cryoprotectant solution consisting of precipitant solution with glycerol (25% v/v) added. Data for L29P PFE was collected at beam line ×29 at the National Synchrotron Light Source, Brookhaven National Laboratory (Upton, NY) using an ADSC (San Diego, CA) Quantum-315 CCD detector. Data were reduced using d*TREK (20).Crystals of the L29P PFE were isomorphous with crystals from wild-type PFE (PDB ID: 1VA4). Models of the mutant protein were generated from wild-type PFE using the software O (21). Refinements were performed using Refmac version 5 of the CCP4 Suite of crystallographic programs (1994) (22), summarized in Table 2. Rigid body refinements allowing each of the six polypeptide chains in the asymmetric unit to move independently were followed by restrained maximum likelihood refinement. Medium or loose NCS restraints were used throughout the refinement. Water molecules were placed using ARP/WARP (23). Final fitting of the models was done in O using SigmaA weighted 2Fo-Fc maps (24) The structures were validated using PROCHECK (25). The L29P PFE protein crystallized as a dimer of trimers and had no significant deviation from the main-chain conformation of the wild-type protein, except at the oxyanion loop close to the active site. Each monomer of the asymmetric unit contained a continuous density from the S94 side chain, which could not be unambiguously identified as glycerol, water or buffer. Our best guess was a tetrahedral intermediate for hydrolysis of ethyl acetate, which is a poor substrate for L29P PFE. Ethyl acetate was not present in the crystallization buffer, so this assignment is speculative and this adduct in not shown in Figure 2. The refined structure of L29P PFE was deposited in RCSB Protein Data Bank (www.rcsb.org), PDB ID: 3hea. X-ray structures of wild type and L29P and of CPO-F with L29P PFE were superimposed using the software Chimera (26) or Pymol (27).
Table 2.
Data-collection and refinement statistics for L29P PFE, and L29P PFE with acetate.
| L29P PFE (3hea) | L29P PFE/acetate (3hi4) | |
|---|---|---|
| Data Collection | ||
| Space Group | P32 | P32 |
| Unit-cell parameters | ||
| a = b (Å) | 145.59 | 145.49 |
| c (Å) | 128.20 | 129.99 |
| α = β (°) | 90 | 90 |
| γ (°) | 120 | 120 |
| No. reflections | ||
| Observed | 604510 | 228713 |
| Unique | 231042 | 138751 |
| Rsym (%) | ||
| Overall | 5.6 | 7.9 |
| Highest Shell | 31.3 (1.99-1.9 Å) | 26.5 (2.29-2.25 Å) |
| Completeness (%) | ||
| Overall | 96.5 (93.5) | 99.6(98.8) |
| I/σ (I) | ||
| Overall | 10.5 (3.0) | 12.3 (2.15) |
| Refinement | ||
| Resolution range (Å) | 48.11-1.90 | 39.97-2.25 |
| Rwork (highest shell) (%) | 19.0 (28.9) | 16.6 (26.5) |
| Rfree (highest shell) (%) | 21.2 (30.8) | 20.3 (30.7) |
| R.m.s deviations from ideality | ||
| Bond lengths (Å) | 0.006 | 0.03 |
| Bond angles (°) | 0.930 | 1.97 |
| Ramachandran analysis | ||
| Most favored (%) | 91.3 | 97.03 |
| Allowed (%) | 8.3 | 2.57 |
| Generously Allowed (%) | 0.4 | 0.4 |
| Disallowed (%) | 0.0 | |
| Final model | ||
| No. of atoms | ||
| Protein | 12924 | 12802 |
| Solvent (H2O and glycerol) | 1271 | 1192 |
| Mean B factor (Å2) | ||
| Main chain | 22.25 | 27.96 |
| Side chain | 23.21 | 29.59 |
| Solvent | 31.68 | 35.69 |
Figure 2.
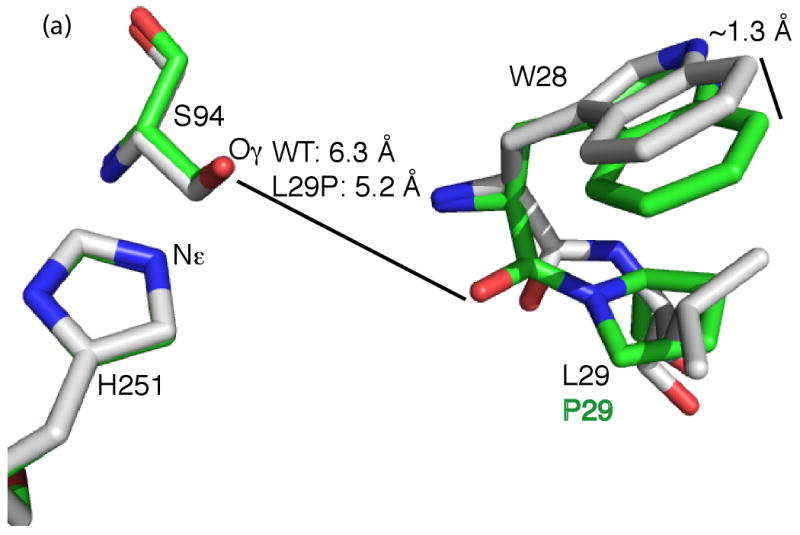


Active site x-ray crystal structures of L29P PFE and L29P PFE/acetate. A) Superposition of L29P PFE (green CPK colors, PDB ID: 3hea) and wild-type PFE (white CPK colors, PDB ID: 1va4) show similar conformations of the catalytic triad residues. (Only H251 and S94 are shown.) The leucine 29 to proline substitution changes the W28 to L29 peptide bond conformation from trans to cis thereby shifting the main chain carbonyl group of W28 closer to the active site serine by 1.1 Å. A second difference is a shift in the indole ring of the W28 residue by ∼1.3 Å for the 7 position. B) Superposition of the structures of L29P PFE/acetate (green CPK colors, PDB ID: 3hi4) and perhydrolase CPO-F soaked with propionate (magenta CPK colors, PDB ID: 1a8s). Both show a similar orientations of the W28 carbonyl group and indole ring, but the acetate, propanoate and active site water molecules (WAT1, orange for L29P, magenta for CPO-F) have different orientations. C) L29P PFE/acetate (PDB ID: 3hi4) shows the substrate acetate in an orientation consistent with formation of an acetyl-enzyme intermediate. The acetate carbonyl oxygen accept hydrogen bonds from the two amide N-H's that form the oxyanion hole (M95, W28). The carbonyl carbon of acetate is 2.8 Å from S94-Oγ in this monomer and ranges from 2.8 to 3.1 Å in the six monomers in the asymmetric unit.
Crystallization, data collection and structure determination of L29P PFE/acetate
Crystals of L29P were immersed in mother liquor solution containing glycerol (25% v/v) for 1 min, then transferred to a drop (10 μL) containing mother liquor solution with glycerol (25% v/v) and 250 mM acetate at pH 5.0 (“soak solution”) for 30 s. The crystal was then transferred 2 more times into fresh soak solutions for a total soak time of 90 s, then the soaked crystals were quickly flash-frozen to 77 K. Data for L29P PFE was collected at The Kahlert Structural Biology Laboratory of the University of Minnesota using Rigaku MSC Micromax 007 X-ray generators with R-axis IV++ image plates. Data was collected using Crystal Clear.Crystals of the L29P PFE were isomorphous with crystals from wild-type PFE (PDB ID: 1VA4). The structure was solved by molecular replacement using MOLREP (28) in the CCP4 Suite of crystallographic programs (1994). Models of the mutant protein were generated from wild-type PFE using the software Coot (29). Refinements were performed using Refmac version 5 of the CCP4 Suite of crystallographic programs (1994) (22), summarized in Table 2. Rigid body refinements allowing each of the six polypeptide chains in the asymmetric unit to move independently were followed by restrained maximum likelihood refinement. Medium or loose NCS restraints were used throughout the refinement. Water molecules were placed using ARP/WARP (23) from CCP4 and Find Waters/Solvate in Coot. Final fitting of the models was done in Coot using SigmaA weighted 2Fo-Fc maps. The structures were validated using PROCHECK (25) and Molprobity (30). The L29P PFE soaked with acetate shows a single acetate molecule in the active site. In addition, the cis-Pro 29 bond adopts the same orientation as in L29P PFE. The structure has been deposited in the RSCB Protein Data Bank (www.rcsb.org) as structure 3hi4.
Molecular modeling
Modeling and visualization of wild type and L29P PFE were done using Maestro (Schrödinger, Portland, Oregon) at the Minnesota Supercomputing Institute (U. of Minnesota). Macromodel using OPLS-2005 (31) force field and the conjugate gradient algorithm were used to optimize the geometry of all structures until the root mean square deviation was ≤ 0.05 Å. First, hydrogens were added to the backbone and side chains of a single subunit of either L29P PFE or wild-type PFE. The ε nitrogen of the catalytic histidine, His251 was protonated for modeling of the first tetrahedral intermediate. The geometry of the hydrogens attached to the subunit were optimized to minimize the energy of the whole structure. Next, the first tetrahedral intermediate for either methyl, ethyl acetate, or ε-caprolactone was built on the catalytic serine 94, and its geometry was optimized. Finally, the geometry of the entire structure and intermediate was optimized.
Docking ε-caprolactone into PFE using GLIDE
Structures of PFE wild type and L29P PFE were prepared using Protein Wizard Prep in Maestro, which added missing hydrogen atoms and optimized bond angles and distances. Separately, the structure of ε-caprolactone was prepared and optimized using OPLS-2005. The ε-caprolactone was positioned in the active site such that the carbonyl oxygen of the substrate was within hydrogen bond distance (2.5 Å to 3.0 Å) of αN of M95 and W28 while the carbonyl carbon is positioned ∼1.5 Å from S94 Oγ. The outer boundary box was set to 20 Å, which covers >95% of the protein, while the inner boundary box (ε-caprolactone) was set to a maximum of 14 × 14 × 14 Å. A standard precision model was used to generate all poses.
Results
Previously, we used computer modeling to predict the structure of the L29P PFE variant. The predicted structure indicated a change from a trans orientation along the peptide bond for the wild-type protein (L29) to a cis conformation in the variant due to the introduction of proline at position 29. This change in the peptide bond orientation moved the protein main chain, and in particular the carbonyl oxygen of W28 closer to the active site. Now we solved an x-ray crystal structure that confirms the predicted structure. In addition, we solved a crystal structure of L29P PFE with substrate acetate bound to the active site to gain further insight into the mechanism.
Crystal structures of L29P PFE
Two crystal structures of L29P PFE variants both show a similar orientation of the proline at position 29, Figure 2. L29P PFE (PDB ID: 3hea) shows the apo enzyme, while L29P PFE/acetate (PDB ID: 3hi4) was soaked in acetate and contains a single acetate in the active site. Both forms of L29P crystallized under similar conditions as wild type and were refined using the P32 space group with six near-identical monomers comprising the dimer of trimers. Molecular replacement with the wild-type structure solved both structure and allowed the refinement of the model to a final resolution of 1.90 Å for L29P and 2.25 Å for L29P/acetate. Table 2 in the Materials and Methods section summarizes the statistics for both data sets and the final refinement. The L29P structure contained additional electron density in the active site which could not be identified as glycerol, buffer or water.
The L29P PFE structure superimposed onto the wild-type structure (PDB ID: 1VA4 (19)) with an RMSDall-atom of 0.16 Å for the best monomer fit (chain A of L29P PFE and chain A of WT PFE), Figure 2A. The largest difference with an RMSDbackbone of 0.64 Å is in the oxyanion-stabilizing loop containing residues 27-30 between β-strand 1 and α-helix 1. In contrast to the wild-type W28-L29 trans peptide bond, the mutant W28-P29 peptide bond adopts a cis conformation, Figure 2A. This conformational change directs the carbonyl oxygen of the W28 peptide bond towards the catalytic serine residue (W28-C=O…S94-Oγ distances: 6.3 Å and 5.2 Å for wild-type PFE and L29P PFE, respectively). Another, less significant, change was a shift in the indole ring of W28 side-chain. The 7-position of the indole ring is shifted by 1.3 Å as compared to the wild-type enzyme. The structure of L29P PFE/acetate shows the same cis conformation of the W28-P29 peptide bond and the protein conformation is otherwise also similar to L29P PFE.
These changes in the active site make L29P PFE similar to a naturally occurring perhydrolase (CPO-F, the perhydrolase from P. fluorescens). Superposition of the x-ray crystal structure of L29P PFE/acetate with that of CPO-F/propionate (PDB ID: 1A8S (9)) shows a good overall fit of protein (RMSDall-atom of 0.68 Å when aligning backbone atoms of chain A of L29P PFE with CPO-F) and nearly identical conformations near the active site, including the W-cis-P peptide bond and the position of the tryptophan side chain, Figure 2B. One exception to the similarity is that the orientation of the propanoate molecule in CPO-F differs significantly from the orientation of acetate in L29P PFE, see below.
The active site of L29P PFE soaked in acetate (pH 5) contains an acetate and a water molecule in each monomer of the asymmetric unit, Figure 2C. In each monomer, the C=O of acetate accepts hydrogen bonds from the two N-H's in the oxyanion hole. The distances from the oxygen to the αN of M95 and W28 range from 2.8 to 3.1 Å. The methyl group points towards the acyl pocket while the carboxylic hydroxyl oxygen points towards the alcohol pocket. Since the crystal soak solution was at pH of 5, the ionization form of acetic acid may be acetate or acetic acid. (The pKa of 4.8 for acetic acid predicts 61% is in the acetate form and 39% is acetic acid.) The substrate for the reaction is likely acetic acid. Distance between the C=O of acetate and S94-Oγ ranges between 2.8 to 3.1 Å. The single water molecule, “WAT1” observed in the alcohol pocket of PFE makes a hydrogen bond between C=O of W28 (2.9 Å) and C-O (2.7 Å) of acetate. The orientation of the acetate is consistent with the formation of an acetyl-enzyme intermediate. The next mechanistic step could be attack of the active site serine on the acetate carbonyl carbon.
The previous x-ray crystal structure of propanoate bound to CPO-F had a different orientation, which was not consistent with the next step being formation of a propanoyl enzyme intermediate. These crystals of CPO-F were soaked in propanoate at pH 6.6 (9), where propanoate, not propanoic acid, predominates. The pKa of 4.9 for propanoic acid predicts that 98% is in the propanoate form. The carboxylate anion of propanoate is hydrogen bonded to Nε of H251, which prevents the histidine from acting as a base to deprotonate Oγ of the serine. The catalytically nonproductive orientation of the propanoate is consistent with very low catalytic activity at pH 6.6.
Mass spectrometry of the acyl-enzyme intermediate
Electrospray ionization mass spectrometry showed an acyl enzyme during the PFE-L29P-catalyzed hydrolysis of ε-caprolactone at pH ∼5.5, Figure 3. The enzyme appeared at the expected mass of 30,912 Da and, in the presence of 25 mM ε-caprolactone, an additional peak appeared at 31,026 Da. The 114 Da increase in mass is consistent with the formation of an acyl-enzyme intermediate. The observation of the acyl-enzyme intermediate with L29P PFE is consistent with a covalent mechanism and thus, strongly supports the ping-pong bi-bi mechanism. Further, the x-ray structure of acetate bound to L29P PFE supports the ping-pong bi-bi mechanism. Other serine hydrolases that follow a ping-pong bi-bi mechanism, e.g, porcine pancreatic elastase (32, 33) also show an acyl-enzyme intermediate at low pH.
Attempts to detect the acetyl-enzyme intermediate in L29P PFE in 0.5 M acetate at pH 5.5 were inconclusive. The high concentration of acetate in this solution yielded gave mono-, di- and trisodium adducts of the enzyme. The disodium adduct (expected at M+44 Da) and any acetyl enzyme (expected at M+42 Da) overlap and could not be distinguished. The formation of an ester from an acid is thermodynamically uphill, so the amount of acetyl enzyme formed from acetate is expected to be small. On the other hand, converting one ester into another can be thermodynamically neutral, so ε-caprolactone should form more acyl-enzyme intermediate.
Is it possible to further increase the rate of L29P PFE-catalyzed perhydrolysis? Below we measured the kinetics for the reverse reaction and found that it is near the diffusion limit. Since the reverse reaction cannot be much faster, then the forward rate (kcat/Km) also cannot be much faster either. The ratio of the forward and reverse reactions is fixed by the equilibrium constant.
Hydrolysis of peracetic acid
Perhydrolases catalyze the hydrolysis of peracetic acid to acetic acid and hydrogen peroxide, the reverse of the reaction in Figure 1 above. We monitored the rate of hydrolysis with a pHstat, which controls the addition of base. Peracetic acid (pKa 8.20 (34)) is >99% protonated at pH 5.5, while 85% of the product acetic acid (pKa 4.75) dissociates to form acetate. Thus, hydrolysis of one mole of peracetic acid at pH 5.5 releases 0.85 moles of protons. The observed rates were corrected for the incomplete ionization of acetic acid at pH 5.5 to give the true rates listed in Table 3.
Table 3.
Steady state kinetic constants for hydrolysis of peracetic acid catalyzed by wild-type PFE and L29P PFE.a
| Enzyme | kcat [s-1] | Km [mM] | kcat/Km [s-1 M-1] |
|---|---|---|---|
| Wild-type PFE | 100 ± 3 | 0.041 ± 0.005 | 2 × 10⁶ |
| L29P PFE | 139 ± 2 | <0.003 b | >5 × 10⁷ |
Initial rates were measured at 23 °C by pHstat, which controlled the addition of 0.0100 N NaOH to keep the pH at 5.5.
The Km value for peracetic acid with L29P PFE could not be measured accurately because the pHstat method could not detect hydrolysis of peracetic acid below 0.01 mM. The rate of hydrolysis decreased only when the concentration of peracetic acid was below 0.03 mM. From this value we estimated the Km to be < 0.003 mM.
Both wild-type PFE and L29P PFE were excellent catalysts for the hydrolysis of peracetic acid. The kcat values were similar (100 and 139 s-1, respectively), but the Km for peracetic acid was >14-fold lower for L29P PFE than for the wild-type enzyme (<0.003 versus 0.041 mM). The value of Km for L29P PFE is only an upper limit because the pHstat method could detect hydrolysis of peracetic acid only above 0.01 mM. The rate of hydrolysis decreased slightly below 0.03 mM peracetic acid, so we estimated that Km is < 0.003 mM. Due to this lower Km for peracetic acid, the specificity constant is >20-fold higher for L29P PFE than for wild-type PFE. We expect that the true specificity constant is ∼100-fold higher for L29P PFE than for wild-type PFE because the specificity constant for the forward reaction is ∼100-fold higher for L29P PFE than for wild-type PFE. The Haldane relationship (35) requires that the ratio of forward and reverse reactions to equal the equilibrium constant. The lower Km for peracetic acid for L29P PFE is consistent with the hypothesis that this amino acid substitution stabilizes the peroxy intermediate. Peracetic acid is structurally closer to the peroxy intermediate than either acetic acid or hydrogen peroxide and its binding to the active site may be favored by the shifted carbonyl group of W28.
This specificity constant for the L29P PFE-catalyzed hydrolysis of ∼108 s-1 M-1 approaches the value for bimolecular rate constants of a diffusion controlled enzyme-catalyzed reaction: 4 × 10⁸ s-1 M-1 for triose phosphate isomerase (36). This high specificity constant indicates that L29P PFE is a highly efficient catalyst for the reaction in Figure 1 and catalyzes hydrolysis of peracetic acid at close to the diffusion limit.
Mutants with higher kcat for perhydrolysis
Previously, we compared the amino acid sequences of hydrolases and perhydrolases to identify residues responsible for perhydrolase versus esterase activities in α/β hydrolases. This comparison and subsequent experimentation identified the single amino acid substitution variant L29P PFE (13). In this paper, we attempted to further improve L29P PFE by aligning its amino acid sequence with not all perhydrolases, but with the perhydrolases that have the highest specific activity: BPO-A1, a perhydrolase from Streptomyces aureofaciens ATCC 10762 (previously called a nonheme bromoperoxidase), CPO-T, a perhydrolase from Streptomyces aureofaciens Tü24 (previously called a nonheme chloroperoxidase), and CPO-L, a perhydrolase from Streptomyces lividans TK64 (previously called a nonheme chloroperoxidase) (37). Seventeen residues were conserved in BPO-A1 and CPO-L but not with L29P PFE. We chose H57 and H93 for mutagenesis because they were closest to the active site. We also enlarged the acyl binding pocket of L29P PFE by replacing F125 with Ala. Starting with L29P PFE, additional site directed mutagenesis yielded the three double mutants - L29P/F93H PFE, L29P/F125A PFE, L29P/F57H PFE. (See Methods and Materials for details.)
Michaelis-Menten kinetic constants for the ping-pong bi-bi reaction were measured by keeping the acetate concentration constant and varying hydrogen peroxide and then by keeping hydrogen peroxide constant and varying acetate. This approach yields apparent kinetic constants for the varied substrate. The Michaelis constants for acetate and hydrogen peroxide are expected to differ, but the kcat values should be the same when the concentration of the constant substrate is high enough to saturate the enzyme.
Initial rates were monitored spectrophotometrically using an indirect assay. Enzyme-generated peracetic acid oxidized bromide ion to bromonium, which reacted with monochlorodimedone to form bromochlorodimedone. The decrease in monochlorodimedone concentration causes a decrease in absorbance at 290 nm (16). Reaction rates were measured at five or more different substrate concentrations. The data was fit to the Michaelis-Menten equation using a nonlinear regression and gave a close fit (R2 > 0.97).
The value of kcat improved for L29P PFE ∼44-fold for perhydrolysis of acetic acid as compared to wild-type PFE (42-fold higher with acetic acid as the varied substrate - 0.12 to 5.1 s-1 and 47-fold higher with hydrogen peroxide as the varied substrate 0.094 to 4.4 s-1), Table 4. The value of kcat would be the same in both cases if the enzyme were completely saturated with the constant substrate. The Km value for acetic acid was high (210 mM) so the acetate concentration of 500 mM did not completely saturate the enzyme. For this reason the value of kcat measured when acetic acid is the constant substrate was slightly lower than when hydrogen peroxide was the constant substrate. The Km values decreased for L29P PFE as compared to wild-type PFE, but only approximately two fold. The Km for hydrogen peroxide decreased 1.8-fold (3.3 to 1.8 mM) and the Km for acetic acid decreased 2.4-fold (500 to 210 mM). The combined improvements in both kcat and Km gave a specificity constant (kcat/Km) improvement 70-100-fold, Table 4.
Table 4.
Apparent steady state kinetic constants for perhydrolysis of acetic acid catalyzed by wild-type PFE, L29P PFE and double mutants.a
| Enzyme | Varied substrate | kcat [s-1] | Kmapp [mM] | kcat/Kmapp [s-1 M-1] |
|---|---|---|---|---|
| Wild-type PFE | Acetic acidb | 0.12 ± 0.02 | 500 ± 100 | 0.2 |
| Hydrogen peroxide | 0.094 ± 0.002 | 3.3 ± 0.2 | 28 | |
| L29P PFE | Acetic acid | 5.1 ± 0.4 | 210 ± 60 | 20 |
| Hydrogen peroxide | 4.4 ± 0.2 | 1.8 ± 0.2 | 2000 | |
| L29P/F93H PFE | Acetic acid | 11 ± 1 | 610 ± 120 | 20 |
| Hydrogen peroxide | 9 ± 1 | 2.7 ± 0.6 | 3000 | |
| L29P/F125A PFE | Acetic acid | 10 ± 1 | 340 ± 80 | 30 |
| Hydrogen peroxide | 13 ± 1 | 4.8 ± 0.7 | 3000 | |
| L29P/F57H PFE | Acetic acid | 3.3 ± 0.2 | 380 ± 40 | 10 |
| Hydrogen peroxide | 6.8 ± 0.2 | 3.3 ± 0.4 | 1000 |
Kinetic constants were obtained at 23 °C by varying each substrate independently. The fixed acetic acid concentration was 1.4 M except for L29P PFE where it was 500 mM. The fixed hydrogen peroxide concentration was 9.9 mM, which saturates the active site and therefore yields higher values of kcat.
Acetic acid is the likely substrate for the enzyme, so we refer to the substrate as acetic acid even though at pH 5.5 approximately 85 mol% is in the acetate form. The concentrations refer to the sum of both acetic acid and acetate.
Two of the double mutants - L29P/F93H PFE and L29P/F125A PFE - showed an additional two fold improvement in kcat, but the Km values increased by a similar amount, so the specificity constants did not change as compared to the single mutant L29P PFE. The kcat values were 11 and 9 s-1 for L29P/F93H PFE and 10 and 13 s-1 for L29P/F125A PFE, both approximately a twofold increase over 5.1 and 4.4 s-1 for L29P PFE using acetic acid or hydrogen peroxide as the varied substrate, respectively. The Km values increased approximately two fold. The molecular basis of the improvements in kcat are not clear. Although the F93H substitution is next to the active site serine, molecular modeling of L29P/F93H PFE shows that the Nε of H93 is too far away to hydrogen bond to either H251 (4.4 Å) or S94 (4.9 Å).
The third double mutant - L29P/F57H PFE - showed an approximately 1.5-fold decrease in kcat and a similar increase in Km, so the overall specificity constant decreased approximately two fold as compared to L29P PFE: 20 and 2000 s-1 M-1 as compared to 10 and 1000 s-1 M-1 for L29P PFE using acetic acid or hydrogen peroxide as the varied substrate, respectively. These results suggest that the histidine at position 57 in perhydrolases does not contribute to catalysis. The pH-rate profiles of these enzymes are in Figure S-2 of the Supporting Information.
Above, we examined the increase in perhydrolysis activity upon making the L29P substitution PFE. This increase is accompanied by a decrease in esterase activity. Below we examine the esterase activity of this variant and suggest that steric hindrance created by the L29P substitution causes the decrease. In contrast, the rate of hydrolysis of lactones, which have a different shape from esters, increases in L29P PFE.
Hydrolysis of esters
Wild-type PFE catalyzes hydrolysis of a wide range of esters (38), but L29P PFE catalyzes hydrolysis of only methyl esters efficiently, Table 5. For methyl acetate, both wild-type PFE and L29P PFE show similar kinetic constants. For ethyl acetate, the kinetic constants for wild-type PFE remain similar, but the kcat for L29P PFE decreased 11-fold and the specificity constant decreased 50-fold as compared to methyl acetate. We previously reported similar results for propanoate esters and p-nitrophenyl acetate, but without kcat and Km data (13). Both wild-type PFE and L29P PFE catalyze hydrolysis of methyl propanoate at similar rates, but L29P PFE is 5-fold slower that wild-type PFE for propyl propanoate. L29P PFE catalyzes hydrolysis of p-nitrophenyl acetate 100-fold slower than wild-type PFE. Poor water solubility of these substrates prevented measurement of the kinetic constants. Thus, esters with an alcohol group larger than methyl appear to be poor substrates for L29P PFE, but the size of the alcohol group has little effect for wild-type PFE.
Table 5.
Steady state kinetic constants for hydrolysis of acetate esters and ε-caprolactone by wild-type PFE and L29P PFE.a
| Enzyme | substrate | kcat [s-1] | Km [mM] | kcat/Km [s-1 M-1] |
|---|---|---|---|---|
| Wild-type PFE | methyl acetate | 25 ± 1 | 43 ± 3 | 600 |
| Wild-type PFE | ethyl acetate | 9 ± 1 | 33 ± 1 | 300 |
| Wild-type PFE | ε-caprolactone | >140 | >2000 | 50b |
| L29P PFE | methyl acetate | 7.7 ± 0.2 | 50 ± 5 | 200 |
| L29P PFE | ethyl acetate | 0.67 ± 0.05 | 160 ± 30 | 4 |
| L29P PFE | ε-caprolactone | 11 ± 1 | 39 ± 1 | 280 |
Rates of hydrolysis were measured at 23 °C using the pH indicator p-nitrophenol at pH 7.2 in 5.0 mM BES buffer.
Determined from the initial slope of rate versus substrate concentration, R2 = 0.996.
Molecular modeling of ester hydrolysis
Molecular modeling suggests that as the carbonyl group of W28 moves closer to the catalytic serine in L29P PFE, it creates steric hindrance for alcohol moieties larger than methyl. We modeled the tetrahedral intermediate that forms upon attack of the active site serine on the ester, Figure 4. Key interactions include two hydrogen bonds to the oxyanion oxygen from the backbone amides of M95 and W28 and two hydrogen bonds formed from Nε of H251 to Oγ of S94 and to the alcohol oxygen, Table 6. For the wild-type PFE, hydrogen bond distances ranged from 2.7-2.9 Å for both methyl acetate and ethyl acetate, which indicate a strong hydrogen bonds. For L29P PFE, all four hydrogen bond distances were 2.8 Å for methyl acetate, but for ethyl acetate the distance between Nε of H251 and the alcohol group was 3.5 Å, which is too far away to make a hydrogen bond. This missing hydrogen bond likely accounts for the 50-fold lower reaction rate.
Figure 4.

Mesh showing water-accessible regions in the active sites of wild-type PFE and L29P with the modeled tetrahedral intermediate for the acetylation of active site serine by ethyl acetate (Td1). (A) The alcohol pocket accommodates the ethyl group of the tetrahedral intermediate and could also accept a longer alcohol, but not larger acyl groups. The acyl pocket of wild-type PFE is small while the alcohol pocket is larger, as shown on the diagram on the right side. (B) The leucine to proline substitution shifts the main chain W28 carbonyl which pinches off the alcohol pocket. The ethyl group is forced to adopt an unfavorable conformation in the enlarged acyl pocket caused by a shift in the indole ring of W28. A diagram on the right shows that the acyl pocket of L29P is larger than the alcohol pocket. The mesh shows regions accessible to a sphere with a radius of 1.4 Å, which models a water molecule. Water molecules were removed before modeling the mesh regions.
Table 6.
Key hydrogen bond distances (Å) in the modeled first tetrahedral intermediate for hydrolysis of acetate esters and ε-caprolactone by wild-type PFE and L29P PFE a.
| Enzyme (substrate model) | oxyanion O to M95 Nα | oxyanion O to W28 Nα | His251Ns to S94Oγ | H251Nε to alcohol oxygen |
|---|---|---|---|---|
| Wt PFE (methyl acetate) | 2.9 | 2.7 | 2.6 | 2.8 |
| Wt PFE (ethyl acetate) | 2.9 | 2.7 | 2.7 | 2.7 |
| L29P PFE (methyl acetate) | 2.8 | 2.8 | 2.8 | 2.8 |
| L29P PFE (ethyl acetate) | 2.7 | 2.7 | 2.7 | 3.5 |
The program suite Maestro was used for visualization and distance measurements. Macro-model using OPLS-2005 force field was used to optimize the geometry of all models using conjugate gradient algorithm to an RMSD of ≤ 0.05 Å. The distance in bold is too far to be a hydrogen bond which indicates a catalytically non productive model.
Consistent with these modeling results, the water-accessible regions in the active site shows a smaller alcohol-binding region in L29P PFE as compared to wild-type PFE. Wild-type PFE shows a single solvent-accessible region in the active site that fits the tetrahedral intermediate for hydrolysis of ethyl acetate, Figure 5. In contrast, the shift of the W28 C=O moves closer to the active site in L29P PFE and separates the alcohol pocket into two regions. For this smaller pocket to fit a larger alcohol group, the alcohol moiety must twist into a different conformation, thereby breaking a key hydrogen bond. The smaller alcohol-binding region of L29P PFE supports observation of the 50-fold lower specificity constant for ethyl acetate in L29P PFE as compared to wild-type PFE. In addition, L29P causes a shift in the indole ring of W28 that enlarges the acyl pocket.
Figure 5.

Hydrolysis of ε-caprolactone
Several lactonases and lactamases show perhydrolysis activity (39, 40). For this reason, we also measured the ability of PFE and L29P PFE to catalyze the hydrolysis of ε-caprolactone. Steady state kinetics shows that L29P PFE is an approximately five fold better catalyst than wild-type PFE for hydrolysis of ε-caprolactone, due to a higher affinity towards the lactone, Table 5. The kinetic data for L29P PFE fit the Michaelis-Menten equation and yield a Km of 39 mM and a kcat of 11 s-1, which corresponds to a kcat/Km of 280 s-1 M-1. For wild-type PFE, the rate of hydrolysis increased linearly with increasing ε-caprolactone concentration even at 500 mM (approaching the solubility limit), so we could not fit the data to the Michaelis-Menten equation. The slope of this line was used to estimate the kcat/Km value of 50 s-1 M-1. We estimate that Km must be >2000 mM (at least four times the highest value tested) and that kcat must be >140 s-1 (at least five times the value seen at a substrate concentration of <kcat/2). In spite of the higher kcat value for wild-type PFE, L29P PFE would be an approximately five fold better catalyst for hydrolysis of ε-caprolactone at the low concentrations expected in vivo because it binds ε-caprolactone more tightly. Unlike esters which adopt a trans conformation, lactones adopt a cisoid conformation up to 7-membered rings.
Molecular modeling of ε-caprolactone hydrolysis and binding
Molecular modeling of the tetrahedral intermediates for hydrolysis of ε-caprolactone yielded hydrogen bond distances of less than 3.0 Å between the Nε of H251 to Oγ of S94 and to the alcohol oxygen for both wild-type PFE and L29P PFE. (Data not shown.) However, the substrate ε-caprolactone bound better to L29P PFE than to wild-type PFE, consistent with the lower Km of ε-caprolactone with L29P. Docking ε-caprolactone using GLIDE (41) found eight different orientations bound to the active site of L29P but only one to wild type. The larger acyl pocket in L29P accommodates the lactone better than does wild-type PFE and can account for the at least fifty-fold higher affinity for L29P PFE.
Discussion
Two experiments support the acyl-enzyme mechanism: the detection of the acyl-enzyme intermediate by mass spectrometry and the observation of an acetate complex by x-ray crystallography that is consistent with an enzyme-substrate complex that reacts via an acyl enzyme. The molecular weight observed for the acyl-enzyme intermediate is also consistent with a noncovalent enzyme-ε-caprolactone complex since the molecular weight is the same as that for the acyl-enzyme intermediate. An example of a noncovalent complex observed by mass spectrometry is phosphoenolpyruvate complexed to 3-deoxy-D-manno-octulosonate 8-phosphate (DO8P) synthase (42). This enzyme binds phosphoenolpyruvate tightly (Km = 3.1 μM), which allows the complex to persist during mass spectrometry. In our case, L29P PFE binds ε-caprolactone 10,000 times less tightly (Km = 39 mM), so a noncovalent complex is unlikely. Therefore, the acyl-enzyme intermediate is the most likely assignment. The X-ray crystal structure of the substrate (acetate) complex with PFE favors the acyl-enzyme mechanism because the acetate orientation is consistent with attack of the active site serine at the carbonyl. Importantly, these crystals formed at pH 5.0, near the optimum of 5.5 for perhydrolysis. This structure likely contains the substrate in its reactive form as acetic acid. The pH-activity profiles (see Supporting Information) show that acetic acid not acetate is the reactive form of the substrate. Previous experiments to distinguish the acyl-enzyme mechanism from the non-covalent mechanism for PFE yielded ambiguous results; see discussion in the Supporting Information.
Modeling based on the x-ray structure of L29P PFE and the acyl-enzyme mechanism can explain the observed increase in perhydrolysis (13). Molecular modeling of the second tetrahedral intermediate for perhydrolysis using molecular mechanics showed an additional hydrogen bond from hydrogen peroxide to the C=O of W28 of L29P PFE, but the same distance is too far way for wild-type PFE. This hydrogen bond can stabilize the transition state for perhydrolysis and is the molecular basis for the increased perhydrolysis activity. Lee and coworkers (43) did additional modeling that agrees with this proposal. They used quantum mechanics to calculate the charges, bond distances, and angles for the second tetrahedral intermediate to create a more accurate model of the second tetrahedral intermediate. Modeling of this tetrahedral intermediate with a molecular mechanics force field showed the same hydrogen bond between hydrogen peroxide and the C=O of W28 of L29P PFE. Further, this hydrogen bond persisted during a molecular dynamics simulation of 5 ns as the conformation of the protein and tetrahedral intermediate changed. This stability of this hydrogen bond supports the notion that it is an important contribution to catalysis. A similar simulation of using wild-type PFE showed no hydrogen bond, even during the molecular dynamic simulation where the C=O of W28 could move closer to the active site. The authors did not model the Michaelis complexes for these reactions, but we hypothesize that this hydrogen bond could also form in the Michaelis complex and account for the increase in kcat by eliminating nonproductive binding of hydrogen peroxide. In wild-type PFE, the hydrogen peroxide binds with a similar affinity, but, we hypothesize, in a nonproductive orientation, which hinders catalysis and lowers kcat. Shifting this nonproductive orientation to a productive orientation in L29P PFE increases kcat.
The increase in the specificity constant for reverse reaction – hydrolysis of peracetic acid – is mainly due to decrease in Km and not an increase in kcat as in perhydrolysis of acetic acid. The substrate is peracetic acid, which is a more complex structure than hydrogen peroxide. It does not bind tightly to wild-type PFE, but adding a hydrogen bond between the carbonyl oxygen of W28 and peracetic acid increases the affinity of the enzyme for this substrate. We hypothesize that nonproductive binding is not significant for this substrate. The new hydrogen bond also accounts for this decrease in Km.
The high rate of the reverse reaction shows that L29P PFE is a very efficient catalyst near the diffusion limit. For this reason, the specificity constant for the forward reaction cannot be significantly improved. Biocatalysis normally occurs in solutions containing substrate concentrations well above Km, so kcat is the more important constant. It may be possible to increase kcat at the expense of increasing Km. Consistent with this expectation, two double mutants – L29P/F125A PFE and L29P/F93H PFE – enhanced the kcat for perhydrolysis of acetic acid two fold, but at the cost of increasing Km as compared to L29P PFE. Bugg and coworkers made a N109H mutation in a C-C hydrolase, which is analogous to the F93H substitution above (44). The N109H substitution increased the specific activity of ester aminolysis by hydroxylamine approximately four fold. These researchers hypothesized that the substitution may help orient the hydroxylamine. In our case, the F93H substitution in the L29P PFE increased kcat approximately two fold, but the Km for hydrogen peroxide increased, making it unlikely that this substitution contributes to the binding of hydrogen peroxide. This different explanation for the effects of analogous substitution is consistent with the different proposed mechanism for the two enzymes.
Steric hindrance within the alcohol binding site created by the L29P mutation decreases the esterase activity. The specificity constant for L29P PFE towards hydrolysis of ethyl acetate is 75-fold lower than in the wild-type enzyme. A model of the first tetrahedral intermediate using ethyl acetate shows that the distance between the catalytic H251 and the alcohol group is too far away (3.5 Å) to make a hydrogen bond. In addition, the model reveals a dihedral twist of the alcohol group that resembles the structure of lactones. Consistent with this rationale, the kcat/Km value for ε-caprolactone increased five fold in L29P PFE as compared to wild-type PFE.
One possible biological role for perhydrolases is lactone hydrolysis. L29P PFE, and presumably CPO-F, shows higher lactonase activity than esterases. Pseudomonas fluorescens strains can degrade four-ring polynuclear aromatic hydrocarbons (45), which can involve lactone intermediates, so there is a biological role for the lactonase activity. In addition, at least two other lactonases (39) and a lactamase (40) show perhydrolase activity.
Another biological role of perhydrolases may be to detoxify peracetic acid as suggested previously by Shimizu and coworkers (46). Perhydrolases, including L29P PFE, catalyze the hydrolysis of peracetic acid to hydrogen peroxide and acetic acid. Catalase can further detoxify the hydrogen peroxide. The L29P substitution in PFE decreased the Km for peracetic acid to less than 0.003 mM as compared to wild type of 41 mM. The kcat increased modestly. These kinetic constants would enable the enzyme to detoxify very low concentrations of peracetic acid to protect the cell. Disruption of the perhydrolase gene in a soil bacterium increased its sensitivity to peracetic acid and conversely, expressing a perhydrolase in E. coli increased its resistance to peracetic acid (46). The biological role of perhydrolases is unlikely the formation of peracetic acid because the in vivo concentrations of acetic acid and hydrogen peroxide are too low to make appreciable amounts peracid. For example, an in vivo concentration of 7 mM acetic acid and 7 mM hydrogen peroxide would yield only ∼ 0.02 μM peracetic acid at pH 7. This value is based on an equilibrium constant of 2 for the perhydrolysis of unionized acetic acid and accounts for the predominantly ionized form of acetic acid at pH 7 (47). In contrast, Shimizu and coworkers used a 30,000-fold higher amount − 600 μM peracetic acid – to inhibit bacterial growth (46). A natural source of peracetic acid is the oxidative decarboxylation of pyruvate by thiamin pyrophosphate dependent acetolactate synthases (48). This side reaction causes the oxygen sensitivity of some anaerobic organisms and perhydrolases may reduce this sensitivity. For biocatalysis, however, the synthesis of peracetic acid is a very useful reaction.
These results reported herein also provide insight into mechanisms of divergent evolution of new catalytic activities. The catalytic mechanisms of ester hydrolysis, lactone hydrolysis, and perhydrolysis are similar, so that the wild-type enzyme can catalyze all three of these reactions. The single amino acid substitution L29P dramatically changes the relative efficiency of these reactions by changing the substrate binding. Hydrogen peroxide and lactones bind better, ethyl esters bind worse. Modern divergent enzymes, like the esterase and perhydrolase from Pseudomonas fluorescens, typically differ by tens or even hundreds of amino acid substitutions. Mechanistic analysis suggests that the new catalytic reaction mechanisms require only a few substitutions. The experiments in this paper show how and why a single amino acid substitution dramatically changes catalytic activity.
Supplementary Material
Acknowledgments
We thank Dr. LeeAnn Higgins and Dr. Bruce Witthuhn at the University of Minnesota Mass Spectrometry Consortium for ESI-MS spectra, Ed Hoeffner at the University of Minnesota Kahlert Structural Biology Laboratory for advice on crystal growth, the Minnesota Supercomputing Institute for computer modeling facilities and support and the University of Minnesota for financial support.
This research was supported by the University of Minnesota, the US National Institutes of Health (Training Grant T32 GM008347 to support TY, Research Grant GM24689 (John Lipscomb) to support VP) and the Natural Sciences and Engineering Research Council of Canada (postgraduate fellowships to KLM and JDC).
Abbreviations
- BES
N,N-bis(2-hydroxyethyl)-2-aminoethanesulfonic acid
- BPO-A1
perhydrolase from Streptomyces aureofaciens ATCC 10762 (previously called a nonheme bromoperoxidase)
- CPK colors
Corey, Pauling and Koltun color scheme
- CPO-F
perhydrolase from Pseudomonas fluorescens (previously called a nonheme chloroperoxidase)
- CPO-L
perhydrolase from Streptomyces lividans TK64 (previously called a nonheme chloroperoxidase)
- CPO-T
perhydrolase from Streptomyces aureofaciens Tü24 (previously called a nonheme chloroperoxidase)
- LB
Luria-Bertani broth
- MCD
monochlorodimedone
- Ni-NTA
nickel complexed to nitrilo triacetic acid
- OPLS
optimized potential for liquid simulations
- PCR
polymerase chain reaction
- PDB ID
protein data bank identification code
- PFE
Pseudomonas fluorescens esterase
- pNP
para-nitrophenol
- RMSD
root-mean-square deviation
Footnotes
X-ray coordinates have been deposited in the Research Collaboratory for Structural Bioinformatics, Rutgers University, New Brunswick, NJ (accession nos. 3hea and 3hi4)
Supporting Information Available. The supporting information contains 1) the electrospray ionization mass spectrometry data for detection of acyl-enzyme intermediate, 2) the pH-rate profile of perhydrolysis catalyzed by mutants and wild-type PFE and 3) a discussion of previous experiments to distinguish acyl-enzyme versus a noncovalent mechanisms for PFE This material is available free of charge via the Internet at http://pubs.acs.org.
References
- 1.Björkling F, Frykman H, Godtfredsen SE, Kirk O. Lipase-catalyzed synthesis of peroxycarboxylic acids and lipase-mediated oxidations. Tetrahedron. 1992;48:4587–4592. [Google Scholar]
- 2.Picard M, Gross J, Lübbert E, Tölzer S, Krauss S, van Pée KH, Berkessel A. Metal-free bacterial haloperoxidases as unusual hydrolases: activation of H2O2 by the formation of peracetic acid. Angew Chem Int Ed Engl. 1997;36:1196–1199. [Google Scholar]
- 3.Warwel S, Klaas MR. Chemoenzymic epoxidation of unsaturated carboxylic acids. J Mol Catal B: Enzym. 1995;1:29–35. [Google Scholar]; Klaas MR, Warwel S. Lipase-catalyzed preparation of peroxy acids and their use for epoxidation. J Mol Catal A: Chem. 1997;117:311–319. [Google Scholar]; de Zoete MC, van Rantwijk F, Maat L, Sheldon RA. Selective oxidation of penicillin G with hydrogen peroxide and with enzymatically generated peroxyoctanoic acid. Recl Trav Chim Pays-Bas. 1993;112:462–463. [Google Scholar]
- 4.Hegarty AF. Comprehensive Organic Chemistry. Pearson Higher Education; New York: 1995. pp. 1105–1118. [Google Scholar]
- 5.Selected references: ten Brink GJ, Arends IWCE, Sheldon RA. The Baeyer-Villiger reaction: new developments toward greener procedures. Chem Rev. 2004;104:4105–4123. doi: 10.1021/cr030011l.Harrison CR, Hodge P. Oxidation of some penicillins and other sulphides by use of a polymer-supported peroxy-acid. J Chem Soc Perkin Trans 1. 1976;21:2252–2254. doi: 10.1039/p19760002252.Drago RS, Mateus ALML, Patton D. Stoichiometric and catalytic oxidation of organic substrates with in-situ-generated peracids. J Org Chem. 1996;61:5693–5696.Doumaux AR, McKeon ARJE, Trecker DJ. Metal ion-catalyzed peroxide oxidation of organic substrates Selective synthesis of imides. J Am Chem Soc. 1969;91:3992–3993.Sugimoto H, Sawyer DT. Iron(II)-induced activation of hydroperoxides for the dehydrogenation and monooxygenation of organic substrates in acetonitrile. J Am Chem Soc. 1985;107:5712–5716.
- 6.Ollis DL, Cheah E, Cygler M, Dijkstra B, Frolow F, Franken SM, Harel M, Remington SJ, Silman I, Schrag J, Sussman JL, Verschueren KHG, Goldman A. The α/β hydrolase fold. Protein Eng. 1992;5:197–211. doi: 10.1093/protein/5.3.197. [DOI] [PubMed] [Google Scholar]
- 7.Pelletier I, Altenbuchner J. A bacterial esterase is homologous with non-heme haloperoxidases and displays brominating activity. Microbiology. 1995;141:459–468. doi: 10.1099/13500872-141-2-459. [DOI] [PubMed] [Google Scholar]
- 8.Hecht HJ, Sobek H, Haag T, Pfeifer O, van Pée KH. The metal-ion-free oxidoreductase from Streptomyces aureofaciens has an α/β hydrolase fold. Nat Struct Biol. 1994;1:532–537. doi: 10.1038/nsb0894-532. [DOI] [PubMed] [Google Scholar]
- 9.Hofmann B, Tölzer S, Pelletier I, Altenbuchner J, van Pée KH, Hecht HJ. Structural investigation of the cofactor-free chloroperoxidases. J Mol Biol. 1998;279:889–900. doi: 10.1006/jmbi.1998.1802. [DOI] [PubMed] [Google Scholar]
- 10.Kirk O, Conrad LS. Metal-free haloperoxidases: fact or artifact? Angew Chem Int Ed Engl. 1999;38:977–979. doi: 10.1002/(SICI)1521-3773(19990401)38:7<977::AID-ANIE977>3.0.CO;2-8. [DOI] [PubMed] [Google Scholar]
- 11.Bugg TDH. Diverse catalytic activities in the α/β-hydrolase family of enzymes: activation of H2O, HCN, H2O2, and O2. Bioorg Chem. 2004;32:367–375. doi: 10.1016/j.bioorg.2004.05.005. [DOI] [PubMed] [Google Scholar]
- 12.Gruber K, Gartler G, Krammer B, Schwab H, Kratky C. Reaction mechanism of hydroxynitrile lyases of the α/β-hydrolase superfamily: The three-dimensional structure of the transient enzyme-substrate complex certifies the crucial role of LYS236. J Biol Chem. 2004;279:20501–20510. doi: 10.1074/jbc.M401575200. [DOI] [PubMed] [Google Scholar]
- 13.Bernhardt P, Hult K, Kazlauskas RJ. Molecular basis of perhydrolase activity in serine hydrolases. Angew Chem Int Ed. 2005;18:2742–2746. doi: 10.1002/anie.200463006. [DOI] [PubMed] [Google Scholar]
- 14.Kirner S, Krauss S, Sury G, Lam ST, Ligon JM, van Pée KH. The nonheme chloroperoxidase from Pseudomonas fluorescens and its relationship to pyrrolnitrin biosynthesis. Microbiology. 1996;142:2129–2135. doi: 10.1099/13500872-142-8-2129. [DOI] [PubMed] [Google Scholar]
- 15.Gasteiger E, Hoogland C, Gattiker A, Duvaud S, Wilkins MR, Appel RD, Bairoch A. Protein Identification and Analysis Tools on the ExPASy Server. In: Walker John M., editor. The Proteomics Protocols Handbook. Humana Press; New Jersey: 2005. pp. 571–607. [Google Scholar]
- 16.Morris DR, Hager LP. Chloroperoxidase I. Isolation and properties of the crystalline glycoprotein. J Biol Chem. 1966;241:1763–1768. [PubMed] [Google Scholar]
- 17.Fersht A. Structure and Mechanism in Protein Science. Freeman; New York: 1999. p. 172. [Google Scholar]
- 18.Janes LE, Löwendahl AC, Kazlauskas RJ. Quantitative screening of hydrolase libraries using pH indicators: identifying active and enantioselective hydrolases. Chem Eur J. 1998;4:2324–2331. [Google Scholar]
- 19.Cheeseman JD, Tocilj A, Park S, Schrag JD, Kazlauskas RJ. X-Ray crystal structure of an aryl esterase from Pseudomonas fluorescens. Acta Crystallogr. 2004;D 60:1237–1243. doi: 10.1107/S0907444904010522. [DOI] [PubMed] [Google Scholar]
- 20.Pflugrath JW. The finer things in X-ray diffraction data collection. Acta Crystallogr, D: Biol Crystallogr. 1999;D55:1718–1725. doi: 10.1107/s090744499900935x. [DOI] [PubMed] [Google Scholar]
- 21.Jones TA, Zou JY, Cowan SW, Kjeldgaard M. Improved methods for building protein models in electron density maps and the location of errors in these models. Acta Crystallogr, Sect A: Found Crystallogr. 1991;A47:110–119. doi: 10.1107/s0108767390010224. [DOI] [PubMed] [Google Scholar]
- 22.Murshudov GN, Vagin AA, Dodson EJ. Refinement of macromolecular structures by the maximum-likelihood method. Acta Crystallogr, Sect D: Biol Crystallogr. 1997;D53:240–255. doi: 10.1107/S0907444996012255. [DOI] [PubMed] [Google Scholar]
- 23.Perrakis A, Morris R, Lamzin VS. Automated protein model building combined with iterative structure refinement. Nat Struct Biol. 1999;6:458–463. doi: 10.1038/8263. [DOI] [PubMed] [Google Scholar]
- 24.Read RJ. Improved Fourier coefficients for maps using phases from partial structures with errors. Acta Crystallogr, Sect A: Found Crystallogr. 1986;A42:140–149. [Google Scholar]
- 25.Laskowski RA. PROCHECK: a program to check the stereochemical quality of protein structures. J Appl Crystallogr. 1993;26:283–291. [Google Scholar]
- 26.Pettersen EF, Goddard TD, Huang CC, Couch GS, Greenblatt DM, Meng EC, Ferrin TE. UCSF Chimera - A visualization system for exploratory research and analysis. J Comput Chem. 2004;25:1605–1612. doi: 10.1002/jcc.20084. [DOI] [PubMed] [Google Scholar]
- 27.DeLano WL. The PyMOL Molecular Graphics System. DeLano Scientific; Palo Alto, California, USA: 2008. http://www.pymol.org. [Google Scholar]
- 28.Vagin AA, Teplyakov AJ. MOLREP: an automated program for molecular replacement. Appl Crystalogr. 1997;30:1022–1025. [Google Scholar]
- 29.Emsley P, Cowtan K. Coot: model-building tools for molecular graphics. Acta Crystallogr, D: Biol Crystallogr. 2004;D60:2126–2132. doi: 10.1107/S0907444904019158. [DOI] [PubMed] [Google Scholar]
- 30.Lovell SC, Davis IW, Arendall WB, III, de Bakker PIW, Word JM, Prisant MG, Richardson JS, Richardson DC. Structure validation by Cαα geometry: φ, ψ and Cβ deviation. Prot Struct Func Genet. 2003;50:437–450. doi: 10.1002/prot.10286. [DOI] [PubMed] [Google Scholar]
- 31.Jorgensen WL, Maxwell DS, Tirado-Rives J. Development and testing of the OPLS All-Atom Force Field on conformational energetics and properties of organic liquids. J Am Chem Soc. 1996;118:11225–11236. [Google Scholar]
- 32.Wilmouth RC, Clifton IJ, Robinson CV, Roach PL, Aplin RT, Westwood NJ, Hajdu J, Schofield CJ. Structure of a specific acyl enzyme complex formed between β-casomorphin-7 and porcine pancreatic elastase. Nature Struct Biol. 1997;4:456–462. doi: 10.1038/nsb0697-456. [DOI] [PubMed] [Google Scholar]
- 33.Wilmouth RC, Li YH, Wright PA, Claridge TDW, Aplin RT, Schofield CJ. Reaction of clavams with elastase reveals a general method for inhibiting ‘serine’ enzymes. Tetrahedron. 2000;56:5729–5733. [Google Scholar]
- 34.Everett AJ, Minkoff GJ. The dissociation constants of some alkyl and acyl hydroperoxides. Trans Faraday Soc. 1953;49:410–414. [Google Scholar]
- 35.Fersht A. Structure and Mechanism in Protein Science. W. H. Freeman and Company; New York: 1999. pp. 117–118. [Google Scholar]
- 36.Blacklow SC, Raines RT, Lim WA, Zamore PD, Knowles JR. Triosephosphate isomerase catalysis is diffusion controlled. Biochemistry. 1988;27:1158–1165. doi: 10.1021/bi00404a013. [DOI] [PubMed] [Google Scholar]
- 37.van Pée KH, Hecht HH, Berkessel A, Schrapek T, Laatsch H. Enzymatic, active oxygen-releasing mixture and peracid production. 1996 07/03/96 WOI96066909. [Google Scholar]
- 38.Krebsfänger N, Zocher F, Altenbuchner J, Bornscheuer UT. Characterization and enantioselectivity of a recombinant esterase from Pseudomonas fluorescens. Enzyme Microb Technol. 1998;22:641–646. [Google Scholar]
- 39.Kataoka M, Honda K, Shimizu S. 3,4-Dihydrocoumarin hydrolase with haloperoxidase activity from Acinetobacter calcoaceticus F46. Eur J Biochem. 2000;267:3–10. doi: 10.1046/j.1432-1327.2000.00889.x. [DOI] [PubMed] [Google Scholar]
- 40.Line K, Isupov MN, Littlechild JA. The crystal structure of a (−) γ-lactamase from Aureobacterium species reveals a tetrahedral intermediate in the active site. J Mol Biol. 2004;338:519–532. doi: 10.1016/j.jmb.2004.03.001. [DOI] [PubMed] [Google Scholar]
- 41.Friesner RA, Banks JL, Murphy RB, Halgren TA, Klicic JJ, Mainz DT, Repasky MP, Knoll EH, Shaw DE, Shelley M, Perry JK, Francis P, Shenkin PS. Glide: A new approach for rapid, accurate docking and scoring. 1. Method and assessment of docking accuracy. J Med Chem. 2004;47:1739–1749. doi: 10.1021/jm0306430. [DOI] [PubMed] [Google Scholar]
- 42.Li Z, Sau AK, Furdui CM, Anderson KS. Probing the role of tightly bound phosphoenolpyruvate in Escherichia coli 3-deoxyD-manno-octulosonate 8-phosphoate synthase catalysis using quantitative time-resolved electrospray ionization mass spectrometry in the millisecond time range. Anal Biochem. 2005;343:25–47. doi: 10.1016/j.ab.2005.04.021. [DOI] [PubMed] [Google Scholar]
- 43.Lee W, Vojcic L, Despotovic D, Prodanovic R, Maurer KH, Schwaneberg U, Zacharias M. Rationalizing perhydrolase activity of aryl-esterase and subtilisin Carlsberg mutants by molecular dynamics simulations of the second tetrahedral intermediate state. Theor Chem Acc. 2009 doi: 10.1007/s00214-009-0611-3. [DOI] [Google Scholar]
- 44.Li C, Hassler M, Bugg TDH. Catalytic promiscuity in the α/β-hydrolase superfamily: hydroxamic acid formation, C-C bond formation, ester and thioester hydrolysis in the C-C hydrolase family. ChemBioChem. 2008;9:71–76. doi: 10.1002/cbic.200700428. [DOI] [PubMed] [Google Scholar]
- 45.Caldini G, Cenci G, Manenti R, Morozzi G. The ability of an environmental isolate of Pseudomonas fluorescens to utilize chrysene and other four-ring polynuclear aromatic hydrocarbons. Appl Microbiol Biotechnol. 1998;44:225–229. [Google Scholar]
- 46.Honda K, Kataoka M, Sakuradani E, Shimizu S. Role of Acinetobacter calcoaceticus 3,4-dihydrocoumarin hydrolase in oxidative stress defence against peroxoacids. Eur J Biochem. 2003;270:486–494. doi: 10.1046/j.1432-1033.2003.03407.x. [DOI] [PubMed] [Google Scholar]
- 47.Jankovic´ M, Sinadinovic´-Fišer S. Prediction of the chemical equilibrium constant for peracetic acid formation by hydrogen peroxide. J Amer Oil Chem Soc. 2005;82:301–303. [Google Scholar]; Zhao X, Zhang T, Zhou Y, Liu D. Preparation of peracetic acid from hydrogen peroxide: Part I: Kinetics for peracetic acid synthesis and hydrolysis. J Mol Catal A Chem. 2007;271:246–252. [Google Scholar]
- 48.Chipman D, Barak Z, Schloss J. Biosynthesis of 2-aceto-2-hydroxy acids: acetolactate synthases and acetohydroxyacid synthases. Biochim Biophys Acta. 1998;2:401–419. doi: 10.1016/s0167-4838(98)00083-1. [DOI] [PubMed] [Google Scholar]
Associated Data
This section collects any data citations, data availability statements, or supplementary materials included in this article.