Abstract
Spectral domain optical coherence tomography (SD-OCT) was used to image retinal detachments in vivo, in a murine model of retinal detachment. Subretinal injections of hyaluronic acid (Healon) were delivered to the right eye of seventeen 10–20 week-old C57Bl6 mice. Evaluation of the fundus with an operating microscope and fundus photography were performed. In vivo, non-contact, ultra high resolution SD-OCT imaging was performed on day 0, day 1–2, day 5–6 and day 15–16. The retinal morphology at the edge and in the area of maximal RD was evaluated. Eyes were enucleated for histologic analysis. The retinal detachment was confirmed by microscopy in all mice. The extent of the retinal detachment was evaluated by measuring the height of the retinal detachment. The retinal layers, including the photoreceptor layer, were evaluated. Retinal layers appeared indistinct soon after RD (day 1, 5), particularly over areas of maximal detachment. By day 5 and 15 the external limiting membrane was no longer visible and there was increased reflectivity of the photoreceptor layer and undulation of the outer retina in areas of RD on both SD-OCT and histology. The thickness of the outer nuclear layer and photoreceptor outer segments decreased on day 5 and 15. SD-OCT is a promising technology to follow retinal detachment and outer retinal abnormalities in a murine model.
Introduction
Retinal detachment (RD) is an important cause of visual loss. Surgical repair of RD can re-attach the retina in the majority of cases, but in eyes with a macular detachment the chance of recovering visual acuity 20/50 or better is approximately 20–59% (Burton, 1982; Ross and Kozy, 1998).
Poor visual acuity results from a complex cascade of events which leads to neural remodeling of the retina and gliotic changes. Studies from animal models, with clinical correlation from human RD tissue, demonstrate that RD induces photoreceptor outer segment (OS) degeneration, and macrophage recruitment to the subretinal space (Anderson et al., 1983; Lewis et al., 2002; Hisatomi et al., 2003; Lewis et al., 2005; Nakazawa et al., 2007a; Kaneko et al., 2008) . Complex neuronal remodeling occurs after detachment, including neurite sprouting from second and third order neurons (Lewis et al., 1998; Sethi et al., 2005), photoreceptor outer segment (OS) degeneration (Kroll and Machemer, 1968; Anderson et al., 1983) and apoptosis with thinning of the ONL (Chang et al., 1995; Cook et al., 1995), withdrawal of synaptic terminals from the outer plexiform layer (OPL) followed by thinning of the OPL (Erickson et al., 1983; Sethi et al., 2005), and disruption of the external limiting membrane (ELM) (Fisher et al., 2005; Sethi et al., 2005). Muller glial cells hypertrophy and proliferate, migrate to the outer nuclear layer (ONL) (Kroll and Machemer, 1968; Anderson et al., 1983; Erickson et al., 1983; Anderson et al., 1986), increase their intermediate filament (GFAP and vimentin) production (Lewis et al., 1994; Fisher and Lewis, 2003; Lewis and Fisher, 2003; Sethi et al., 2005) and form scars (Fisher et al., 2005). Muller processes that grow beyond the external limiting membrane (ELM) prevent the re-growth of photoreceptor OS once the retina is re-attached (Anderson et al., 1986).
Spectral domain optical coherence tomography (SD-OCT) is a noninvasive tool that provides high resolution, cross-sectional images of the retina, including the photoreceptors and external limiting membrane. Three-dimensional quantitative information extraction and spatial registration make this technology appealing. Some OCT studies have evaluated the macular structural changes of human RD. These studies have found irregularity of the photoreceptor layer, disruption of the ELM, as well as undulations of the outer retina (Hagimura et al., 2000; Lecleire-Collet et al., 2005; Schocket et al., 2006; Schatz et al., 2007; Lee et al., 2008; Maruko et al., 2009; Nakanishi et al., 2009; Wakabayashi et al., 2009).
SD-OCT has been used to image small animal retina, including from a retinal degeneration mouse model and transgenic murine retinoblastoma tumors (Ruggeri et al., 2007). SD-OCT has been used to quantitate the dimensions of transgenic retinal tumors over time in vivo (Cebulla et al., 2008; Ruggeri et al., 2009). All of the mouse retinal layers can be identified by their position and characteristic reflectivity (i.e., brightness) on SD-OCT (Ruggeri et al., 2007).
The purpose of this study was to utilize high resolution SD-OCT to image retinal detachments in vivo, in a murine model of retinal detachment. Attention was directed to assessing the outer retina as well as determining the maximal height of the RD.
Methods
Retinal Detachment Surgery
IACUC approval was obtained. Mice were anesthetized with intraperitoneal injection of ketamine (90mg/kg) and xylazine (10mg/kg). Subretinal injections of approximately 5 microliters of hyaluronic acid (Healon, 10mg/ml; AMO, Santa Ana, CA) were delivered to the right eye of seventeen 10–20 week-old C57Bl6 mice. Briefly, a 30g needle was used to make the entry site for a 33g, 19mm custom Hamilton needle (Hamilton Company, Reno, NV), approximately 2 mm posterior to the limbus in the superotemporal quadrant. Anterior chamber tap with a 30g needle was performed to reduce the intraocular pressure and then the subretinal Healon injection was performed with the aid of an operating microscope to create a total or near-total RD. Fundus photography was performed to document the detachment.
SD-OCT and Histology
In vivo, non-contact, ultra high resolution SD-OCT imaging with a custom made system in our institute (Ruggeri et al., 2007) was performed on day 0, day 1–2, day 5–6, day 15–16. The retinal morphology at the edge and in the area of maximal RD was evaluated. Following euthanasia by cervical dislocation, eyes were enucleated for histologic analysis at timepoints corresponding with SD-OCT imaging. Eyes were fixed with 4% paraformaldehyde, paraffin embedded, sectioned into 40 serial 8µm sections from different levels of the eye and stained with H&E.
Image Analysis
To calculate the height of the detachment by SD-OCT, images were obtained in the area of maximal retinal detachment that was observable by SD-OCT screening. The calibrated axial resolution of the SD-OCT system was about 3µm in retinal tissue (Ruggeri et al., 2007). The 3D SD-OCT scan consists of 512 × 128 (horizontal × vertical) depth scans covering an area of 1 × 1 mm2 on the mouse retina. The displayed depth of the SD-OCT images was 1024 pixels, which corresponds to 1.22 mm after correction by the refractive index of 1.35 mm for the mouse retina. The width of the scan corresponds to 1 mm on the retina. The height from the apex of the RPE to the outer segments of the maximal RD was measured in the SD-OCT images using Corel Draw X4. Proportional analysis was used to convert the pixels to microns. Similarly, retinal thickness measurements were obtained using Corel Draw X4 for histologic and SD-OCT images. The histologic images photographed at 40× magnification were used for analysis. A standard digital photograph of a 1 mm ruler was acquired at 40× magnification and measured with Corel Draw software. Proportional analysis using the standard measurement was used to determine the thickness of retinal structures in microns based on the width of the SD-OCT image corresponding to 1 mm and the height corresponding to 1.22 mm. The structures measured included total retinal thickness (from nerve fiber layer to the base of the photoreceptor outer segment), inner retinal thickness (from nerve fiber layer to the edge of the outer plexiform layer), outer nuclear layer, and photoreceptor layer (inner plus outer segments of photoreceptors). Four to eight measurements spread evenly across the histologic and SD-OCT digital images were taken for each structure and the measurements from the mice for each the group were averaged. Areas that appeared to be cut at an oblique angle were avoided. Retinal measurements were determined on areas of attached retina with normal appearing histology on light microscopy that were away from areas of retinal detachment as an internal control.
Statistical Analysis
Statistical analysis of the change in height of the RD and of the retinal structure thicknesses (e.g., total retinal thickness, thickness of inner retina, outer nuclear layer (ONL), photoreceptor layer (PR)) over time were evaluated using a mixed model analysis of variance (ANOVA) to account for the correlation between repeated measures made on the same animal. If the initial retinal structure measurements showed a significant difference (p≤0.05) then repeated measures analysis was used to determine statistical significance between the groups. A p-value ≤0.05 was considered statistically significant. The mean height of retinal detachment and of the retinal structures was calculated and error bars represent standard deviation (SD).
Results
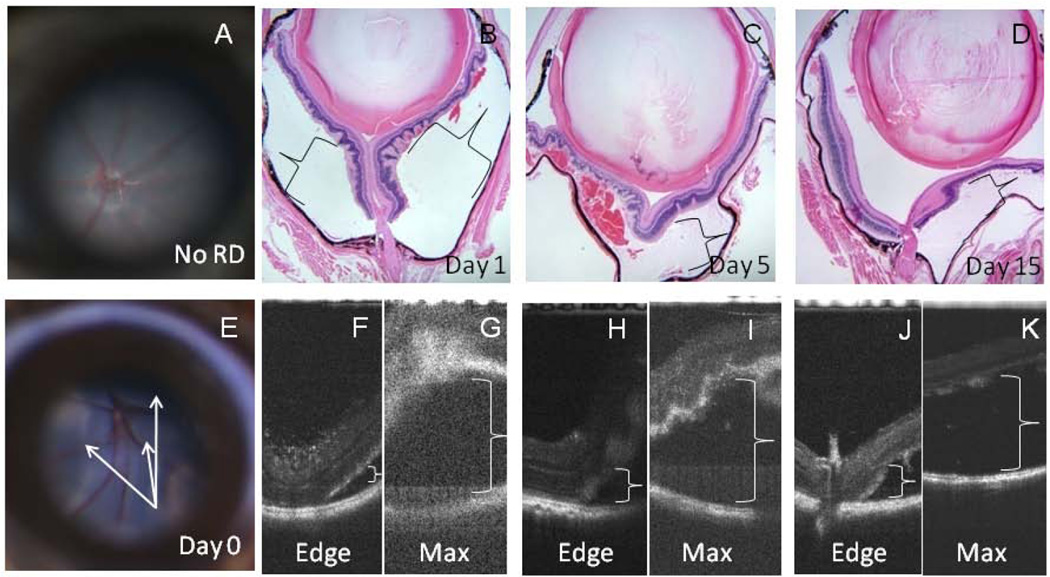
Retinal detachments were present in all animals. Areas corresponding to the edge and maximal height of the RD were imaged by SD-OCT. Representative histology (Figure 1 B–D) and SD-OCT images (Figure 1 F–K) are shown for different timepoints (days 1, 5, and 15) following RD. The retinal layers appeared indistinct on SD-OCT early after RD creation (day 1, Figure 1B, F, G), particularly over areas of maximal detachment and the quality of the images was poor with high levels of noise (Figure 1G). For example, the maximally detached retina (pictured in the upper part of the image in Figure 1G) appears mostly white and fuzzy without crisp, alternating lighter and darker layers that represent the plexiform or nuclear layers, respectively. In contrast, the layers of the retina are much more distinct in the SD-OCT image at the left side of Figure 1H in the attached retina adjacent to the detachment in a day 5 animal. With time, the image quality improved and retinal layers became somewhat more distinct in the area of detachment (Figure 1I (day 5), K (day 15)).
Figure 1.
RDs were confirmed by microscopy in all mice. Representative fundus photographs of a mouse with no RD (A) and day 0 RD (E) are shown. H&E sections are shown with representative histopathology of RDs 1, 5, and 16 days duration (B–D,×40 magnification). Corresponding SD-OCT images taken prior to the enucleation of each animal are shown (day 1 (F, G), day5 (H, I), day 16 (J, K)). Areas corresponding to the edge (F, H, J) and maximal height ( G, I, K) of the RD at each timepoint are shown. Retinal layers appeared indistinct soon after RD (day 1 (B, F, G)), particularly over areas of maximal detachment (G). Detached areas are denoted with brackets. The detached retina at day 16 (D, K) appears thinner than day 1 (B, G) or day 5 retina (C, I).
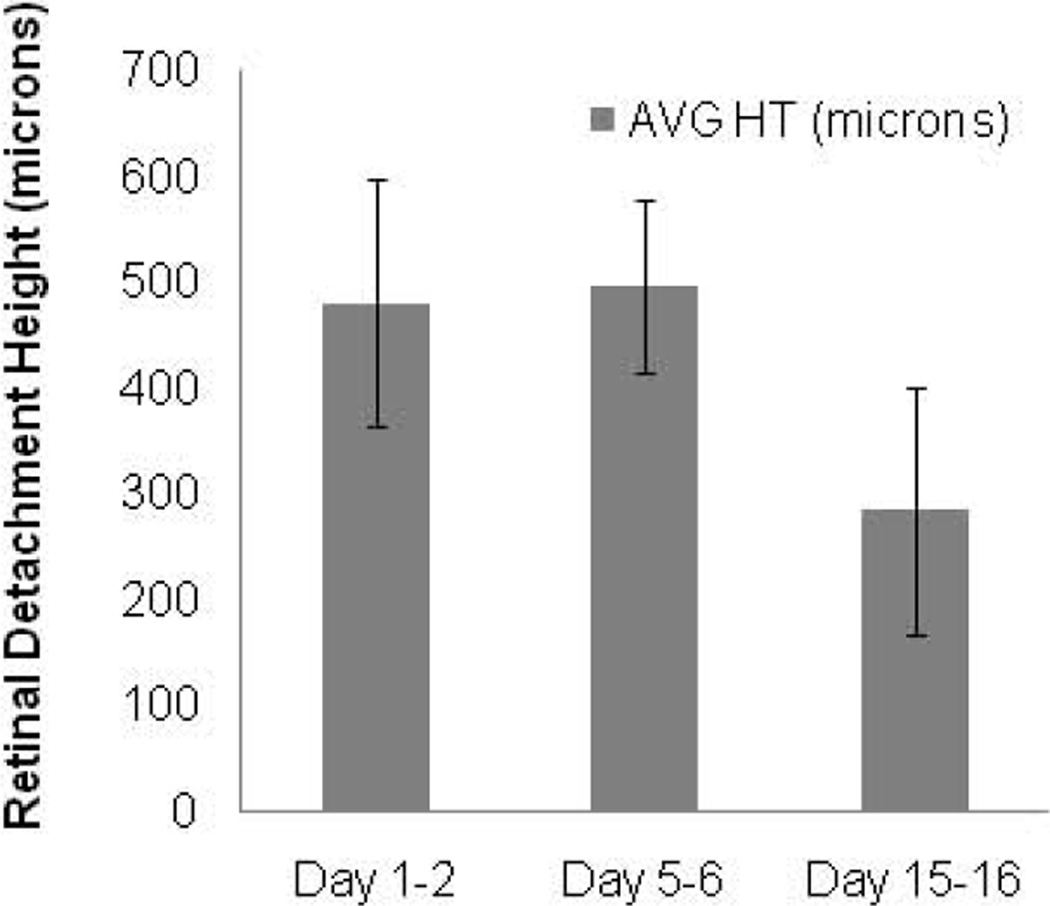
The average maximal height of the RD measured 482 microns day 1–2, 497 microns day 5–6, and 285 microns day 15–16. The decrease in height approached but did not achieve statistical significance (p=0.095, mixed model ANOVA) (Figure 2). The height could not be determined from day 0 mice due to poor image quality. Other limitations to SD-OCT imaging included cataract formation over time related to damage to the lens during Healon injection (n=3), and a smaller, peripheral initial RD (n=3) which could not be found with SD-OCT on the subsequent day 5 or 15 imaging timepoints.
Figure 2.
Maximal RD height decreases over time. Average maximal height of separation of the retina from the retinal pigment epithelium in the area of detachment measured by SD-OCT is graphically displayed (n=6 day 1–2, n=3 day 5–6, n=3 day 15–16; error bars represent SD).
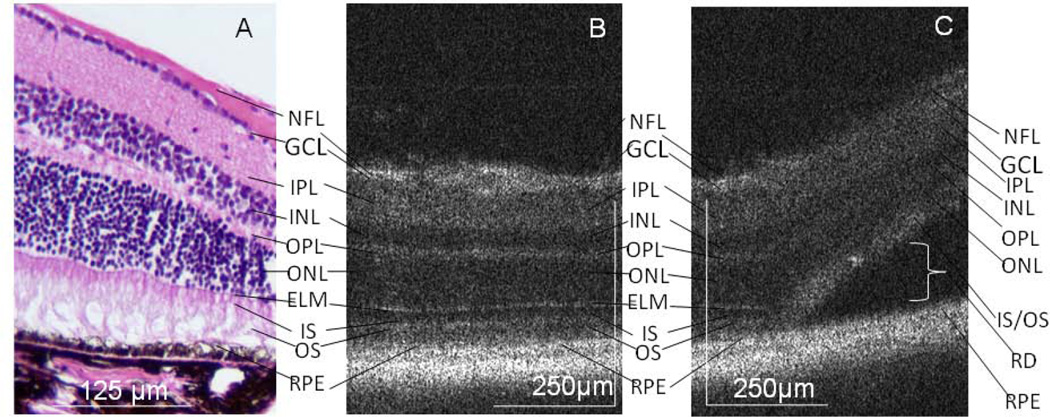
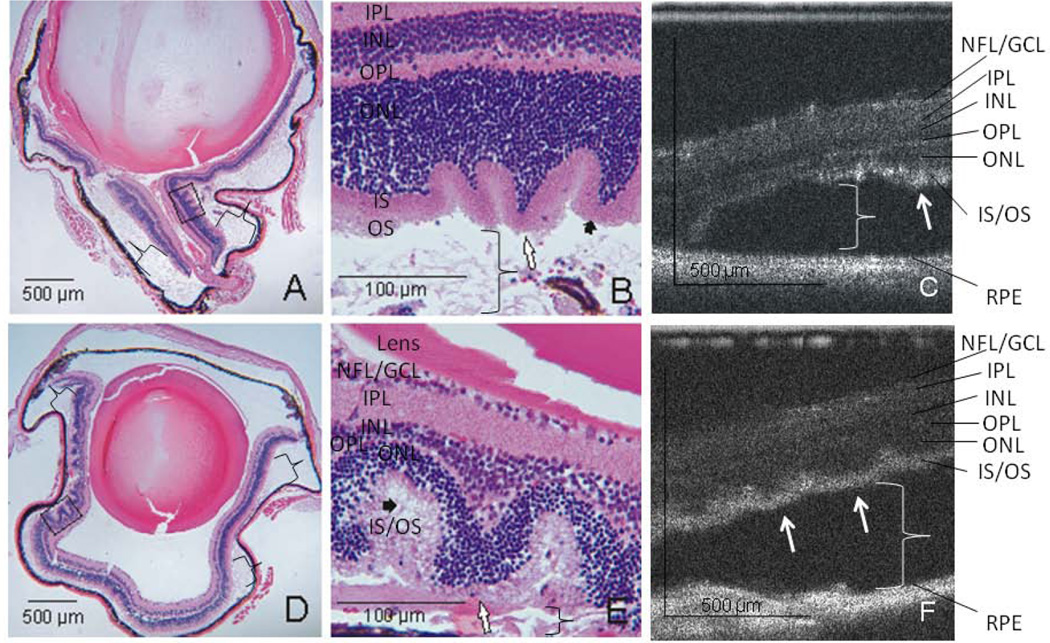
In areas of attached retina, the outer retinal structures of the mouse retina are well visualized on both histology and SD-OCT, including the outer nuclear layer (ONL), external limiting membrane (ELM), photoreceptor inner segment/outer segment junction (IS/OS), and retinal pigment epithelium (RPE) complex (Figure 3). In the area of the RD, the ELM is no longer detectable, the IS /OS layers are indistinct and there is increased hyper-reflectivity of this region on SD-OCT (Figure 3). The photoreceptor layer is characteristically irregular in the area of detachment, with undulations of the outer retina (Figure 4). Similarly, the ELM is no longer detectable on histologic analysis and there is OS degeneration on days 5–6 and 15–16 (Figure 4).
Figure 3.
ELM and photoreceptor IS/OS changes on SD-OCT. In attached areas, outer retinal structures of the mouse retina are well visualized on histology (A, Magnification × 200) and the corresponding SD-OCT (B). Layers are labeled: Nerve fiber layer (NFL), ganglion cell layer (GCL), inner plexiform layer (IPL), inner nuclear layer (INL), outer plexiform layer (OPL), outer nuclear layer (ONL), external limiting membrane (ELM), photoreceptor inner segment (IS) outer segment (OS), retinal pigment epithelium (RPE). In the area of RD, the ELM in not visible, the IS and OS layers are indistinct and there is increased hyper-reflectivity of this region on SD-OCT (C, representative animal day 15). The bracket labels the subretinal space. Note that the nuclear layers are dark on SD-OCT.
Figure 4.
Undulation of the outer retina. Representative examples of photoreceptor and outer nuclear layer undulation, undetectable ELM and outer segment degeneration seen at day 5 (A, H&E histology at × 40 magnification (a black box denotes the area shown in B at × 200 magnification) and C, the SD-OCT image of the same animal). Brackets denote the subretinal space in areas of detachment. White arrows denote points of retinal undulation and short, black arrows denote photoreceptor outer segment degeneration. Similar results are seen at day 15 (D, representative histology × 40 magnification, E, × 200 magnification of the boxed area from D, and F, SD-OCT image).
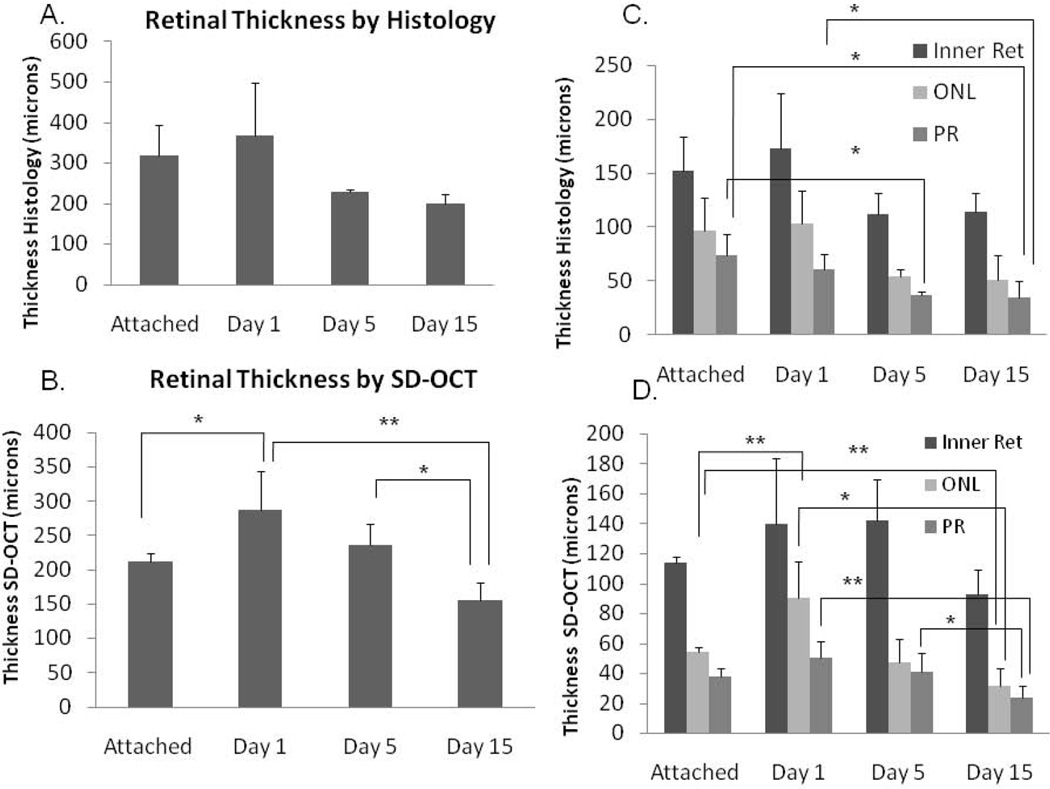
The thickness of the retinal structures was evaluated by SD-OCT and histology. The thickness of the total retina decreased with time after detachment (Figure 5 A, B). The decrease was statistically significant by SD-OCT (p = 0.008); however, the decrease by histology approached but did not reach statistical significance due to greater measurement variability (ANOVA, p= 0.09). The thickness of the inner retina did not significantly change by either histology or SD-OCT (p=0.306); however, the outer retinal structures significantly decreased in thickness with time after detachment (Figure 5 C, D). On histology, the thickness of the photoreceptor outer segments was significantly decreased at day 5 and day 15 compared to attached retina (p=0.053 and p=0.020, respectively) and day 15 was decreased compared to day 1 (p=0.029). There was a trend toward a significant decrease in the ONL thickness with RD (p=0.068). On SD-OCT, the thickness of the ONL was significantly decreased at day 15 compared to attached retina (p= 0.005) and day 1 retina (p=0.027). The photoreceptor outer segments were borderline significantly shorter at day 15 compared to attached retina (p=0.060). Day 15 photoreceptor outer segments were significantly shorter than day 1 or day 5 segments (p = 0.003 and 0.016, respectively). The ONL was thicker in the day 1 samples than the attached retina samples (p=0.005).
Figure 5.
Retinal thickness and outer retinal thickness decreases with time after detachment. Total retinal thickness was quantitated by H&E histology (A) and SD-OCT (B). Changes in retinal structure thickness were determined for inner retina (Inner Ret), ONL, and PR segments by histology (C) and SD-OCT (D). Error bars represent SD. Brackets label statistically significant differences between groups: * Represents p≤0.05 and ** represents p≤0.01.
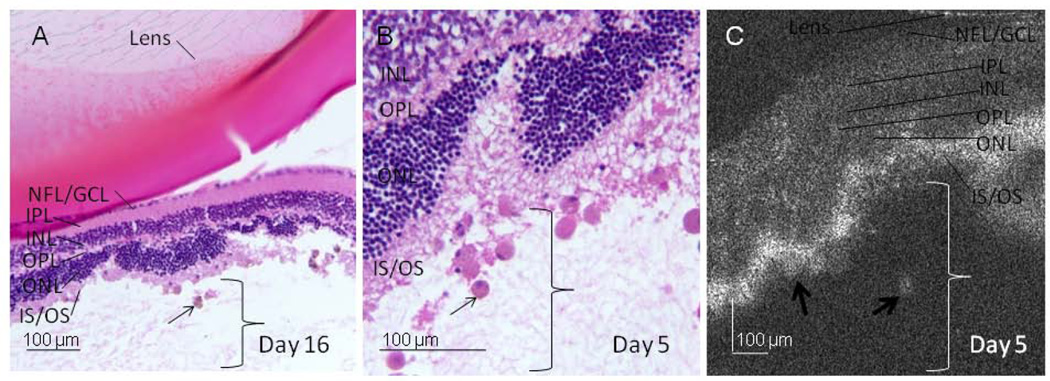
Consistent with reports of macrophage infiltration in areas of RD (Anderson et al., 1983; Hisatomi et al., 2003; Lewis et al., 2005; Nakazawa et al., 2007a; Kaneko et al., 2008) , an immune infiltrate is present in the subretinal space and photoreceptor layer in day 5 and day 15 samples (Figure 6). On SD-OCT, round, high reflective structures (approximately 40 microns wide) are present in these samples, which are morphologically similar to but larger than the immune cells (approximately 20 microns wide) seen on histology. The SD-OCT cannot currently distinguish individual cells.
Figure 6.
Immune infiltrate present in experimental RD. An immune infiltrate (arrows) is present in the subretinal space and photoreceptor layer in day 5–6 and day 15–16 samples (A, ×100 magnification from representative day 16 eye). Correlation of the histology (B, ×400 magnification) and SD-OCT (C) from a representative day 5 eye shows the undulation of the ONL, undetectable ELM, and high reflective structures (thick arrows) morphologically similar to, but larger than immune cells seen on histology (thin arrows). Brackets label the subretinal space.
Discussion
This is the first study of a murine model of retinal detachment where SD-OCT and histologic correlation have been performed. The study quantitated the maximal RD height, which decreased nonsignificantly over time. This type of analysis may be helpful since RD height has been correlated with poorer visual outcome in humans (Hagimura et al., 2000; Ross et al., 2005).
Another potentially clinically relevant measure is the thickness of the outer retinal structures, i.e., the ONL, which contains the cell bodies of photoreceptors, and the photoreceptor outer segments. The change in the thickness of outer retinal structures has been reported to reflect the neurodegenerative changes that occur following RD and are thought to correlate with retinal function (Erickson et al., 1983; Nakazawa et al., 2007b). The ability to perform in vivo analysis of the outer retina with SD-OCT may be helpful in evaluating potential neuronal survival therapies for RD in this model in the future. The total retinal thickness as well as the thickness of the inner retina, ONL, and photoreceptor outer segments was measured herein by SD-OCT and histology. The thickness of the total retina decreased with time after the onset of RD. The change in retinal thickness over time was explained by outer retinal changes; the thickness of the inner retina did not significantly change over time on both histology and SD-OCT. The thickness of the ONL and PR outer segments did decrease significantly with time after detachment.
Although the trends of change in retinal thickness were the same between histology and SD-OCT, there were some minor differences. The histologic studies had more variability than SD-OCT studies. This variability may be explained by the histology measurements including a wider span of retina (including some posterior and peripheral retinal measurements) since measurements were obtained from the photograph at 40× magnification which included a larger portion of the retina than in the SD-OCT image. In future studies, measurements should be focused on the same general region of the retina for improved evaluation. In addition, the histologic retinal measurements were somewhat thicker than the SD-OCT measurements. This could again reflect that the SD-OCT measurements tended to sample somewhat more peripheral areas of the retina, which are thinner than more posterior regions. In addition, different individual animals were used for many of the histology and SD-OCT timepoints. Differences in RD height between different animals could yield differences in retinal structure thicknesses and these differences would be more evident with a relatively small sample size.
Surprisingly, the day 1 retina measured thicker than the attached control retina on histology and SD-OCT. This increase could reflect transient retinal edema at day 1 related to the injection of Healon or could be due to the fact that the attached retina in this study was internal control retina from eyes with a partial RD. The thickness of the attached retina, particularly the outer retina could be decreased if it had been transiently detached compared to control retina that had never been treated.
In this study, SD-OCT documented morphologic details of the neuronal remodeling that occurs following RD, including disruption of the external limiting membrane, increased photoreceptor layer reflectivity, and undulations of the outer retina in areas of retinal detachment. These findings are similar to OCT studies of human RD which have also documented undulations of the outer retina and abnormalities of the photoreceptor layer (Hagimura et al., 2000; Lee et al., 2008; Nakanishi et al., 2009; Wakabayashi et al., 2009). The ELM consists of a series of adherens junctions between Muller glial cells and photoreceptors. The ELM was visible with both light microscopic and SD-OCT imaging analysis in areas where the retina was attached. However, in detached areas, the ELM was no longer visible. This change may be due to disruption of the ELM, likely from the hypertrophy and migration of Muller cells during neuronal remodeling in areas of RD (Lewis et al., 2002; Verardo et al., 2008). We speculate that the undulations of the outer retina may be due to the loss of Muller glial structural supports. An alternate explanation is retinal folding due to the contraction of RD volume over time. However, this hypothesis seems less likely since similar findings are found in human RDs in which RD volume does not typically decrease.
The significance of the hyper-reflectivity seen in the photoreceptor layer in detached retina on the SD-OCT is unclear. The changes in reflectivity could be due to changes in orientation of the retinal structures (e.g., the linear arrangement of the photoreceptors becomes more irregular in areas of RD, especially with degeneration of the outer segments, which causes more scatter in the reflected light and a brighter appearance on SD-OCT). In addition, changes in the refractive index of a tissue, e.g., by changes in chemical composition, can cause changes in reflectivity with increased scattering of light. Since the increase in reflectivity was present at day 1 after detachment, the alignment of the photoreceptors may be the most important factor. It will be interesting to evaluate the reflectivity of this layer if in future studies the outer segment degeneration can be prevented in areas of RD.
While the resolution provided by SD-OCT is quite good, it is somewhat limited in the detail that can be obtained from some of the retinal layers, especially the OPL, ganglion cell layer and nerve fiber layer. This may limit the usefulness of imaging the second-order and third-order neuronal remodeling that occurs in experimental and human RD (Lewis et al., 1998; Sethi et al., 2005).
Finally, an immunologic component appears to be important in the neuronal remodeling process of an RD. Other reports using this model have identified an immune infiltrate predominantly composed of macrophages and microglia by histologic analysis as well as by lectin staining and immunostaining for monocyte/macrophage/microglial markers (Anderson et al., 1983; Fisher and Lewis, 2003; Hisatomi et al., 2003; Lewis et al., 2005; Nakazawa et al., 2007a; Nakazawa et al., 2007b; Kaneko et al., 2008). Polymorphonuclear cells have also been described in some reports (Anderson et al., 1983). The importance of these cells, predominantly macrophages, includes promoting photoreceptor apoptosis in experimental RD (Nakazawa et al., 2007a) and the phagocytosis of apoptotic photoreceptor debris in the subretinal space (Hisatomi et al., 2003). Similar to previous reports, an immune infiltrate was present in the photoreceptor layer and subretinal fluid at days 5–6 and 15–16 in the present study. It is not possible to conclude whether the high reflective, cellular-appearing structures on SD-OCT represent clusters of these infiltrating cells. Future study to improve the SD-OCT technology could use adaptive optics to improve the lateral resolution of the system.
Acknowledgments
We thank Magda Celdran for histology preparation and Dr. Sander Dubovy and Dr. Maricel Reyes for histology photography. This work was supported in part by Research to Prevent Blindness, New York, New York.
Footnotes
Publisher's Disclaimer: This is a PDF file of an unedited manuscript that has been accepted for publication. As a service to our customers we are providing this early version of the manuscript. The manuscript will undergo copyediting, typesetting, and review of the resulting proof before it is published in its final citable form. Please note that during the production process errors may be discovered which could affect the content, and all legal disclaimers that apply to the journal pertain.
References
- Anderson DH, Stern WH, Fisher SK, Erickson PA, Borgula GA. Retinal detachment in the cat: The pigment epithelial-photoreceptor interface. Invest. Ophthalmol. Vis. Sci. 1983;24:906–926. [PubMed] [Google Scholar]
- Anderson DH, Guerin CJ, Erickson PA, Stern WH, Fisher SK. Morphological recovery in the reattached retina. Invest. Ophthalmol. Vis. Sci. 1986;27:168–183. [PubMed] [Google Scholar]
- Burton TC. Recovery of visual acuity after retinal detachment involving the macula. Trans Am Ophthalmol Soc. 1982;80:475–497. [PMC free article] [PubMed] [Google Scholar]
- Cebulla CM, Jockovich ME, Boutrid H, Pina Y, Ruggeri M, Jiao S, Bhattacharya SK, Feuer WJ, Murray TG. Lack of effect of SU1498, an inhibitor of vascular endothelial growth factor receptor-2, in a transgenic murine model of retinoblastoma. Open Ophthalmol J. 2008;2:62–67. doi: 10.2174/1874364100802010062. [DOI] [PMC free article] [PubMed] [Google Scholar]
- Chang CJ, Lai WW, Edward DP, Tso MO. Apoptotic photoreceptor cell death after traumatic retinal detachment in humans. Arch Ophthalmol. 1995;113:880–886. doi: 10.1001/archopht.1995.01100070054025. [DOI] [PubMed] [Google Scholar]
- Cook B, Lewis GP, Fisher SK, Adler R. Apoptotic photoreceptor degeneration in experimental retinal detachment. Invest Ophthalmol Vis Sci. 1995;36:990–996. [PubMed] [Google Scholar]
- Erickson PA, Fisher SK, Anderson DH, Stern WH, Borgula GA. Retinal detachment in the cat: The outer nuclear and outer plexiform layers. Invest. Ophthalmol. Vis. Sci. 1983;24:927–942. [PubMed] [Google Scholar]
- Fisher SK, Lewis GP. Muller cell and neuronal remodeling in retinal detachment and reattachment and their potential consequences for visual recovery: A review and reconsideration of recent data. Vision Res. 2003;43:887–897. doi: 10.1016/s0042-6989(02)00680-6. [DOI] [PubMed] [Google Scholar]
- Fisher SK, Lewis GP, Linberg KA, Verardo MR. Cellular remodeling in mammalian retina: Results from studies of experimental retinal detachment. Prog Retin Eye Res. 2005;24:395–431. doi: 10.1016/j.preteyeres.2004.10.004. [DOI] [PubMed] [Google Scholar]
- Hagimura N, Suto K, Iida T, Kishi S. Optical coherence tomography of the neurosensory retina in rhegmatogenous retinal detachment. Am J Ophthalmol. 2000;129:186–190. doi: 10.1016/s0002-9394(99)00314-1. [DOI] [PubMed] [Google Scholar]
- Hisatomi T, Sakamoto T, Sonoda KH, Tsutsumi C, Qiao H, Enaida H, Yamanaka I, Kubota T, Ishibashi T, Kura S, Susin SA, Kroemer G. Clearance of apoptotic photoreceptors: Elimination of apoptotic debris into the subretinal space and macrophage-mediated phagocytosis via phosphatidylserine receptor and integrin alphavbeta3. Am J Pathol. 2003;162:1869–1879. doi: 10.1016/s0002-9440(10)64321-0. [DOI] [PMC free article] [PubMed] [Google Scholar]
- Kaneko H, Nishiguchi KM, Nakamura M, Kachi S, Terasaki H. Characteristics of bone marrow-derived microglia in the normal and injured retina. Invest Ophthalmol Vis Sci. 2008;49:4162–4168. doi: 10.1167/iovs.08-1738. [DOI] [PubMed] [Google Scholar]
- Kroll AJ, Machemer R. Experimental retinal detachment in the owl monkey. 3. Electron microscopy of retina and pigment epithelium. Am J Ophthalmol. 1968;66:410–427. doi: 10.1016/0002-9394(68)91524-9. [DOI] [PubMed] [Google Scholar]
- Lecleire-Collet A, Muraine M, Menard JF, Brasseur G. Predictive visual outcome after macula-off retinal detachment surgery using optical coherence tomography. Retina. 2005;25:44–53. doi: 10.1097/00006982-200501000-00006. [DOI] [PubMed] [Google Scholar]
- Lee SY, Joe SG, Kim JG, Chung H, Yoon YH. Optical coherence tomography evaluation of detached macula from rhegmatogenous retinal detachment and central serous chorioretinopathy. Am J Ophthalmol. 2008;145:1071–1076. doi: 10.1016/j.ajo.2008.01.031. [DOI] [PubMed] [Google Scholar]
- Lewis GP, Guerin CJ, Anderson DH, Matsumoto B, Fisher SK. Rapid changes in the expression of glial cell proteins caused by experimental retinal detachment. Am J Ophthalmol. 1994;118:368–376. doi: 10.1016/s0002-9394(14)72962-9. [DOI] [PubMed] [Google Scholar]
- Lewis GP, Linberg KA, Fisher SK. Neurite outgrowth from bipolar and horizontal cells after experimental retinal detachment. Invest. Ophthalmol. Vis. Sci. 1998;39:424–434. [PubMed] [Google Scholar]
- Lewis GP, Charteris DG, Sethi CS, Fisher SK. Animal models of retinal detachment and reattachment: Identifying cellular events that may affect visual recovery. Eye. 2002;16:375–387. doi: 10.1038/sj.eye.6700202. [DOI] [PubMed] [Google Scholar]
- Lewis GP, Fisher SK. Up-regulation of glial fibrillary acidic protein in response to retinal injury: Its potential role in glial remodeling and a comparison to vimentin expression. Int Rev Cytol. 2003;230:263–290. doi: 10.1016/s0074-7696(03)30005-1. [DOI] [PubMed] [Google Scholar]
- Lewis GP, Sethi CS, Carter KM, Charteris DG, Fisher SK. Microglial cell activation following retinal detachment: A comparison between species. Mol Vis. 2005;11:491–500. [PubMed] [Google Scholar]
- Maruko I, Iida T, Sekiryu T, Saito M. Morphologic changes in the outer layer of the detached retina in rhegmatogenous retinal detachment and central serous chorioretinopathy. Am J Ophthalmol. 2009;147:489–494. e481. doi: 10.1016/j.ajo.2008.09.030. [DOI] [PubMed] [Google Scholar]
- Nakanishi H, Hangai M, Unoki N, Sakamoto A, Tsujikawa A, Kita M, Yoshimura N. Spectral-domain optical coherence tomography imaging of the detached macula in rhegmatogenous retinal detachment. Retina. 2009;29:232–242. doi: 10.1097/IAE.0b013e31818bcd30. [DOI] [PubMed] [Google Scholar]
- Nakazawa T, Hisatomi T, Nakazawa C, Noda K, Maruyama K, She H, Matsubara A, Miyahara S, Nakao S, Yin Y, Benowitz L, Hafezi-Moghadam A, Miller JW. Monocyte chemoattractant protein 1 mediates retinal detachment-induced photoreceptor apoptosis. Proc Natl Acad Sci U S A. 2007a;104:2425–2430. doi: 10.1073/pnas.0608167104. [DOI] [PMC free article] [PubMed] [Google Scholar]
- Nakazawa T, Takeda M, Lewis GP, Cho KS, Jiao J, Wilhelmsson U, Fisher SK, Pekny M, Chen DF, Miller JW. Attenuated glial reactions and photoreceptor degeneration after retinal detachment in mice deficient in glial fibrillary acidic protein and vimentin. Invest Ophthalmol Vis Sci. 2007b;48:2760–2768. doi: 10.1167/iovs.06-1398. [DOI] [PMC free article] [PubMed] [Google Scholar]
- Ross W, Lavina A, Russell M, Maberley D. The correlation between height of macular detachment and visual outcome in macula-off retinal detachments of < or = 7 days' duration. Ophthalmology. 2005;112:1213–1217. doi: 10.1016/j.ophtha.2005.01.040. [DOI] [PubMed] [Google Scholar]
- Ross WH, Kozy DW. Visual recovery in macula-off rhegmatogenous retinal detachments. Ophthalmology. 1998;105:2149–2153. doi: 10.1016/S0161-6420(98)91142-3. [DOI] [PubMed] [Google Scholar]
- Ruggeri M, Wehbe H, Jiao S, Gregori G, Jockovich ME, Hackam A, Duan Y, Puliafito CA. In vivo three-dimensional high-resolution imaging of rodent retina with spectral-domain optical coherence tomography. Invest Ophthalmol Vis Sci. 2007;48:1808–1814. doi: 10.1167/iovs.06-0815. [DOI] [PubMed] [Google Scholar]
- Ruggeri M, Tsechpenakis G, Jiao S, Jockovich ME, Cebulla C, Hernandez E, Murray TG, Puliafito CA. Retinal tumor imaging and volume quantification in mouse model using spectral-domain optical coherence tomography. Opt Express. 2009;17:4074–4083. doi: 10.1364/oe.17.004074. [DOI] [PMC free article] [PubMed] [Google Scholar]
- Schatz P, Holm K, Andreasson S. Retinal function after scleral buckling for recent onset rhegmatogenous retinal detachment: Assessment with electroretinography and optical coherence tomography. Retina. 2007;27:30–36. doi: 10.1097/01.iae.0000256659.71864.83. [DOI] [PubMed] [Google Scholar]
- Schocket LS, Witkin AJ, Fujimoto JG, Ko TH, Schuman JS, Rogers AH, Baumal C, Reichel E, Duker JS. Ultrahigh-resolution optical coherence tomography in patients with decreased visual acuity after retinal detachment repair. Ophthalmology. 2006;113:666–672. doi: 10.1016/j.ophtha.2006.01.003. [DOI] [PMC free article] [PubMed] [Google Scholar]
- Sethi CS, Lewis GP, Fisher SK, Leitner WP, Mann DL, Luthert PJ, Charteris DG. Glial remodeling and neural plasticity in human retinal detachment with proliferative vitreoretinopathy. Invest Ophthalmol Vis Sci. 2005;46:329–342. doi: 10.1167/iovs.03-0518. [DOI] [PubMed] [Google Scholar]
- Verardo MR, Lewis GP, Takeda M, Linberg KA, Byun J, Luna G, Wilhelmsson U, Pekny M, Chen DF, Fisher SK. Abnormal reactivity of muller cells after retinal detachment in mice deficient in gfap and vimentin. Invest Ophthalmol Vis Sci. 2008;49:3659–3665. doi: 10.1167/iovs.07-1474. [DOI] [PMC free article] [PubMed] [Google Scholar]
- Wakabayashi T, Oshima Y, Fujimoto H, Murakami Y, Sakaguchi H, Kusaka S, Tano Y. Foveal microstructure and visual acuity after retinal detachment repair: Imaging analysis by fourier-domain optical coherence tomography. Ophthalmology. 2009;116:519–528. doi: 10.1016/j.ophtha.2008.10.001. [DOI] [PubMed] [Google Scholar]


