Abstract
When individual dsDNA molecules are stretched beyond their B-form contour length, they reveal a structural transition in which the molecule extends 1.7 times its contour length. The nature of this transition is still a subject of debate. In the first model, the DNA helix unwinds and combined with the tilting of the base pairs (which remain intact), results in a stretched form of DNA (also known as S-DNA). In the second model the base pairs break resulting effectively in two single-strands, which is referred to as force-induced melting. Here a combination of optical tweezers force spectroscopy with fluorescence microscopy was used to study the structure of dsDNA in the overstretching regime. When dsDNA was stretched in the presence of 10 nM YOYO-1 an initial increase in total fluorescence intensity of the dye–DNA complex was observed and at an extension where the dsDNA started to overstretch the fluorescence intensity leveled off and ultimately decreased when stretched further into the overstretching region. Simultaneous force spectroscopy and fluorescence polarization microscopy revealed that the orientation of dye molecules did not change significantly in the overstretching region (78.0°± 3.2°). These results presented here clearly suggest that, the structure of overstretched dsDNA can be explained accurately by force induced melting.
INTRODUCTION
The mechanical properties of single double-stranded DNA (dsDNA) (torsionally unconstrained) molecules have been studied using various single molecule manipulation techniques such as magnetic tweezers, atomic force microscopy and optical tweezers (1–4). The force extension curve of the dsDNA obtained at physiological conditions shows a distinct overstretching plateau at ∼65 pN, at which the molecule can be stretched to 1.7 times its contour length by changing the force only by 2–5 pN (4). The force-extension curve of the dsDNA up to 50 pN, is accurately described by an extensible worm like chain model (5). The local structure of the dsDNA in this regime resembles that of B-DNA (Figure 1A). The structure of the dsDNA in the overstretching region, however, is still a subject of debate (3,4,6,7). A model presented by Cluzel et al. (3) and Smith et al. (4) describes the structure of the dsDNA in the overstretching region as a stretched ladder (Figure 1B) in which the base pairs are tilted with respect to the helical axis. In this structure, named ‘S-DNA’, the hydrogen bonds between the base pairs on either strand remain intact and are expected to break at much higher forces (above 120 pN) (8). A second model proposed by Rouzina and Bloomfield (6,7) describes the dsDNA as actually melting under the influence of force. In the overstretching region the hydrogen bonds between the base pairs break progressively as dsDNA is further stretched resulting in regions of melted DNA separated by stretches of double helical DNA resembling the B-DNA structure (Figure 1C). At this moment there are no direct experimental evidences for the S-DNA structure. Various modeling and simulation studies assuming this B–S transition in the DNA were not able to reproduce the features of the experimental force extension curve of dsDNA (3,9). Experimental data on the mechanical properties of dsDNA as a function of various solution conditions such as pH, ionic strength and temperature (10–12) and the interaction of overstretched dsDNA with glyoxal (13), and multicolor single molecule fluorescence imaging (14) support the force-induced melting hypothesis.
Figure 1.
Pictorial representations of different forms of dsDNA. (A) B-DNA which is the structure of the dsDNA below 50 pN. (B) Stretched DNA (S-DNA) and (C) partially melted DNA are suggested structures of the dsDNA in the overstretching region.
Here, we have measured the mechanical properties and the total amount of fluorescence of single dsDNA–dye complexes as a function of the YOYO-1 concentration in the surrounding buffer using optical tweezers force spectroscopy combined with fluorescence microscopy. At 10 and 20 nM YOYO-1, the force extension behavior of the complex was only slightly different from that when no dye was added. This enabled the use of the fluorescent dyes at this concentration as a reporter for the structural properties of dsDNA. At concentrations of 40 nM and higher the characteristic overstretching plateau could not be discerned anymore, indicating a significant effect on the mechanical properties.
Simultaneously recorded fluorescence images of the single suspended complex while being stretched and relaxed were performed at concentrations of 10 and 100 nM YOYO-1. These data provided real-time information on the interaction of YOYO-1 with the dsDNA molecule under tension. In the case 10 nM YOYO-1, as the molecule was stretched, the total amount of fluorescence initially showed an increase. When the molecule started to overstretch, the fluorescence started to flatten off, and even showed a slight decrease, as the molecule was stretched to the end of the overstretching plateau. At a 100 nM dye concentration, where the overstretching plateau could not be discerned, the total amount of the fluorescence was continuously increasing as the complex was stretched. Finally, we performed simultaneous force spectroscopy and fluorescence polarization microscopy on the dsDNA–YOYO-1 complex at 10 nM YOYO-1, to get more insight into the orientation of the base pairs in the dsDNA during overstretching. The orientation of the YOYO-1 molecules with respect to the dsDNA helical axis remained constant (78°) when the DNA was stretched from the enthalpic stretching regime into the overstretching regime. From this we conclude that the orientation of the base pairs in the overstretched DNA is not significantly different from that in B-DNA. This final result is in contradiction with the assumption for S-DNA, which is that the base pairs are tilted. The fluorescence intensity changes measured during the extension and relaxation cycles suggest that the structure of the overstretched dsDNA can be explained by the melting of the dsDNA helix as induced by the force applied.
MATERIALS AND METHODS
Force extension experiments on the dsDNA and dsDNA–YOYO-1 complex was performed using single beam optical tweezers as described in refs. (15,16) (Fig. 2). Experiments were performed in a buffer solution containing 10 mM Tris–HCl, pH 7.5, 1 mM ethylene-diaminetetraacetic acid (TE) supplemented with 150 mM NaCl and 0.05% NaN3. For experiments with YOYO-1, the required concentration of dye is added to the above-mentioned buffer. This buffer was bubbled with nitrogen gas for 1 h to remove oxygen, to reduce the amount of quenching of the YOYO-1 dye and dye-induced photo damage of the dsDNA which causes dsDNA to break (17,18). Stretching and relaxing of the dsDNA was performed at 3 µm/s pulling speed in case no fluorescence images were acquired. When simultaneously fluorescence images were captured at 10 Hz, the pulling speed was only 1 µm/s.
Figure 2.
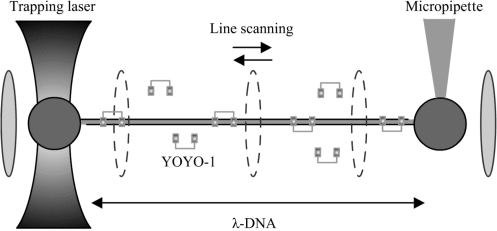
Single λ-DNA molecule tethered between two 2.6 µm-sized streptavidin coated polystyrene beads. One of these beads is placed on a micropipette (which can be moved with nanometer accuracy), while the second bead is held with the optical tweezers. YOYO-1 molecules which are present in the surrounding buffer bind the dsDNA through bisintercalation. Excitation of the dsDNA–YOYO-1 complex is achieved by scanning the dsDNA–dye complex with a line-shaped (0.3 × 3.5 µm) excitation beam (488 nm). Line frequency is 12.5 Hz.
For the fluorescence polarization experiments in order to get incident light with a polarization direction orthogonal to that of the laser, a half-wave plate in the excitation path before the scanning mirror was added. Emitted photons were separated into two polarization directions using a Wollaston prism in the detection path. Different transmission coefficients of the optical components of the instrument in all possible combinations of parallel and normal excitation and emission have been determined and taken into account. Fluorescence intensities were obtained from the images by integrating for every frame the light intensity in a fixed-width rectangle with a length equal to the dsDNA length. This rectangle completely enclosed the entire dsDNA molecule at all extensions. An identical rectangle was taken in a dark region, the total intensity in which was used for background-correction (16). The fluorescence images have been used to construct a kymograph as described in ref. (19).
RESULTS
Force spectroscopy of dsDNA–YOYO-1 complex
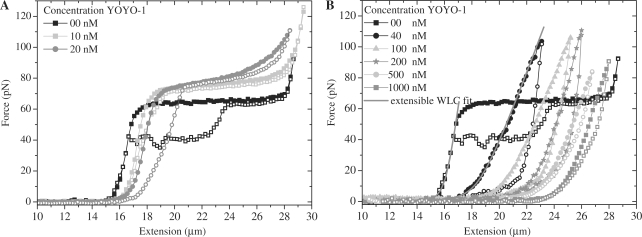
Figure 3 presents examples of force extension curves of dsDNA in the presence of various concentrations of YOYO-1. The mechanical parameters were obtained by curve fitting the extensible worm like chain model (5) to the extension part of each curve (grey lines in Figure 3B). The parameters resulting from this fit are presented in the Table 1. The contour length clearly shows an increase as the dye concentration in the surrounding buffer is increased. The force extension curve of the dsDNA without any dye shows a distinct overstretching plateau at ∼65 pN, which is characteristic for dsDNA (4) (Figure 3A). At concentrations of 10 and 20 nM YOYO-1, the overstretching plateau is still discernable, but appeared at slightly higher forces as compared to the bare dsDNA: 72 (±3) and 80 (±4) pN respectively. Furthermore, the slope of the overstretching region increases in the presence of YOYO-1, proportional to the concentration. In the presence of 40, 100, 200, 500 and 1000 nM YOYO-1, the force extension curve does not show any discernable overstretching region (Figure 3B).
Figure 3.
Force extension curves of dsDNA molecules in the presence of various YOYO-1 dye concentrations in the surrounding buffer. Closed and open symbols represent the extension and relaxation part of the cycle, respectively. The solid gray lines present the curve-fitted extensible WLC model (5) (for 0 and 40 nM). Pulling speeds are 3 µm/s.
Table 1.
Apparent mechanical properties of dsDNA–YOYO-1 complexes at various concentrations of YOYO-1 molecules in the surrounding buffer
| Concentration of YOYO-1 (nM) | Persistence length (nm) | Contour length (µm) | Stretch modulus (pN) |
|---|---|---|---|
| 0 | 52.0 (±4.0) | 16.40 (±0.20) | 1100 (±100) |
| 10 | 51.4 (±4.0) | 17.07 (±0.30) | 1075 (±80) |
| 20 | 42.0 (±5.0) | 17.56 (±0.25) | 965 (±60) |
| 40 | 20.7 (±3.0) | 19.05 (±0.20) | 470 (±40) |
| 100 | 16.6 (±3.0) | 21.43 (±0.30) | 570 (±50) |
| 200 | 12.8 (±4.0) | 22.89 (±0.35) | 783 (±60) |
| 500 | 14.9 (±3.0) | 24.67 (±0.20) | 786 (±65) |
Parameters were obtained by curve-fitting the extensible worm like chain model (5) to the extension part of force extension relaxation curve.
Simultaneous force spectroscopy and fluorescence microscopy
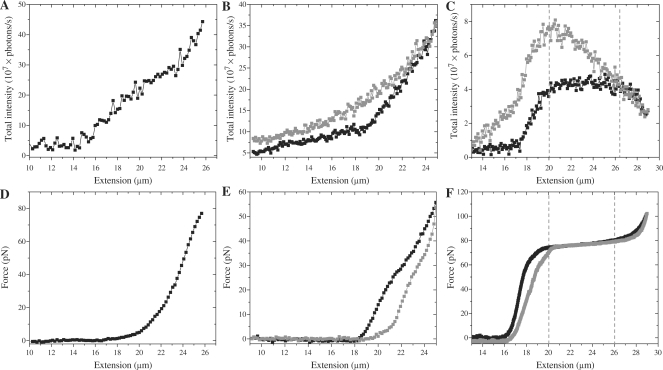
In a next step we performed simultaneous force spectroscopy and fluorescence microscopy on the dsDNA–YOYO-1 complex in the presence of 10 and 100 nM YOYO-1 in the surrounding buffer. Figure 4 presents the total fluorescence intensity versus the extension of the complex (A–C) along with the force versus extension curve (D–F). The total intensity of the complex in the presence of 100 nM YOYO-1 increases as the extension of the complex increases from 14 to 26 µm (Figure 4A). This molecule is only stretched up to 80 pN, after which the complex broke most probably due to dye-induced photocleavage (17,18). Figure 4B and E presents another molecule that was pulled up to 60 pN in the presence of 100 nM YOYO-1 also revealing the relaxation curve, also showing that the fluorescence increases proportional to the extension.
Figure 4.
Total fluorescence intensity of the dsDNA–YOYO-1 complex and the force as a function of the extension. Panel A, B and C present the total intensity of the dsDNA–YOYO-1 complex at 100, 100 and 10 nM YOYO-1, respectively. Panel D, E and F present the corresponding force extension curves of dsDNA, respectively. The molecule in A and D did break during the stretching procedure, probably due to photo-induced damage. B and E presents the data on a molecule that, although stretched to only 60 pN, did not break and revealed a relaxation curve as well. Black and gray squares present the stretching and relaxation part of the force extension cycle. Area between two gray dotted lines marks the overstretching region (in C and F).
In the presence of 10 nM YOYO-1 (Figure 4C and F), a similar increase in total fluorescence intensity was observed from 17 to 20 µm (Figure 4A). However, as the molecule started to overstretch, the increase in fluorescence intensity started to slow down, and eventually showed a reduction as the end of the overstretching plateau was reached. During the relaxation of the dsDNA–YOYO-1 complex the fluorescence intensity started increasing even beyond the maximum reached during the extension part of the cycle. When relaxed to about the start of the overstretching plateau, the intensity started decreasing.
Simultaneous force spectroscopy and polarized fluorescence microscopy
Simultaneous force spectroscopy and fluorescence polarization microscopy was performed on the dsDNA–YOYO-1 complex in the presence of 10 nM YOYO-1. The polarized fluorescence intensity as function of the extension of the dsDNA–YOYO-1 (10 nM) complex is presented in the Figure 5. Inn, Inp, Ipn and Ipp are the intensities measured where first subscript refers to the polarization orientation of the excitation light (n = normal, p = parallel), and the second subscript refers to the polarization orientation of the emitted light. Orientations n and p are defined with respect to the helical axis of the dsDNA.
Figure 5.
Total fluorescence intensity of the dsDNA–YOYO-1 complex (at 10 nM YOYO-1) as function of extension, recorded at different polarization settings. Black and gray symbols represent extension and relaxation intensities, respectively. Polarization orientation for excitation (Ex) and emission (Em) are indicated for each graph.
Fluorescence intensity Inn and Inp (Figure 5) both show a trend that is similar to the total intensity as a function of the extension plotted in Figure 4C. The relative intensity however for Inp is ∼3–4 times lower than that for Inn. The fluorescence intensities Ipn and Ipp are much lower than the first two, and only show a slight increase at extensions from 26 to 28 µm.
DISCUSSION
Establishing YOYO-1 as dsDNA structural marker
In this study we aimed at using YOYO-1 as reporter molecules for the structure of dsDNA in the overstretching region. YOYO-1 intercalates within dsDNA (20,21) and changes its mechanical properties depending on the concentration of the dye used (15,16,22). To use YOYO-1 molecules as a marker for the structure of dsDNA, it is a key to find a YOYO-1 concentration at which the structure of dsDNA is not significantly affected by the intercalation. Force extension and relaxation curves of the dsDNA–YOYO-1 complex at various concentrations of the dye are presented in Figure 3 and mechanical parameters are presented in Table 1. At 10 nM YOYO-1, the mechanical parameters and therefore the force extension curve of dsDNA–YOYO-1 complex are comparable to those of the dsDNA without any dye added. The overstretching region is clearly observable at 10 nM, and although at a slightly higher force (72 ± 3 pN) is similar to the plateau observed when no dye was added. At higher YOYO-1 concentrations (20–1000 nM) the mechanical parameters describing the force extension curve started deviating more from those obtained for bare dsDNA. Above 40 nM the overstretching region could not be observed anymore when the complex was stretched to 110 pN. Based on these data 10 nM YOYO-1 concentration was used to carry out the experiments which are aimed at determining the structure of dsDNA in the overstretching region.
Structure of dsDNA in the overstretching region
As a first step to determine the dsDNA structure in the overstretching region, the total fluorescence intensity of the complex was measured while the complex was being stretched and relaxed. As the molecule was stretched at 10 nM YOYO-1, the total fluorescence intensity increased up to the start of overstretching transition. From this point on the total fluorescence intensity started leveling off, and eventually even decreased upon further extension (Figure 4C). This result was different from that at a concentration of 100 nM in which the force extension curve revealed no overstretching region and the fluorescence intensity increased monotonically as a function of extension (Figure 4A).
The increase in fluorescence intensity as the complex was stretched at 100 nM YOYO-1 was already observed in ref. (16) and can be explained by assuming a force-dependent binding constant of the dye to the dsDNA. This means that as the force is increasing, the binding constant is increasing, and more YOYO-1 molecules actually bind to the dsDNA in order to restore the equilibrium. In the case of 10 nM, the fluorescence intensity initially is indeed increasing up to where the molecule starts to overstretch. In the overstretching plateau the increase in fluorescence starts to level off. If it is assumed that the number of molecules bound to the dsDNA–dye complex is proportional to the fluorescence observed, the conclusion must be that as the dsDNA enters the overstretching region, the number of molecules bound to the dsDNA reaches a certain limit, after which it remains constant. At some point at the end of the overstretching region the number of molecules bound even decreases a little. If the amount of fluorescence is indeed representative of the number of dye molecules bound to the dsDNA, it is quite unexpected and hard to explain that the fluorescence intensity is actually increasing during the relaxation part in the overstretching region, making this explanation very unlikely.
An alternative explanation for this could be a change of the nano-environment of the intercalated YOYO-1 molecule, induced by the stretching, which can have an influence on the fluorescence yield of the dye molecule. It has been generally accepted that the dsDNA goes through a structural change in the overstretching region but the exact nature of this transition and final structure is still a subject of debate (3,4,6,7). The B–S transition model assumes that the inter-strand hydrogen bonds between the base pairs remain intact and that the inclination of base pairs changes in the overstretching region. The distance between the successive base pairs does not change significantly (23). The force-induced melting model assumes that, the inter-strand hydrogen bonds break progressively as the dsDNA is stretched further into the overstretching region. Lepecq and Paoletti (24) stated that inter-strand hydrogen bonding is a prerequisite for the intercalating dye molecule to enhance their fluorescent yield. That is, fluorescence enhancement of YOYO-1 molecules will reduce as the dsDNA is melting into ssDNA. An ethidium fluorescence assay has been developed by Johnson (25) to analyze the amount of denatured DNA based on this effect.
According to the force-induced melting model the inter-strand hydrogen bonds between the base pairs start to break, as the dsDNA molecule is stretched in the overstretching region. When the two strands separate, the ring complex of YO moiety will be exposed which will allow quinoline and benzoxazole moieties to rotate with respect to each other (as if free in solution). This means that although the dye molecule is still bound to a single stranded part of the DNA, it will hardly contribute to the fluorescence (26); schematically this is depicted in Figure 6.
Figure 6.
Schematic picture of the YOYO-1 molecule intercalated in dsDNA. (A) YOYO-1 molecules intercalating the dsDNA where YO moieties interact with the adjacent base pairs. Interactions are indicated with dotted lines. (B) YOYO-1 molecules bound to the dsDNA that is partly melted. The center YOYO-1 molecule only interacts with one of the two strands, allowing the other YO moiety in the YOYO-1 molecule to freely rotate.
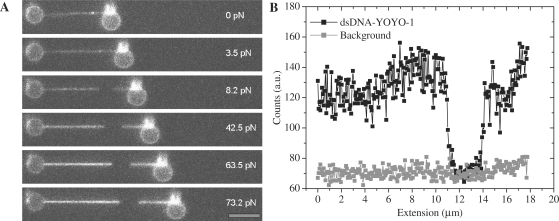
This is further supported by the fluorescence images of some dsDNA–YOYO-1 complexes (Figures 7 and 8) in the presence of respectively 100 and 1 nM YOYO-1. Along the length of the molecule presented in Figure 7, bright and dark regions within the dsDNA–YOYO-1 complex were observed when maintained at forces larger than 3.5 pN (Figure 7A). The intensity along a line through the DNA molecule and next to it (background) is plotted in Figure 7B at a force of 73 pN. At forces larger than 3.5 pN, a clear dark region was observed in between two brighter regions. This non-fluorescent segment is most probably ssDNA, connecting the dsDNA at either end (bright segments).
Figure 7.
(A)Fluorescence images of the dsDNA–YOYO-1 complex at different forces in the presence of 100 nM YOYO-1. Scale bar is 5 µm (B). Fluorescence intensity of the dsDNA–YOYO-1 complex at 73.2 pN compared with the background signal.
Figure 8.
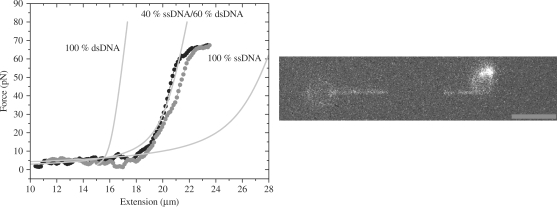
Force extension curve of denatured DNA–YOYO-1 complex at 1 nM YOYO-1. Black and gray symbols present extension and relaxation, respectively. Gray lines presents the calculated curve for 100% dsDNA, 100% ssDNA and 40% ssDNA + 60% dsDNA, which best fitted the experimental data. Image panel presents the image of the combined ssDNA and dsDNA at 18.2 µm extension (10 pN), scale bar 5 µm.
Figure 8 presents another example of a molecule that reveals a dark patch within the connecting polymer. The concentration of YOYO-1 in this experiment is only 1 nM, for which the force extension behavior is indistinguishable from that in case of no dye. To test the hypothesis that the connecting chain between the beads consists of partly ds and ssDNA, the force extension behavior of this complex was fitted with an expression in which part behaves as a FJC model (i.e. the ssDNA part) and part as a WLC model (i.e. dsDNA part).
| (1) |
fa is the fraction of the contour length that is single-stranded. X(F), Xds(F) and Xss(F) are extensions of the combined dsDNA + ssDNA, dsDNA and ssDNA as function of force, respectively (13). Persistence length (Lp), contour length (L0) and stretch modulus (S) values used for dsDNA are L0 = 16.4 µm, Lp = 52 nm and S = 1100 pN (4). For the ssDNA values used are: L0 = 27.16 µm, Lp = 0.75 nm, S = 800 pN (4). By curve fitting the force extension curve in Figure 8 (circles) with Equation (1), we determined the fraction of ssDNA (fa) to be 0.40 ± 0.04. The fluorescence image in Figure 8 presents that of the DNA–YOYO-1 complex at 10 pN. The total extension of the complex is 18.2 µm. Fraction of ssDNA (fa) was determined at 10 pN and extension of 18.20 µm using Equation (1), fraction of ssDNA is 0.43, which is in agreement with the fraction of ssDNA derived from the force extension curve. Results presented in Figures 7 and 8 clearly show that, the YOYO-1 molecules bound to the ssDNA do not contribute to the total fluorescent intensity of the dsDNA–YOYO-1 complex.
We assume the fluorescence signal during the stretching cycle is leveling off (Figure 4C) because dsDNA is converted into ssDNA, and not because fewer dye molecules bind to the DNA in the overstretching regime. This hypothesis furthermore explains the increased fluorescence observed during the relaxation cycle (Figure 4C). The number of bound dye molecules kept increasing during the stretching part of the cycle, even though the fluorescence leveled off because of the change in nano-environment of the dye molecule. During the relaxation phase the increase in fluorescence can be explained by the fact that ssDNA that has bound YOYO-1 is rehybridized to dsDNA and as a result of that starts to fluoresce. In the presence of 100 nM YOYO-1 overstretching was not observed (Figure 3B), presumably because the amount of YOYO-1 intercalated in the dsDNA is high enough to stabilize the DNA, preventing the melting of the dsDNA.
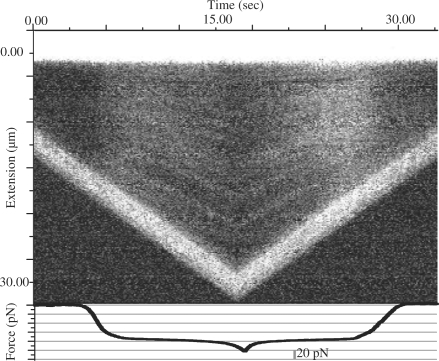
Figure 9 presents the kymograph created from the sequence of fluorescence images recorded while stretching and relaxing a dsDNA–YOYO-1 in the presence of 10 nM YOYO-1. Clearly visible are dark and bright lines in the kymograph, indicating the single-stranded / melted DNA segments and the double-stranded DNA segments, respectively.
Figure 9.
Kymograph created from a sequence of fluorescence images recorded simultaneously while recording a force extension curve of dsDNA–YOYO-1 complex at 10 nM YOYO-1. The top axis is time, the left axis of the kymograph indicates the extension of the complex, and the lower axis represents the force on the complex. The two extremely bright lines in the kymograph represent the streptavidin coated polystyrene beads. The top bright line indicates bead in the trap and other bright line indicates bead on the micro pipette.
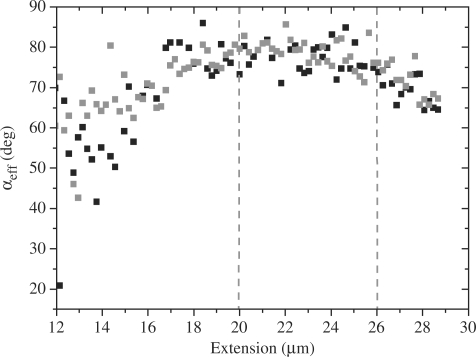
From the fluorescence polarization data presented in Figure 5, the average orientation of the YOYO-1 molecules as function of extension using Equation (2) (26) was determined. In the cylindrically symmetric sample like ours (dsDNA) Iiso is given by Iiso = (In + 2Ip)/3. These results are presented in Figure 10.
| (2) |
Figure 10.
Average orientation of YOYO-1 molecules with respective dsDNA helical axis as function of extension, calculated from the fluorescence polarization data recorded during the stretching of DNA–YOYO-1 in presence of 1 nM YOYO-1. Black and gray symbols present average (effective) angle while extension and relaxation of the complex, respectively. Area between two dotted gray lines indicated the overstretching region.
As presented in Figure 10, the effective orientation of the YOYO-1 molecules increases from ∼50° at an extension of 12 µm to ∼78° at 17 µm. Beyond this extension and during the overstretching region, this angle remains rather constant. The lower values obtained at extensions lower than 17 µm (F < 10 pN) show a lower angle and a greater variance, which can be explained by the fluctuations of the dsDNA molecule. The value obtained for the orientation of the YOYO-1 molecules with respective dsDNA helical axis at overstretching region 78.0° (±3.2) is in good agreement with earlier published results (15). The B–S transition model suggests that the base pairs in the overstretching region are starting to tilt with respect to the dsDNA helical axis, which is not consistent with the data in Figure 10.
CONCLUSIONS
Combined optical tweezers and fluorescence microscopy has been used to study the structure of dsDNA in the overstretching region. In a first set of experiments force extension curves of the dsDNA in the presence of various (10–1000 nM) YOYO-1 concentrations were recorded, to determine the effect of YOYO-1 concentration on the mechanical properties of dsDNA (Figure 3). At a concentration of 10 nM YOYO-1, the force extension behavior was similar to that of bare dsDNA, showing a clear overstretching plateau at 72 pN. At this concentration the dye molecules did not influence the dsDNA structure significantly, and could thus be used as faithful reporters of the dsDNA structure as it is being stretched. At higher concentrations the force extension behavior started to significantly deviate from those of the dsDNA in the absence of dye. At concentrations of 40 nM and higher for example the overstretching region could not be detected.
In a second set of experiments, fluorescence microscopy images were recorded during the stretching and relaxation process at dye concentrations of 10 and 100 nM. The saturation and eventually slight decrease of the fluorescence intensity (at 10 nM) while the complex was being stretched, was explained by the fact that part of the dsDNA was converted to a single-stranded form (Figures 4 and 5). This was further supported by fluorescent images that revealed some clear banding along the DNA molecule, indicative of single-stranded segments within the DNA (Figures 7–9).
To assess the orientation of the base pairs within the dsDNA during stretching and relaxing, fluorescence polarization microscopy was applied in a third set of experiments. The average angle of the dye molecules remains rather constant throughout overstretching region (78.0°± 3.2) and has a value similar to that of B-DNA in the enthalpically stretched form.
From these data we conclude that the structure of overstretched dsDNA is best characterized by (i) a continuous conversion of double-stranded segments into single-stranded segments as the dsDNA is being stretched further and (ii) no significant tilting of the base pairs during the overstretching process. These characteristics are best described by the force-induced melting model, as suggested in refs. (10–13).
FUNDING
Stichting voor Fundamenteel Onderzoek der Materie (FOM) [03BMP01], which is financially supported by the Nederlandse Organisatie voor Wetenschappelijk Onderzoek (NWO). Funding for open access charge: University of Twente.
Conflict of interest statement. None declared.
REFERENCES
- 1.Gosse C, Croquette V. Magnetic tweezers micromanipulation and force measurement at the molecular level. Biophys. J. 2002;82:3314–3329. doi: 10.1016/S0006-3495(02)75672-5. [DOI] [PMC free article] [PubMed] [Google Scholar]
- 2.Rief M, Schaumann H, Gaub HE. Sequence dependent mechanics of single DNA molecules. Nat. Struct. Biol. 1999;6:346–349. doi: 10.1038/7582. [DOI] [PubMed] [Google Scholar]
- 3.Cluzel P, Lebrum A, Heller C, Lavery R, Viovy J, Chatenay D, Caron F. DNA an extensible molecule. Science. 1996;271:792–794. doi: 10.1126/science.271.5250.792. [DOI] [PubMed] [Google Scholar]
- 4.Smith S, Cui Y, Bustamante C. Overstretching B-DNA the elastic response of individual double stranded and single stranded DNA molecules. Science. 1996;271:795–799. doi: 10.1126/science.271.5250.795. [DOI] [PubMed] [Google Scholar]
- 5.Marko JF, Siggia ED. Stretching DNA. Macromolecules. 1995;28:8759–8770. [Google Scholar]
- 6.Rouzina I, Bloomfield VA. Force induced melting of the DNA double helix. 1. Thermodynamic analysis. Biophys. J. 2001;80:882–893. doi: 10.1016/S0006-3495(01)76067-5. [DOI] [PMC free article] [PubMed] [Google Scholar]
- 7.Rouzina I, Bloomfield VA. Force induced melting of the DNA double helix. 2. Effect of solution conditions. Biophys. J. 2001;80:894–900. doi: 10.1016/S0006-3495(01)76068-7. [DOI] [PMC free article] [PubMed] [Google Scholar]
- 8.Schaumann HC, Rief M, Tolksdorf C, Gaub HE. Mechanical stability of single DNA molecules. Biophys. J. 1997;78:1997–2007. doi: 10.1016/S0006-3495(00)76747-6. [DOI] [PMC free article] [PubMed] [Google Scholar]
- 9.Marko JF. DNA under high tension: overstretching, undertwisting, and relaxation dynamics. Phys. Rev. E. 1998;57:2134–2149. [Google Scholar]
- 10.Williams MC, Wenner JR, Rouzina I, Bloomfield VA. Effect of pH on the overstretching transition of double stranded DNA: Evidence of force induced DNA melting. Biophys. J. 2001;80:874–881. doi: 10.1016/S0006-3495(01)76066-3. [DOI] [PMC free article] [PubMed] [Google Scholar]
- 11.Wenner JR, Williams MC, Rouzina I, Bloomfield VA. Salt dependence of the elasticity and overstretching transition of single DNA molecule. Biophys. J. 2002;82:3160–3169. doi: 10.1016/S0006-3495(02)75658-0. [DOI] [PMC free article] [PubMed] [Google Scholar]
- 12.Williams MC, Wenner JR, Rouzina I, Bloomfield VA. Entropy and heat capacity of DNA melting from temperature dependence of single molecule stretching. Biophys. J. 2001;80:1932–1939. doi: 10.1016/S0006-3495(01)76163-2. [DOI] [PMC free article] [PubMed] [Google Scholar]
- 13.Shokri L, McCauley MJ, Rouzina I, Williams MC. DNA overstretching in the presence of glyoxal: structural evidence of force induced DNA melting. Biophys. J. 2008;95:1248–1255. doi: 10.1529/biophysj.108.132688. [DOI] [PMC free article] [PubMed] [Google Scholar]
- 14.Mameren vJ, Gross P, Farge G, Hooijman P, Modesti M, Falkenberg M, Wuite G.JL, Peterman E.JG. Unraveling the structure of DNA during overstretching by using multicolor, single molecule fluorescence imaging. Proc. Natl Acad. Sci. USA. 2009;106:18231–18236. doi: 10.1073/pnas.0904322106. [DOI] [PMC free article] [PubMed] [Google Scholar]
- 15.Bennink MJ, Schárer OD, Kanaar R, Sakata-Sogawa K, Schins JM, Kanger JS, de Grooth BG, Greve J. Single-molecule manipulation of double-stranded DNA using optical tweezers: interaction studies of DNA with RecA and YOYO-1. Cytometry. 1999;36:200–208. doi: 10.1002/(sici)1097-0320(19990701)36:3<200::aid-cyto9>3.0.co;2-t. [DOI] [PubMed] [Google Scholar]
- 16.Murade CU, Subramaniam V, Otto C, Bennink ML. Interaction of oxazole yellow dyes with DNA studied with hybrid optical tweezers and fluorescence microscopy. Biophys. J. 2009;97:835–843. doi: 10.1016/j.bpj.2009.05.024. [DOI] [PMC free article] [PubMed] [Google Scholar]
- 17.Akerman B, Tuite E. Single and double strand photocleavage of DNA by YO, YOYO and TOTO. Nucleic Acids Res. 1996;24:1080–1090. doi: 10.1093/nar/24.6.1080. [DOI] [PMC free article] [PubMed] [Google Scholar]
- 18.Gurrieri S, Wells KS, Johnson ID, Bustamante C. Direct visualization of individual DNA molecules by fluorescence microscopy: characterization of the factors affecting signal/background and optimization of imaging conditions using YOYO. Anal. Biochem. 1997;249:44–53. doi: 10.1006/abio.1997.2102. [DOI] [PubMed] [Google Scholar]
- 19.Waterman-Storer CM, Desai A, Bulinski JC, Salmon ED. Fluorescent speckle microscopy, a method to visualize the dynamics of protein assemblies in living cells. Curr. Biol. 1998;8:1227–1230. doi: 10.1016/s0960-9822(07)00515-5. [DOI] [PubMed] [Google Scholar]
- 20.Johansen F, Jacobsen JP. 1H NMR studies of the bis-intercalation of a homodimeric oxazole yellow dye in DNA oligonucleotides. J. Biomol. Struct. Dyn. 1998;16:205–222. doi: 10.1080/07391102.1998.10508240. [DOI] [PubMed] [Google Scholar]
- 21.Glazer AN, Rye HS. Stable dye-DNA intercalation complex as reagents for high-sensitivity fluorescence detection. Nature. 1992;359:859–861. doi: 10.1038/359859a0. [DOI] [PubMed] [Google Scholar]
- 22.Sischka A, Toensing K, Eckel R, Wilking SD, Sewald N, Ros R, Anselmetti D. Molecular mechanisms and kinetics between DNA and DNA binding ligands. Biophys. J. 2005;88:404–411. doi: 10.1529/biophysj.103.036293. [DOI] [PMC free article] [PubMed] [Google Scholar]
- 23.Konrad MW, Bolonick JI. Molecular dynamics simulation of DNA stretching is consistent with the tension observed for extension and strand separation and predicts a novel ladder structure. J. Am. Chem. Soc. 1996;118:10989–10994. [Google Scholar]
- 24.Lepecq JB, Paoletti C. A fluorescent complex between ethidium bromide and nucleic acids physical chemical characterization. J. Mol. Biol. 1967;27:87–106. doi: 10.1016/0022-2836(67)90353-1. [DOI] [PubMed] [Google Scholar]
- 25.Johnson D. A new method of DNA denaturation mapping. Nucleic Acids Res. 1975;2:2049–2054. doi: 10.1093/nar/2.11.2049. [DOI] [PMC free article] [PubMed] [Google Scholar]
- 26.Larsson A, Carlsson C, Jonsson M. Characterization of the binding of YO to [poly (dA-dT)]2 and [poly (dG-dC)]2, and of the fluorescent properties of YO and YOYO complex with the polynucleotides and double stranded DNA. Biopolymers. 1995;36:153–167. doi: 10.1002/bip.360360205. [DOI] [PubMed] [Google Scholar]


