

EXECUTIVE SUMMARY
The charge of this Joint ATS/ERS Task Force was to critically review the state-of-the-art stereological methods in lung morphometry, provide practical guidelines for use of these methods in basic and translational lung research, define standards to promote comparability of morphometric studies, and examine the extension of these methods to noninvasive lung imaging.
Broad conclusions regarding study design and standardization:
In quantitative assessment of lung structure, accuracy is far more critical than precision, because inaccurate or biased data cannot be made accurate by increasing the number of measurements. The only effective way to avoid bias and ensure accuracy is via rigorous experimental design and standardization of each step of tissue fixation, processing, sampling, and analysis.
With an efficient study design, the number of samples, sections, images, and measurements at each analytical stage can be kept low without compromising accuracy and still achieving reasonable global precision in the results.
-
Principles of design-based stereology can be applied to the sampling and morphometric analysis of structures obtained by in vivo imaging modalities such as computed tomography (CT), magnetic resonance imaging (MRI), and positron emission tomography (PET).
Principles for standardization of study design:
The lung should be fixed under well-defined inflation and perfusion conditions, using appropriate fixative(s) and processing procedures that result in the best structural preservation with the least tissue distortion for the intended study goal.
Tissue blocks or image fields should be selected using proven unbiased sampling schemes to ensure that all parts of the whole have an equal chance for being sampled.
-
Structures that are nonrandom in orientation or distribution, and biopsy samples from nonrandom target sites, require special sampling and analytical strategies.
Recommendations for methods of quantification:
Stereological methods that are free of geometric assumptions must be used to efficiently quantify number, length, surface area, and volume at an adequate spatial resolution to ensure that measurements made on two-dimensional (2D) images accurately represent the three-dimensional (3D) structure.
Alveolar surface area can be accurately estimated from profile boundary lengths or intersection counting using systematic linear probes in 2D sections that are “uniform random” (i.e., selected from all possible sections with the same probability); however, the measurement is sensitive to resolution.
Alveolar number and size (volume) can be accurately measured using 3D volume probes such as the disector, but not from simple counts of profiles or measurements of cross-sectional areas in uniform random 2D sections.
Stereological measurements should be related to the volume of the lung or an appropriate reference space. Measurements made on lung biopsy specimens should be related to an internal reference space.
METHODOLOGY USED TO PREPARE THE GUIDELINES
The ATS/ERS Joint Task Force met twice as a group. In the first meeting, each individual was assigned a topic for review, including systematic evaluation of the literature, and presentation to the entire group. More than one committee member reviewed each topic, presented their findings to the entire group, and selected the most pertinent references based on committee discussions as well as database searches (Medline 1949 to 2008). The first draft recommendations were formulated by the Co-chairs and distributed to the committee members for their feedback. A second meeting was convened to discuss feedback from committee members. The document was revised and distributed again to committee members. Based on their feedback, a third revision was completed and distributed for final revision. The final document reflects the consensus of committee members.
TABLE OF CONTENTS
- Introduction
- 1.1. The Challenges
- 1.2. Accuracy, Bias, and Precision
- 1.3. Unbiased Methods: Stereology
- 1.4. Goals of the ATS/ERS Task Force
- Principles of Stereology
- 2.1. Stereologic Methods
- 2.2. Practical Application of Stereology
- Fixation and Preparation of Lungs for Morphometry
- 3.1. Goals of Fixation and Basic Considerations
- 3.2. Methods of Fixation
- 3.3. Conditional Silver Standards of Fixation
- 3.4. Special Problems Related to Lung Size
- 3.5. Preparation Artifacts
- Sampling Whole Lungs for Morphometry
- 4.1. Sampling Rules
- 4.2. Unbiased Sampling Procedures
- 4.3. Sampling Focal Lesions
- 4.4. How Much Sampling Is Enough?
- Establishing Reference Parameters
- 5.1. Measuring the Reference Lung Volume
- 5.2. Defining the Reference Space
- Morphometry of Lung Parenchyma
- 6.1. Multistage Stratified Analysis
- 6.2. Volume Density and Absolute Volume
- 6.3. Surface Density and Absolute Surface Area
- 6.4. Alveolar Number
- 6.5. Alveolar Size and its Variability
- 6.6. Mean Linear Intercept
- 6.7. Air–Blood Barrier Thickness
- 6.8. Morphometric Estimation of Lung Diffusing Capacity
- 6.9. Selecting Suitable Test Systems
- Assessing Lung Cell Ultrastructure
- 7.1. Cells and Organelles
- 7.2. Ultrasmall Particles: Immunoelectron Microscopy
- Assessing Airway and Vasculature Systems
- 8.1. Bronchovascular Hierarchy
- 8.2. Conducting Airways
- 8.3. Acinar Airways
- 8.4. Pulmonary Vascular Tree
- Biopsies
- 9.1. General Issues
- 9.2. Endobronchial and Transbronchial Biopsies
- 9.3. Thoracoscopic and Open Lung Biopsy
- Quantitative Structural Assessment Using In Vivo Imaging Techniques
- 10.1. Combining Stereology and In Vivo Imaging Techniques
- 10.2. Computed Tomography
- 10.3. Micro-CT
- 10.4. Functional Lung Imaging Techniques
Conclusions
Abbreviations
General terms
0D: dimensionless parameter, e.g., number of cells; 1D: one-dimensional parameter, e.g., length or thickness; 2D: two-dimensional parameter, e.g., surface area; 3D: three-dimensional parameter, e.g., volume or size of particles; ADC: apparent diffusion coefficient; ALP-sector: Coherent test grids consisting of a test Area containing a set of test Lines and a set of test Points; CE: coefficient of error; CV: coefficient of biological variation; D: conductance or diffusing capacity; DlO2: lung diffusing capacity for oxygen; Dmembrane: diffusing capacity of the membrane barrier; Dblood: diffusing capacity of alveolar capillary blood; EM: electron microscopy; HEPES: 4-(2-hydroxyethyl)-1-piperazineethanesulfonic acid buffering agent; IUR: isotropic uniform and random; KO2: Krogh permeability coefficient for tissue; LM: light microscopy; Lm: mean linear intercept; MDCT: multidetector computed tomography; MRI: magnetic resonance imaging; PET: positron emission tomography; RDI: relative deposition index; RLI: relative labeling index; rPTCER: pulmonary transcapillary escape rate; SF: sampling fraction: ratio of selected number of samples/total number of samples; SPECT: single photon emission computed tomography; SURS: systematic uniform random sampling; StURS: stratified uniform random sampling; TLC: total lung capacity.
Terms used in morphometric analysis:
Standard notation
Absolute quantities: A(a) = area of a; B(a) = boundary of a; I(a) = number of intersections with contour a; L(a) = length of the test line contained in a; N(a) = number of a; P(a) = number of test points that fall on a; Q(a) = number of transects of a with the test plane; S(a) = surface area of a; V(a) = Volume of a.
Ratios or densities: NV(a,b) = numerical density of a = ratio of number of a to volume of b; SV(a,b) = surface density of a = ratio of surface area of a to volume of b; VS(a,b) = volume-to-surface ratio = ratio of volume of a to surface of b; VV(a,b) = volume density of a = ratio of volume of a to reference volume of b.
Specific terms used in this document:
bm: basement membrane; c: capillary; cnp: coarse non-parenchyma; cp: coarse
parenchyma; d: linear distance; em: elastic membrane; endo: endothelium; epi:
epithelium, (ep1 or ep2: type 1 or 2); f0, f1, f2:
linear shrinkage factors; fnp: fine non-parenchyma; fp: fine parenchyma; h: height;
L (as subscript): lung; lb: lamellar body; p: parenchyma; s: septum; t or τ:
thickness; V(c): alveolar capillary blood volume; V(L): lung volume;
(V/S)airspace: volume-to-surface ratio of airspaces;
 (a): number-weighted
mean alveolar volume;
(a): number-weighted
mean alveolar volume;  (a): volume-weighted
mean alveolar volume; θ: empirical rate of gas uptake by capillary blood;
(a): volume-weighted
mean alveolar volume; θ: empirical rate of gas uptake by capillary blood;
 : arithmetic mean
thickness of air–blood barrier; τh: harmonic mean thickness of
the diffusion barrier.
: arithmetic mean
thickness of air–blood barrier; τh: harmonic mean thickness of
the diffusion barrier.
1. INTRODUCTION
1.1. The Challenges
To understand normal lung function, the processes of growth and development, and the mechanisms and effects of diseases, we need information about the 3D structure of the lung. Quantification of organ structure is based upon 3D physical attributes of tissues, cells, organelles, alveoli, airways, and blood vessels. When structures of interest are inaccessible or too small to be seen macroscopically, we rely on physical or optical sections through a few representative samples taken from the large heterogeneous organ. The resulting 2D images confer incomplete information about the 3D structure, and may not accurately represent true 3D properties, leading to possible misinterpretation when measurements are made on 2D sections. Because structural quantification is often considered the “gold standard” in evaluating experimental intervention, disease severity, and treatment response, it is imperative that these quantitative methods are (1) accurate to allow meaningful interpretation of results, (2) efficient to yield adequate precision with reasonable effort, (3) of adequate statistical power to encompass inherent variability, and (4) adherent to uniform standards to facilitate comparisons among experimental groups and across different studies. The lung poses special challenges, some of which are outlined below and discussed in later sections:
(a) Heterogeneity of lung structure requires standardized preparation methods. The inflated lung consists of mostly air; only 10 to 15% of its volume consists of tissue (cells, fibers, and matrix) and blood. In vivo lung volume and relative volumes of air, tissue, and blood fluctuate widely, while gravitational and nongravitational gradients cause spatial heterogeneity in structure and function. Failure to standardize physiological variables or minimize tissue distortion introduces uncertainties or errors into subsequent measurements, to the point of their being meaningless (1). Careful selection of fixation and preparation methods that minimize shrinkage obviates this problem (Section 3).
(b) Selected microscopic sections should provide a fair sample of the whole organ. The practice of picking specific samples or sections often fails to account for regional heterogeneity, leading to biased conclusions with respect to the whole organ. Deliberately choosing sections that contain a particular compartment (e.g., profiles of alveolar type 2 epithelial cells) overestimates their abundance within the whole lung. Using a sampling scheme that covers all regions with equal probability alleviates this problem (Section 4).
(c) Measurements made on microscopic sections must be related to the whole organ or an appropriate reference volume. Studies continue to appear that report only relative measurements (i.e., volume and surface densities or ratios) without knowledge of the lung volume. These ratios are dependent on lung inflation, and must be multiplied by absolute lung volume to obtain accurate total quantities of the structures of interest. Uncertainties regarding lung volume can bias data interpretation. For example, enlarged mean airspace size need not signify emphysema or alveolar hypoplasia; the finding could also be caused by overinflation. Careful measurement of the lung volume eliminates this error (Section 5).
(d) Lung structures are irregular and their geometry easily altered by pathology and intervention. Measurements on 2D images that rely on assumed geometry may misrepresent the 3D structure. Examples include estimating alveolar size from cross-sectional areas of alveolar profiles, and reporting alveolar surface area by the length of alveolar profile boundary. These measures can severely misrepresent the 3D structure of interest. Airspace size is often inferred from the mean linear intercept (Lm), which in fact measures airspace volume-to-surface ratio and can be converted to diameter or volume only by assuming a shape factor. Airspace distortion, or selective distortion of alveolar ducts but not alveolar sacs, can invalidate shape assumptions (Section 6).
(e) The number of lung cells cannot be estimated by counting their profiles on random histologic sections because larger cells have a greater probability of being sampled. For example, if experimental intervention causes selective cell hypertrophy, the increased probability of counting cell profiles will lead to wrong conclusions. Again, using stereologic methods that are free of geometric assumptions eliminates this error (Sections 6–7).
(f) In contrast to acinar structures that exhibit nearly random orientation (isotropy) and homogeneous distribution, conducting airways and blood vessels exhibit preferred directions (anisotropy) and inhomogeneous distribution, which alter their sampling probability on random sections. Specific sampling procedures that account for their nonrandom nature should be employed to ensure unbiased representation on 2D sections (Section 8).
(g) Assessment of endobronchial or lung biopsy specimens is limited by their nonrandom nature and a lack of external reference parameter. Endobronchial biopsy specimens are also anisotropic with distinct luminal and basal sides and with respect to airway generations. To minimize potential errors in quantification, specimens should be processed with their orientation randomized and analyzed with respect to an internal reference parameter (Section 9).
(h) The new imaging techniques CT and MRI offer the possibility of obtaining high-fidelity images of lung structure in vivo that can be used for quantitative assessment of structural changes. Since their images are sections of the organ, stereology can ensure accurate measurements (Section 10).
Definition of terms (section of text where term is defined)
Accuracy (Sec. 1.2); ALP-sector (Sec. 2.1, item a); Anisotropy (Sec. 1.1, item f); Apparent diffusion coefficient (ADC) (Sec. 10.4.1); Arithmetic mean thickness of air-blood barrier (Sec. 6.7); Bias (Sec. 1.2); Buffon's needle (Sec. 1.3); Cavalieri Principle/Method (Sec. 1.3); Coarse nonparenchyma (Sec. 6.2); Coarse parenchyma (Sec. 6.2); Computer-aided stereology systems (Sec. 2.2, item c); Connectivity of airway branching systems (Sec. 8.1); Delesse principle (Sec. 1.3); “Design-based” (Sec. 1.2); Dichotomous branching of airways (Sec. 8.1, Fig. 9A); Disector principle: physical, optical (Sec. 2.1, items d and e); “Do more less well” (Sec. 2.2, item c); Sec. 4.4; Efficiency (Sec. 4.4); Euler characteristic (Sec. 6.4); Fine nonparenchyma (Sec. 6.2; Figure 5); Fine parenchyma (Sec. 6.2; Equation 12); Fractal tree (Sec. 8.1); Fractionator sampling (Sec. 4.2.5; Figure 4); Global estimators (Sec. 2.1); “Gold standard” in fixation (Sec. 3.1); Harmonic mean thickness of air–blood barrier (Sec. 6.7); Horsfield ordering system (Sec. 8.1; Figure 9b); Isector (isotropic orientation) (Figure 4); Isotropic uniform random (IUR) sampling (Sec. 4.2.3); Isotropy (Sec. 1.1, item f); Local estimators (Sec. 2.1, item e); Mean chord length or mean linear intercept (Sec. 6.6); Monopodial airway branching (Sec. 8.1); Morphometry (Sec. 2.1); Multistage stratified morphometric analysis (Sec. 6.1); Multistage stratified sampling (Sec. 4.2.6); Nucleator (Sec. 2.1, item e); Number-weighted mean particle volume (Sec. 2.1, items e and f); Orientator (Sec. 4.2.3); Point-sampled intercept (Sec. 2.1, item e); Precision (Sec. 1.2); Reference space (Sec. 5); Reference lung volume (Sec. 5.1); “Reference trap” (Sec. 5); Relative deposition index (RDI) (Sec. 7.2); Relative labeling index (RLI) (Sec. 7.2); Rotator (Sec. 2.1, item e); Sampling (Sec. 2.1, Sec. 4); Sampling fraction (Sec. 6.4; Figure 4); Sampling procedures (Sec. 4.2); Sampling rules (Sec. 4.1); “Silver standards” in fixation technique (Sec. 3.1; Sec. 3.3); Stereology (Sec. 2.1); Strahler ordering system (Sec. 8.1; Figure 9b); Stratified uniform random (StUR) sampling (Sec. 4.2.2); Surface density (Sec 2.1, item b; Sec. 6.3); Systematic uniform random sampling (SURS) (Sec. 4.2.1); Test probes, test systems (Sec. 2.1, item a; Sec. 6.9; Figure 6); Uniform random sections (Sec. 4.2.1; Sec. 4.2.2; Sec. 4.2.3); Vertical sections (Sec. 4.2.4; Figure 3); Volume density (Sec. 2.1, item b; Sec. 6.2); Volume-weighted mean particle volume (Sec. 2.1, items e and f).
1.2. Accuracy, Bias, and Precision
Accuracy refers to the validity of data (i.e., without bias). Bias refers to methodological errors that cause measurements to be inaccurate. Precision refers to the reproducibility of measurements, which depends on data variance, sampling design, sample size, and distribution. Bias in experimental data cannot be detected unless the true value is known; nor can biased data be saved by more measurements. In contrast, precision can be checked and adjusted by increasing sample size. Therefore, in structural analysis, accuracy is more critical than precision. It is impossible to correct bias after the analysis has been completed. Also, multiple sources of bias are additive. Interventions can induce more inaccuracy in one experimental group than another. Such bias would be hard to detect or verify. The only effective way of avoiding bias is to anticipate and eliminate its occurrence via rigorous experimental design that critically and repetitively examines each step of tissue preparation, sampling, and analysis, to preempt possible errors and optimize the 3D information to be gained from 2D sections. This is called design-based approach.
1.3. Unbiased Methods: Stereology
Because sources of bias are often not obvious, the approach to preventing bias must be based on objective scientific methods instead of intuition. The statistical science of sampling irregular 3D structures using geometric test probes (slabs, sections, lines, points) for quantification in 2D profiles is termed stereology, which arose from geometric probability theory (2–4) with a long punctuated history (5, 6). In 1635, Buonaventura Cavalieri showed that the mean volume of solids could be measured from the sum of their profile areas in cut sections; the “Cavalieri method” enabled the estimation of total volume of objects from serial 2D sections. In 1777, George Leclerc Comte de Buffon showed that a needle tossed onto a grid intersects the lines with a probability proportional to the length of the needle and the spacing of the grid lines; “Buffon's needle” led to the estimation of total length and surface area of irregular objects in sections (7, 8). In 1847, Auguste Delesse showed that the relative 2D profile area of a section with random position through a population of objects is proportional to the total volume of all the objects (9); the “Delesse principle” enabled volume estimation of irregular objects based on their profile areas on random sections. This process was subsequently simplified to linear integration (10) and point counting (11–13).
Special problems arose when estimating particle number or size on 2D sections. In 1925, S. D. Wicksell estimated the number and size distribution of tumors (assumed to be spheres) based on measurement of the radii of their 2D profiles (assumed to be circles) in sections (14). Other methods followed, all depending on assumptions of particle shape, and all were shown to be prone to severe bias (15, 16). The solution came in 1984 with the “disector principle” (17), the first unbiased method for estimating particle or cell number within a given volume using a pair of histological sections separated by a known distance (Section 2). These and other stereological methods (18) are based on robust theoretical foundations (3, 19), require no assumptions regarding the structure of interest, and do not invoke model constraints or correction factors. Hence, they minimize the potential bias introduced by measuring 3D objects in 2D profiles. Stereological methods are also efficient because implementation can be simplified and the labor involved in counting minimized without affecting at all the accuracy of the result (19–21).
1.4. Goals of the ATS/ERS Task Force
Stereology was first applied to quantify lung structure in 1959–1963 (16, 22–24) and has since grown into a coherent set of measurement tools (25). However, unlike in other disciplines (neuroscience and nephrology), no methodological standards have been adopted for application of stereology to the lung. This deficiency may be due to a lack of awareness of the available valid tools compounded by communication barrier imposed by the jargon and mathematical equations prevalent in stereology literature. To address this deficiency and bridge the gap between theory and practice, this ATS/ERS Joint Task Force was formed to: (1) provide concise review and references for the state-of-the-art stereological methods in lung morphometry, (2) formulate practical guidelines for the use of unbiased methods in basic and translational investigation of lung structure, and (3) examine the extension of these methods to noninvasive imaging of the lung. Adoption of guidelines by the scientific community and by journal editorial boards will significantly improve the validity and uniformity of structural assessment in lung biology, thereby promoting better understanding of respiratory structure–function relationships in health and disease.
2. PRINCIPLES OF STEREOLOGY
2.1. Stereologic Methods
Stereology refers to the mathematical methods for defining physical properties of irregular 3D structure using 2D sections obtained by physical or optical imaging techniques. Morphometry refers to the measurement of form and the practical application of stereology. By design, stereological methods make no assumption on the size, shape, orientation, or spatial distribution of the structure of interest. The objective is to estimate geometrical parameters that characterize the composition of a structure using a few samples from the whole. Typical global parameters are 3D (volume or size), 2D (surface area), 1D (length or thickness), or 0D (number). These parameters can characterize any lung component (Table 1, Figure 1). (For general reviews on principles of stereology, see References 18, 19, 21, 26–28; for lung stereology, see References 25, 29–31; for applications of stereology to lung health and disease, see References 32–37.) The main steps in stereology are sampling and estimation.
TABLE 1.
BASIC PARAMETERS FOR LUNG MORPHOMETRY AND THE STEREOLOGICAL METHODS TO ESTIMATE THEM (cf. FIGURES 1, 5–8)
|
Parameter (Dimension) |
Example |
Method |
Test System (Dimension) |
|---|---|---|---|
| Volume (3D) | Lung parenchyma | Point counting (Figure 6a) | Test points (0D) |
| Alveolar septal tissue | |||
| Surface area (2D) | Alveolar epithelium | Intersection counting (Figure 6b) | Test lines (1D) |
| Capillary endothelium | |||
| Length (1D) | Fibers | Transect counting (Figure 1) | Test planes (2D) |
| Particle number (0D) | Alveoli | Top counting (Figure 7) | Disector (3D) |
| Type II cells | |||
| Mean particle size (3D) | AlveoliType II cells | Derived from volume and number or Local stereology (nucleator etc.) | Test points (0D) and disector (3D) Test lines (1D) |
| Mean linear intercept (chord) (1D) | Airspace size mean free distance | Chord measurement (Figure 8) or Derived from volume and surface area | Test lines (1D)Test points (0D) and the lines (1D) |
| Barrier thickness
(1D) |
Alveolar septum Blood-air
barrier |
Derived from volume and
surface area (arithmetic mean barrier thickness) or Intercept length measurement
(harmonic mean barrier thickness) |
Test points (0D) and lines
(1D) Test lines (1D) |
Figure 1.

Structural parameters and their stereological representation. A structure (left) of total reference volume V(R) containing particles of volume V(x) and surface S(x) as well as thread-like features of length L(y) is randomly sectioned. On an isotropic uniform random (IUR) section (right) the profiles of x are characterized by their area A(x) and boundary B(x), the feature y appears as a number of small transects Q(y), while the reference space is represented by the section area A(R). Applying a coherent stereological test grid (ALP-sector) with test points PT = 16, test lines LT = PT · 2d, and test area AT = PT · d2 to the section allows to assess volume, surface, and length densities per unit volume from point hits P(x) (marked by squares), intersection counts I(x) (arrowheads), and transect counts Q(y) (short arrows) whereby the reference area is estimated by the number of test points included in the section profile P(R), that is, excluding the points falling outside (marked by triangle). In this example P(R) = 15; the actual test area is A(R) = P(R) · d2, and the length of test line included in the sample is L(R) = P(R) · 2d. Using a second parallel section a distance t apart and the counting frame with area A(R) (disector), the numerical density of particles per unit volume can be assessed from counting particle tops Q−(x) in the disector volume A(R) · t. Reproduced by permission from Reference 30.
Basic rule of sampling.
Tissue blocks or image fields must be selected in an objective way such that each part of the whole has an equal chance for being sampled. Rigorous sampling should not be an intuitive exercise (e.g., pick a few good-looking areas from the mid-lung region), but should adhere to objective schemes that maintain unbiasedness at all levels. Sampling is accurate (unbiased) when all parts and orientations of the structures of interest have equal probability of being selected for analysis. Sampling is precise when independent repetition of the sampling procedure yields data with low variability. Sampling is efficient when adequate precision is achieved with reasonable effort and cost. Stereological methods that yield maximum accuracy and efficiency with reasonable precision should be selected (38–40).
Basic rules of estimation.
Stereological measurements are often simple counts of interaction events between structures of interest and test systems (geometric probes).
(a) The test probes determine which parameters can be estimated, such that, in 3D, the dimension of the structural parameter plus the dimension of the probe equals 3. Therefore, test points (0D) can measure volume (3D), test lines (1D) surface area (2D), test planes (2D) length (1D), and only test volumes (3D) can measure number (0D) (Table 1). Coherent test grids that consist of a test area containing a set of test lines and a set of test points (ALP-sector; Figure 1) placed randomly over a section allow for simultaneous estimation of length, surface area, and volume of the structures of interest with respect to an appropriate reference volume.
(b) Stereological measurements are usually expressed as densities or ratios (i.e., quantities “per unit volume of reference space.” That is, volume density of epithelium in lung = volume of epithelial cells per unit lung volume; alveolar surface density in lung = alveolar surface area per unit lung volume; numerical density of alveolar type II cells in septum = number of type II cells per unit septum volume. To answer the question “how much quantity of a structure is there?” or “has the quantity of a structure changed?” these ratios need to be converted to absolute values by multiplying them by the total volume of the reference space (Section 5).
(c) Particle number cannot be accurately estimated by profile counting in random 2D sections. This “2D sample” is inherently biased toward large particles because the probability that a particle or cell is sampled on a 2D section depends on the particle size (or height perpendicular to the section plane).
(d) Particle number may be estimated without bias using 3D volume probes termed the disector (17). A physical disector consists of two parallel histological sections generated a known distance apart from the same tissue block. These can be adjacent sections or two sections from a stack of serial sections. An optical disector is generated by focusing a known distance through the z-plane of a thick section; this is easily obtained as parallel focal planes using ordinary oil objectives of high numerical aperture (41) or confocal microscopy (42) or other tomographic techniques (e.g., micro-CT or electron tomography) (43). Placing a counting test frame of a known area AT on the paired sections defines a reference volume of the disector,
 |
(1) |
where h is the distance between the upper faces of the paired sections or the displacement of the optical planes in an optical disector.
Particles within the reference volume are counted by comparing paired sections using the “now you see it (in one section or plane), now you don't (in the next section or plane)” principle. Particles that appear in only one of the two sections, but not in both, are counted. Multiple disectors can be generated from a stack of serial sections.
(e) The disector accurately estimates mean particle size as well as
particle number. Because particles are sampled with a probability proportional to their
number within the disector volume, this technique can be used to estimate mean particle
size. If the number N(y) of particles y in the disector (i.e., their number density
NV(y)), is known, and the volume density of the particles is obtained by
point counting VV(y) = P(y)/P(AT), the mean particle size
 (y),
can be estimated:
(y),
can be estimated:
 |
(2) |
The various disector-based measurements of mean particle size are collectively known as “local” estimators (44) because they use two steps to separate, without bias, the particle of interest from its containing space (i.e., measuring size of the “bird” without having to measure volume of the “cage”) (45). The first step is to sample particles in proportion to their number, using the disector. Then, the volume of each sampled particle is estimated by measuring the distance along isotropic lines radiating from one unique point (e.g., nucleolus of a cell) to the particle boundary, e.g., cell membrane, a method called the nucleator (46). The average estimate yields a number-weighted mean particle volume. A variant of this procedure is termed the rotator (47). Another technique, point-sampled intercepts, first samples the particles in proportion to their volume, by overlaying a grid of test points onto a field of view; the particles that are hit by the points are selected for measurement. Then, the volume of each particle is estimated by measuring the length of an isotropic line intercept in the particle passing through the test point to yield a volume-weighted mean particle volume (48, 49).
(f) Number-weighted and volume-weighted mean particle volumes are not the same. Both estimate mean particle size. However, volume-weighted mean volume also includes information about variance of particle size (bigger particles are sampled at a higher probability). When particle size is constant, volume-weighted and number-weighted mean volumes are equal. When particle size is heterogeneous, volume-weighted mean volume is greater than number-weighted mean volume. An increased volume-weighted mean particle volume can result from a true increase in mean particle size, an increased size variation, or both (48). Therefore, volume-weighted and number-weighted mean volumes yield complementary information, especially when particle size is heterogeneous.
2.2. Practical Application of Stereology
Practical stereology resources can be found in introductory textbooks (28), Internet websites (e.g., the International Society for Stereology [ISS]: http://www.stereologysociety.org/), and various courses that are offered regularly in North America and Europe.
(a) Performing lung stereology requires no sophisticated equipment, except those available in most histology and microscopy facilities. For tissue sectioning and sampling (Sections 4 and 5.1.2), simple slicing tools often suffice. For general microscopic measurements, only a properly sampled set of field of view (or images) and a test system appropriate for estimating the parameters of interest are needed. Templates for test systems (used as transparencies or digital overlays) are available in the literature (21, 28) and in computer-aided image analysis software. For any coherent grid of test area, lines, and points (Figure 1), the basic information necessary for the calculation of counting results includes the area of the frame (for length and number estimation), the area associated with a single test point (for volume estimation), and the line length associated with a single test point (for surface area estimation) corrected for the final magnification.
(b) Design-based stereology minimizes bias only in sampling and measurement of structure; other sources of bias must also be identified and minimized. These include artifacts and distortion during specimen fixation and processing (Section 3), and incorrect structure recognition. The structures of interest should be unambiguously identifiable, observers should be well trained, and test systems should be simple to minimize ambiguity in the definition of counting events.
(c) Computer-aided stereology counting systems improve precision and efficiency but not necessarily accuracy. These systems usually consist of a light microscope, motorized x-,y-,z- microscope stage with a microcator to encode the z-axis position, digital camera, and computer with stereology software (49, 50). Images obtained using other instruments (e.g., confocal and electron microscopes or tomographs) are also importable into stereology software. These systems improve counting efficiency by automating certain sampling steps and by directly providing stereological probes, calculations, data analysis, and storage. Advanced stereological methods may require computerized systems. However, the decisive step, counting structures, always requires the judgment of a trained observer. Thus, high-quality stereology does not depend on sophisticated equipment but rather on a rigorous study design, particularly the sampling strategy and outcome measures.
One caveat regarding automation is the temptation to use all pixels contained in the image to measure the entire area covered by a structural component for estimating volume fractions, or to trace all the pixels that outline the contour of air spaces. This approach does not increase precision of the estimate over simpler point counting procedures (38), but rather causes a loss in accuracy because of potentially inadequate discrimination of structures by the automated detection algorithm, particularly in boundary areas. For example, using software erosion options eliminates pixels along boundaries leading to imprecision. Because each microscopic image represents but an infinitesimal sample of the organ, it makes no sense to strive for high local precision; instead, one should try to attain high global precision with the least effort on individual images, an approach referred to as “do more less well” (38, 39).
3. FIXATION AND PREPARATION OF LUNGS FOR MORPHOMETRY
3.1. Goals of Fixation and Basic Considerations
Fixation aims to preserve (1) lung volume in a defined inflation state; (2) architectural integrity of lung parenchyma (i.e., alveoli and capillaries), airways, and vessels; (3) ultrastructure of lung cells, organelles, and matrix; (4) capillary blood; (5) surface lining of alveoli and airways with surfactant film, fluid layer (hypophase, edema, or mucus); and (6) molecular identity of cells for localization and quantification of protein and RNA expression. No single fixation or preparation method fulfills all these goals and could therefore be declared a “Gold Standard,” but each of the available methods achieves some of these goals best; we will call them conditional “Silver Standards.”
The results obtained with these methods are summarized in Table 2. Airway instillation fixation (Section 3.3.1 [Silver Standard A]) preserves alveolar septal structures and capillary blood content, but eliminates alveolar surface lining. Vascular perfusion fixation (Section 3.3.2 [Silver Standard B]) preserves alveolar surface lining and internal architecture but capillary blood is lost. Both methods adequately preserve cell and tissue structure for morphometry under LM and EM. Formaldehyde fixation for short periods (4–6 h) preserves the cell immunogenicity, but does not adequately preserve cell structure or tissue architecture; this is improved in the sense of a compromise by adding some glutaraldehyde (Section 3.3.3 [Silver Standard C]). The choice of fixation method depends on the pre-defined study goal. A combination of such methods is necessary to obtain a complete picture of lung structure (51). The standards described below should be observed with the highest rigor, as these technical considerations determine the quality of tissue samples and hence the quality of the results. Where stringent “ideal” fixation conditions cannot always be fulfilled (e.g., in diagnostic pathology), it is essential to control the changes, estimate the effect of deviation (correction factors), and define and declare in any communication the limitations of the preparation.
TABLE 2.
COMPARATIVE QUALIFICATION OF RESULTS OF DIFFERENT METHODS OF LUNG FIXATION FOR MORPHOMETRY
|
Airway Instillation |
Vascular Perfusion |
Rapid Freezing |
|||
|---|---|---|---|---|---|
| GOAL To preserve: |
2.5% GA buffered ⇒
OsO4, UrAc |
Formaldehyde,
Paraformaldehyde |
GA → OsO4
→ UrAc → Alcohol dehydration |
Freeze
substitution |
|
| Lung volume | ++ | — | +++ | — | |
| Internal architecture | ++ | — | +++ | — | |
| Parenchyma | ++ | — | +++ | — | |
| Airways and vessels | ++ | — | +++ | — | |
| Tissue fine structure | +++ | + | ++ | — | |
| Capillary blood | +++ | + | — | — | |
| Cell structure | +++ | — | ++ | — | |
| Surface lining and edema | — | — | +++ | + | |
| Cells: molecular identity | — | + | — | + | |
| LM | + | + | + | + | |
| TEM | + | — | + | — | |
| SEM | + | — | + | — | |
| LSM |
— |
+ |
— |
+ |
|
+++ excellent, ++ good, + acceptable, – inadequate.
Definition of abbreviations: GA = glutaraldehyde; LM = light microscopy; LSM = laser scanning confocal microscopy; OsO4 = osmium tetroxide; SEM = scanning electron microscopy; TEM = transmission electron microscopy; UrAc = Uranyl acetate.
In summary, the fixation and preparation methods should be carefully defined and consistently applied to avoid bias. Quality of the specimen depends on the fixing agent, route of fixative application, control of pressures, and processing procedures. The appropriate protocol should be chosen according to study goals (52, 53). Because air and blood contents fluctuate widely in vivo, it is necessary to document and control the physiologic variables under which the lung is fixed.
3.2. Methods of Fixation
3.2.1. Fixing agents.
(a) Formaldehyde is a good general-purpose fixative for LM, diagnostic pathology, immunohistochemistry and immunocytochemistry with/without antigen retrieval techniques, because it does not completely destroy protein immunogenicity (54, 55). However, formaldehyde does not adequately stabilize tissue structure; the fixed lung is subject to significant mechanical distortion and collapse. In addition, cell ultrastructures are not adequately fixed for EM.
(b) Glutaraldehyde is a di-aldehyde with potent protein cross-linking ability (56, 57) that rapidly stabilizes cell structure, resulting in stable lung architecture that resists mechanical distortion. It is the preferred fixative for EM studies. The lung can be adequately fixed using buffered 2.5% glutaraldehyde, sometimes combined with paraformaldehyde, a solid polymer of formaldehyde (57, 58). Because cell membranes remain semipermeable after fixation, hypertonic glutaraldehyde solutions should be avoided (59). Glutaraldehyde in high concentrations destroys protein immunogenicity and is not a suitable fixing agent for immunohistochemistry.
(c) Osmium tetroxide in isotonic buffer is the original fixative for EM; today it is used primarily as a “post-fixative” of glutaraldehyde-fixed tissue, to stabilize and stain cellular membranes by binding to unsaturated phospholipids. Osmic acid treatment reduces membrane permeability so that cells are less susceptible to osmotic effects.
(d) Uranyl acetate, a contrast agent commonly used in transmission EM, is also used as a second post-fixative that stabilizes membranes via binding of uranyl ions to the phosphodiester groups of saturated phospholipids, thereby reducing axial diffusion of lipid molecules (60), an important consideration in preserving labile surfactant materials. Preservation of surfactant-containing lamellar bodies in alveolar type II cells requires prolonged en bloc staining with half-saturated aqueous uranyl acetate (61, 62).
(e) Ethanol or acetone, which dehydrates tissue and denatures certain proteins, is an essential ingredient for fixing and stabilizing elastic fibers. (63)
3.2.2. Route of fixative application.
(a) Immersion of tissue pieces in fixative preserves cell structure but sacrifices functionally relevant 3D lung architecture. Only small blocks can be fixed adequately for EM because penetration depth of glutaraldehyde and osmium tetroxide is limited.
(b) Instillation of fixative solution through the airways under controlled pressure is the standard route that allows excellent preservation of tissue and capillary blood, provided the fixative is iso-osmolar with respect to plasma (51).
(c) Vascular perfusion of fixative in an air-inflated lung eliminates capillary content but preserves the structure of alveolar and airway surface, including constituents of the surface lining layer (64–66).
(d) Intrapulmonary injection of glutaraldehyde solution allows rapid fixation of tissue samples when the lung cannot be fixed in toto through the airway or vasculature. (67)
(e) Rapid freezing followed by freeze-substitution is used for certain applications (e.g., when histology is combined with immunocytochemical and molecular genetic studies) (68–70). The poor heat conductivity of porous lung tissue requires freeze-substitution fixation of frozen lung samples in alcohol-based or ethylene glycol-based fixatives, which allows LM morphometry to be performed, for example, in correlation with functional imaging (71, 72). Specimens thus obtained cannot be used for EM because replacement of ice with the substituting fixative is feasible only to short distances (micrometers) from the surface, leading to inhomogeneous and inadequate cell and tissue preservation (73), except for very small samples (74).
3.2.3. Control of pressures.
Airway pressure determines the degree of unfolding of alveolar structures, vascular pressure determines capillary filling, and osmotic pressure of the fixative determines the degree of cell swelling or shrinkage.
(a) In airway instillation, the fixative must be instilled postmortem using a sufficiently high pressure (20–25 cm H2O above the highest point of the lung) and a rapid flow to ensure uniform penetration into the parenchyma, because lung tissue and capillary blood is fixed immediately upon contact with fixative. The tubing must be as wide and short as possible. The instillation pressure and perfusion state should be standardized and clearly documented. Instilling the fixative while blood is flowing may cause some capillaries to be engorged with erythrocytes, stacking up behind fixed capillary segments. Conversely, if the lung is exsanguinated before fixation, the capillaries will be empty. A useful precaution is to clamp the main pulmonary artery with a snare just before instillation (75).
(b) In vascular perfusion fixation, airway pressure must be controlled to achieve adequate alveolar distension (64, 76). The perfusion pressures must be controlled in the pulmonary artery cannula and in the left atrium to define perfusion conditions in relation to airway pressure (zone 2 and 3 conditions); zonal conditions determine the degree of capillary distension (64, 77). Alternatively, the lung can be fixed at defined transmural pressures under no flow conditions (78).
(c) Osmotic pressure of the fixative is difficult to control because the process of fixation binds glutaraldehyde molecules, causing osmotic pressure to fall, whereas osmium tetroxide alters semipermeability of cell membranes (59, 79). For this reason, the fixative solutions could be made slightly hypertonic (total osmolarity 350 mOsm for instillation and 510 mOsm for perfusion fixation); higher osmolarity causes cells to shrink. In perfusion fixation, dextran could be added to adjust oncotic pressure (64).
3.2.4. Tissue processing.
The fixed lung should be immersed in the fixative solution for at least 24 hours to allow full tissue fixation. After sampling, tissue blocks are dehydrated through graded ethanol into an intermediate solvent, depending on the embedding medium. The best quality is obtained with embedding in epoxy resins (for EM and high resolution LM) or in glycol methacrylate (for LM). Embedding in paraffin has some advantages for LM (staining and solubility) and is the traditional standard in pathology (archival material), but causes unpredictable tissue shrinkage, a disadvantage for morphometry unless sampling is done with the fractionator technique aiming at estimation of total number of cells or alveoli (Section 4.2.5.). Samples for EM are post-fixed in buffered 1% osmium tetroxide (avoid phosphate buffer here) followed by bloc staining with uranyl acetate solution (61). Dehydration in ethanol series follows before embedding.
3.3. Conditional Silver Standards of Fixation
3.3.1. Silver Standard A: airway instillation fixation.
The fixative is a 2.5% glutaraldehyde solution buffered (pH 7.4) with potassium phosphate, HEPES, or cacodylate (total osmolarity 350 mOsm). This solution is instilled with rapid flow into airways after lung collapse at a head pressure 20–25 cm above the highest point of the lung (51). A slow inflow may cause inhomogeneous lung fixation. In open chest preparations, the main pulmonary artery may be clamped with a snare just before instillation to prevent flowing erythrocytes from stacking up behind fixed capillary segments (75). After fixation, airway inflation pressure must be maintained for at least 24 hours, by tying off the trachea or the tubing without leaks.
3.3.2. Silver Standard B: vascular perfusion fixation.
The primary fixative is a 2.5% glutaraldehyde solution buffered (pH 7.4) with potassium phosphate, HEPES, or cacodylate with the addition of 3% dextran (total osmolarity 510 mOsm) and applied by vascular perfusion, followed by sequential perfusion of buffered solutions of (1) 1% osmium tetroxide and (2) 0.5% uranyl acetate with dextran (64), then immediately followed by perfusion of ethanol (70–100%) (63).
The lung is perfused either in situ or as isolated organ, with the animal heparinized before surgery. An inflow cannula is inserted into the pulmonary artery and an outflow cannula into the left atrium; pressures in both cannulas should be monitored and controlled. The pulmonary circulation is flushed free of blood with a buffered iso-osmolar solution containing dextran or BSA (64). Air inflation of the lung must be controlled before perfusing with fixative solution. After completion of perfusion fixation, the lung can immediately be sliced for volume estimation and sampling.
3.3.3. Silver Standard C: fixation for stereology and immunocytochemistry.
This method is a compromise to allow retention of immunogenicity of epitopes while preserving structural integrity for morphometry. A combination of 4% formaldehyde with 0.1% glutaraldehyde in 0.2 M HEPES buffer followed by freeze substitution in 0.5% uranyl acetate in methanol (80) has proven successful. Depending on the antibody used, other combinations may also be used. The fixative is applied by airway instillation or by vascular perfusion, after adding dextran. Lung tissue fixed this way can be processed for immunocytochemistry (54) or stereology (81).
3.4. Special Problems Related to Lung Size
3.4.1. Large lungs (human, dog, pig, horse).
When instilling fixative solution through the airways, the diameters of the tracheal cannula and the tubing connecting to the fixative reservoir should be as large as possible. To ensure rapid, even fixation, one may start with a higher pressure-head, gradually bringing it down to the final pressure (20–25 cm H2O). The fixed lung can be immersed in a plastic bag containing the fixative solution and the bag floated on a water bath to avoid crushing the lung under its own weight. Because of significant regional structural heterogeneity, each lung should be divided into lobes or strata (e.g., upper and lower zones) and the sampling scheme performed separately for each stratum or lobe.
3.4.2. Small lungs (rodent, embryo, early postnatal pup).
To obtain uniform and reproducible lung fixation as well as accurate morphometric measurements in small lungs (82), a number of issues must be considered:
(a) The small luminal diameter of the trachea (< 1 mm) requires narrow plastic or glass tracheal cannulas that show high resistance or capillarity forces during instillation of the fixative. Combined with a lower content of connective tissue fibers, the small trachea and lungs are prone to rupture when stretched.
(b) The liquid that fills embryonic lungs may dilute the fixative and impede its proper distribution. Partial removal of lung liquid by gently massaging the thorax, by careful suction with a syringe, and by using slightly hyper-osmolar fixatives may help to overcome this problem (83). The fixed lung sections should be carefully assessed for rupture artifact and, if present, the fixation approach should be modified.
(c) Caution is needed when measuring volume of small fixed lung by liquid displacement, because any liquid that is carried with the lung, including liquid trapped between adjacent pleural surfaces, will falsely elevate the estimated lung volume (Section 5.1).
(d) Even small lungs exhibit marked regional differences (84), which require multistage sampling just like larger lungs. Because of a high surface-to-volume ratio of small lungs, the subpleural region with its airway tips perpendicularly oriented to the pleural surface represents a higher volume proportion than in larger lungs.
(e) For initial sampling of larger lungs, macroscopic methods are convenient to create slabs, slices, and cubes. For small lungs, microscopic methods are the choice; use a microtome and/or ultramicrotome to cut uniform serial sections and select tissue samples according to the principles of systematic uniform random sampling (Section 4). Assumptions or forerunning morphometric analyses may have to be made about structural similarity between the right and left lung, or among lobes (84).
(f) Fixed lungs are typically immersed in fixative, and after sampling, dehydrated in a solvent for the embedding media. Small lungs may collapse during these steps, particularly if glutaraldehyde is not used. Processing the tissue in a low vacuum can minimize collapse. Reagents should be placed in a vacuum before use to remove dissolved gas, which otherwise may distort or rupture the tissue when the gas comes out of solution. Excessive vacuum should be avoided, as it may also rupture the fragile tissue.
(g) Compared with human lungs, higher magnification may be required when analyzing very small lungs, to adequately resolve structural details due to a near fivefold difference in the scale of the structures (e.g., size of acinar airways) (Section 8.3).
3.5. Preparation Artifacts
Because of inherent airspace instability, dimensional changes occurring during tissue preparation should be controlled and determined (85), including changes in lung volume or its substructures (shrinkage or swelling) as well as mechanical distortion caused by cutting thin sections. The volume of airspaces represented on paraffin-embedded formalin-fixed lung sections may be as little as 15% of total lung capacity (TLC) (1) because each preparatory step (formalin fixation, dehydration, paraffin embedding, and sectioning) progressively reduces apparent airspace volume of the fixed tissue. This serious problem can largely be avoided by selecting appropriate fixation and preparation procedures, namely glutaraldehyde instead of formalin fixation, and epoxy or glycol methacrylate resin instead of paraffin embedding.
Volume of instillation-fixed lungs represents about 3/4 of TLC (86); this volume serves as reference for controlling dimensional changes in subsequent steps. Glutaraldehyde-fixed lungs are resilient to mechanical distortion during processing. Dehydration and embedding in Epoxy resins result in less than 5% linear tissue shrinkage (87). Embedding in glycol methacrylate also incurs little shrinkage (88). Sectioning of embedded tissue may compress tissue in the cutting direction, thus reducing the section area in an anisotropic way. Shrinkage can be estimated by taking sequential photographs of the same tissue block in (1) fixed state, (2) embedded block, and (3) histologic section, and measuring the distance dx between identifiable landmarks: the ratios d2/d1 = f1, and d3/d2 = f2 are stepwise linear shrinkage factors, with total shrinkage amounting to f0 = f1·f2. Volume shrinkage = f03. Assuming structural homogeneity and isotropy of tissue shrinkage, this factor (f03) can be used to reduce the measured lung volume V(L) in the fixed state to that corresponding to sections
 |
(3) |
Section compression is estimated in a similar way by measuring the distance between landmarks on embedded blocks and sections in the section direction and perpendicularly to it. Cell shrinkage or swelling may be avoided by carefully controlling the osmolarity of fixative solutions (59, 79).
It is often assumed that artifacts or bias are unimportant when the study goal is to compare two experimental groups. This assumption is valid only if experimental conditions and structural alteration do not lead to differential shrinkage between the groups being compared. For example, the fibrotic or emphysematous lung shrinks differently from the normal control lung. Where it is justified to conclude that relative bias is the same among different experimental groups, biased data can still allow valid between-group comparisons. Such data do not provide “true” or accurate values but retain their comparative worth. The weakness of this approach resides in the fact that a given study may be open to multiple sources of bias, some of which yield overestimates and others underestimates of the true value.
4. SAMPLING WHOLE LUNGS FOR MORPHOMETRY
4.1. Sampling Rules
To ensure that selected tissue samples—whether for morphometry, immunocytochemistry, or gene expression—represent the whole, all parts of the lung should have equal probability of being sampled. This requirement is met by introducing randomness into the sampling process (19, 89–91). In the simplest random sampling procedure, the lung or lobe is cut into serial slices at a constant thickness interval. The slices to be selected are determined by random numbers. The best way to avoid sampling bias is to adhere strictly to the proven unbiased sampling procedures (below); adherence is particularly important when some components (airways and vessels) are not randomly distributed or oriented (91, 92) because the estimation of volume and number is orientation-independent but the estimation of surface and length is orientation-dependent.
4.2. Unbiased Sampling Procedures
4.2.1. Systematic uniform random sampling (SURS).
This is a simple procedure. An initial random cut is made through the lung followed by serial parallel slices made at a constant thickness interval. The slices are flipped 90° in the same direction so the cut faces are visible. A lattice grid is laid over the slices and tissue blocks are selected systematically (e.g., taking a block in every fifth grid square in every fifth row, with a random start). Because more squares fall on larger slices, each unit lung volume is sampled with equal probability.
4.2.2. Stratified uniform random sampling (StURS).
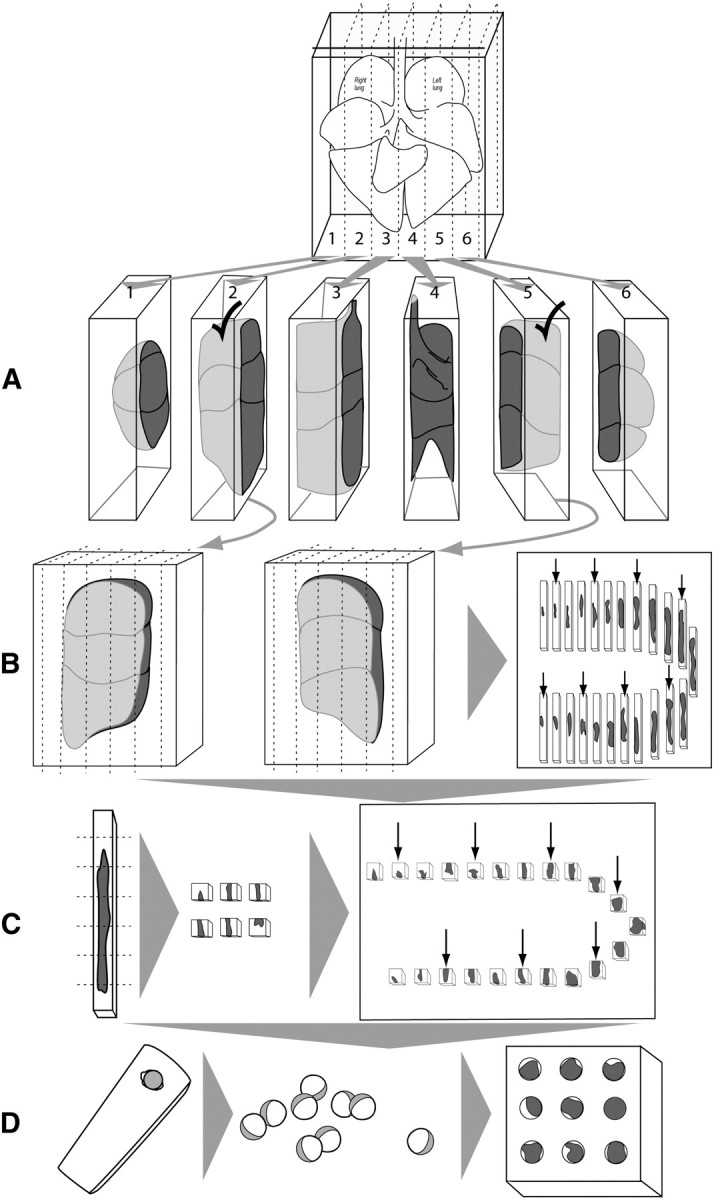
This is a variant of SURS useful in the study of large lungs, where heterogeneity is suspected, or in studies that affect only part of the lung (93). The lung is divided into strata of similar or very different size (e.g., left and right lower and upper lobes); each stratum is serially sliced at equal thickness with a random start in the first cut (Figure 2). All slices in each stratum are laid out with the upper cut surface up and a square grid with numbered lines is used to obtain a defined number of samples by means of random numbers; alternatively, one can also use the systematic sampling method described in Section 4.2.1. In the example shown, the sample blocks are divided into parts and processed for LM and EM; alternatively, independent samples can be selected separately for LM and EM (30).
Figure 2.

Stratified uniform random sampling (StURS) of dog lung by division into four regional strata of similar size, for example, upper and lower strata of left and right lung (207). (A) In each stratum, serial slices of thickness h are generated by Cavalieri sampling with random start of first cut. (B) The slices are laid out with upper cut surface up; a grid of 10 × 10 rows is overlaid to identify four samples by generating two-digit random numbers that hit the lung parenchyma (gray squares). (C) The sample blocks are divided and embedded for light microscopy (LM) and electron microscopy (EM); alternatively, one may obtain independent random number samples for LM and EM.
4.2.3. Isotropic uniform random (IUR) sampling (30).
This is similar to SUR sampling, with the addition of specific procedures termed “orientator” (94) or “isector” (95) to orient the blocks and ensure that selected blocks are embedded in random (isotropic) directions for estimating the length or surface of airways and vessels. These orienting procedures are not necessary with respect to the surface of alveoli, which face all directions with about equal probability.
4.2.4. Vertical sections.
These are cut for estimating surface area of conducting airways and blood vessels to account for potential bias caused by their preferential direction and non-random orientation (96) (Figure 3). They may also be used for a range of local cell size estimates.
Figure 3.

Vertical sections. (A) An arbitrary horizontal reference plane, such as a cutting board, is considered fixed and the vertical section is perpendicular to this horizontal plane. Airways selected by microdissection can be sampled by this vertical section scheme, by bisecting the airway longitudinally and laying it flat with the luminal surface up. In this orientation, the arrow that runs from base to apex of the epithelium indicates the direction of the vertical axis, V. (B) Bisected airway can be cut into strips of tissue. (C) Each airway tissue strip is cut following a random rotation of the cutting angle to achieve uniform randomness. (D) The blocks are then selected by SURS procedures for embedding with the vertical direction maintained in the embedding mold. Reproduced by permission from Reference 208.
4.2.5. Fractionator.
This is a comprehensive sampling approach (97, 98) that begins with serial sectioning though the entire specimen, followed by systematic selection of a known fraction of the whole (99) (Figure 4). This procedure can be combined with point-counting (Cavalieri) estimates of volume, specific section orientation (vertical or isotropic sections), and multistage stratified sampling (below) to quantify the number, volume, surface, and length of lung structure and specific subcompartments. Because the fraction sampled from the whole is known, estimates of total number are not affected by tissue shrinkage artifact.
Figure 4.
Isotropic uniform random sampling scheme, comprised of uniform sampling (smooth fractionator) followed by procedures that ensure isotropic orientation (isector). (A) A lung is embedded in agar and cut into slabs at a constant interval and a random start of the first cut. (B) Each slab is laid flat (two are shown) and the lung volumes estimated by point counting (volume = thickness × area). The selected slabs are cut into bars with the same width as the slab thickness, and sorted according to the area of the upper surface (e.g., largest to smallest). Every third bar is selected (shown by arrows, a fractionator sequence with sampling fraction = 1/3 using a random start). (C) Each selected bar is cut into bricks, sorted again according to the area of the upper surface, and every third bar is selected (shown by arrows, continuing the fractionator sequence at sampling fraction = 1/3 using random start). (D) To ensure isotropic orientation, the selected bricks are placed into spherical embedding molds (in agar or plastic), allowed to harden, removed from the mold, and rolled on the bench top before further embedding, sectioning, and staining.
4.2.6. Multistage cascade sampling.
Unbiased sampling procedures can be stratified, or repeated, at different magnifications of the specimen where the object of interest at one level becomes the reference object in the next level of higher magnification (90). After tissue blocks are selected from serial lung slices by an unbiased sampling procedure, multiple histologic sections are cut from each block, allowing for random orientation.
The same sampling procedure is reapplied to select sections for analysis under the microscope, and again to select microscopic fields to be overlaid with a test system. The final measurements are related back through the cascade of levels to the absolute volume of the lung or lobe (Section 6).
4.3. Sampling Focal Lesions
The size, frequency, and distribution of lesions in the lung dictate the sampling approach. When lesions comprise greater than 10% of lung volume, the global sampling approaches described above work well. When lesions comprise 5% or less of total lung volume and are heterogeneously distributed, global sampling is difficult. One approach is to sample the lung as described above to estimate the volume of lesions, and then subsample regions within the lesions for detailed analysis using an appropriate random sampling strategy (100). This approach has been used to show changes in fibroblast number in lung lesions after treatment for bleomycin-induced pulmonary fibrosis (101).
4.4. How Much Sampling Is Enough?
Statistical efficiency of morphometric results is given by
 |
(4) |
where CV(observed) is the observed coefficient of variation, CV(biological) is the true biological variation or “signal” (unknown), and CE(method) is the coefficient of error or estimate of the “noise” introduced by sampling and measurement variation. The general rule is that the “noise” should not exceed the “signal,”
 |
(5) |
and efficiency considerations means that it is wasteful of resources to make CE(method) ≪ CV(biological) (i.e., the “do more less well” paradigm) (38, 39).
The contributions of sampling and measurement variation to direct volume estimates by the Cavalieri method have been derived (102). Contributions to measurement variation for ratio estimators like volume, number, surface, and length densities are also available (103). Simple guidelines suffice for sample size within an animal (primary sampling unit) as follows: 100–200 probe interactions (e.g., point hits or intersections), 50 fields, and 10 blocks; the latter two sample sizes may have to be increased in inhomogeneous tissue (104).
5. ESTABLISHING REFERENCE PARAMETERS
Primary morphometric measurements are usually densities (e.g., volume density = fractional volume of structure within the containing volume [in cm3/cm3] or surface density = surface area of structure within the containing volume [in cm2/cm3]). To make functional sense, such primary parameters must be converted to absolute quantities (e.g., volume [cm3] or surface [cm2]) in relation to a defined reference volume:
 |
(6) |
Misinterpretation of data can arise if only densities are examined without consideration of changes in the reference space; this error is termed the “reference trap.” For example, after resection of one lung (pneumonectomy), the remaining lung nearly doubles its volume at a given transpulmonary pressure. If volume density of alveolar septal tissue in the remaining lung is normal, then the absolute quantity of alveolar tissue must have doubled. If the density of alveolar tissue is below normal, its absolute quantity may or may not have increased. Accurate measurement of reference volume is of critical importance for data interpretation because it is often the only absolute quantity in the analytical scheme.
5.1. Measuring the Reference Lung Volume
Lung or lobar volume can be measured in the intact state by saline immersion (105) or radiologic imaging (CT or MRI) (106–109), and after serial sectioning by point counting of the cut surfaces (Cavalieri method) (110).
5.1.1. Immersion method.
After releasing airway pressure, the lung is immersed in a container of saline, without touching the container. Volume displacement of saline is measured as the change in weight of the container (111). Because elastic fibers are not completely fixed by aldehyde fixative (63, 64), residual elasticity and the hydrostatic pressure of instilled fixative cause the estimated volume to be 10 to 15% larger by immersion than by the Cavalieri method (86); variability in volume may depend on the size of the lung. In large lungs, the volume of each lobe should be measured separately. In very small lungs, retention of fixative to the pleural surfaces and within the interlobar fissures must be eliminated to avoid errors in the volume measured by immersion.
5.1.2. Cavalieri method.
The lung is serially sliced at a constant thickness (t), with a random start. The slices are flipped 90° in the same direction and the cut surfaces overlaid with a square lattice test grid for point counting.
 |
(7) |
where P = number of points falling on lung parenchyma or the structures of interest, and d = distance between adjacent grid points. Total lung volume is the summed volume of individual slices. This method has some advantage over the immersion method: (1) it measures volume of the fully relaxed lung, a state that most closely represents the final state of the tissue to be analyzed under the microscope; (2) it adds only modest extra effort because serial slicing is routinely required for tissue sampling; and (3) it uses a consistent point counting principle as that used in subsequent microscopic analysis of tissue subcomponents. Care should be taken to support the fixed lung during slicing (e.g., by embedding in agar), and to keep the slices parallel and the cut surfaces moist to minimize tissue distortion. Because formaldehyde fixation results in unpredictable tissue shrinkage compared with glutaraldehyde fixation, the former yields less reliable estimates of reference lung volume.
The Cavalieri method is preferred over the immersion method for estimating the volume of moderate to large lungs that can be serially sliced at 1- to 2-cm intervals. In very small lungs, a microtome is needed to section at precise millimeter intervals; alternatively, either immersion or imaging (CT, MRI) methods may be used to assess volume of the small lung.
5.2. Defining the Reference Space
The principle of reference space extends to microscopic levels. A reference space should be defined at each level of progressively higher magnification. For example, to estimate the absolute volume of extravascular alveolar tissue [V(tissue)] by point counting, total lung volume [V(L)] is estimated first by the Cavalieri method on gross lung slices. Then the volume density of alveolar septum per unit lung volume, VV(s,L) is estimated at low-power LM. Next, the volume density of alveolar tissue per unit volume of alveolar septum, VV(tissue,s), is obtained under high-power LM or EM. Then,
 |
(8) |
6. MORPHOMETRY OF LUNG PARENCHYMA
6.1. Multistage Stratified Analysis
Beyond the terminal bronchiole lie the acini, the basic gas exchange units containing alveolated distal airways and alveoli. Intra-acinar airway diameter changes little with each generation so that total airway cross-section nearly doubles with each generation. The gas exchange region is subdivided by interalveolar septa, the number and size of alveoli being descriptors of this subdivision. The alveolar septa, cells, and capillaries are minute and separated by large volumes of air, necessitating multistage cascade analysis at sequentially higher magnifications to ensure adequate spatial resolution while minimizing sample number and size at each level (30) (Figure 5).
Figure 5.

Estimating morphometric parameters of lung parenchyma using multistage stratified sampling at four levels of increasing magnification. The parameter estimated at one level becomes the reference parameter at the next higher level. This approach allows calculation of total estimates pertaining to the whole lung and permits efficient sampling. Level 1 is Cavalieri sampling, allowing estimation of lung volume. Level 2 and level 3 sections are overlaid with a simple point grid to estimate volume fractions, whereas at level 4 an electron micrograph is overlaid with a multipurpose test system comprising a set of test line segments within an unbiased counting frame (Section 2). *Because nonparenchyma occupies a small fraction of the lung, it may be more efficient to estimate VV(np).
6.2. Volume Density and Absolute Volume
Point counting is used to estimate the volume fractions of parenchyma, alveolar septa, and their constituents, in a cascade procedure (Figure 5). A consistent definition of compartments must be maintained at all levels:
Level I (macroscopic): estimating total lung volume by measuring the area of lung surfaces (Ai) for all tissue slices i, and multiplying the summed areas by the slice thickness (t), that is,
 |
(9) |
Level II (low-power LM): estimating the fraction of total lung volume occupied by parenchyma VV(p,L), excluding nonparenchyma, that is, bronchi, vessels, interlobular septa, lymph nodes, etc. with diameters greater than 1 mm (coarse nonparenchyma) and between 20 μm and 1 mm (fine nonparenchyma), and expressed as a ratio of points on parenchyma P(p) to points on lung tissue P(L). Because nonparenchyma constitutes a small fraction (∼ 10%), it is more efficient to count points hitting nonparenchyma P(np):
 |
(10) |
Small rodent lungs contain only fine nonparenchyma, while in large lungs it is useful to separately estimate coarse and fine nonparenchyma in two steps:
Level II-a (macroscopic, 1–10×): counting, on Cavalieri slice surfaces, points hitting coarse nonparenchyma (cnp) (bronchi and vessels > 1 mm in diameter) yields the volume fraction of cnp in total lung volume:
 |
(11) |
Volume fraction of coarse parenchyma in total lung volume, VV(cp, L) = 1-VV(cnp, L).
Level II-b (low-power LM, 100–250×): estimating the volume density of fine nonparenchyma VV(fnp) (bronchi and vessels 20 μm to 1 mm in diameter) as a ratio of test point hits on these structures P(fnp) to points hitting lung tissue, excluding coarse nonparenchyma structures P(cp) to obtain VV(fnp) = P(fnp)/P(cp). Then volume fraction of fine parenchyma in lung is
 |
(12) |
Level III (high-power LM, semi-thin Epon sections, 400–600×): estimating volume fraction of interalveolar septum in parenchyma VV(s,p) as a ratio of points hitting the septum to those hitting parenchyma (excluding nonparenchyma structures),
 |
(13) |
Level IV (EM, 1,000–5,000×): estimating volume composition of the septum by counting points hitting capillaries P(c), endothelium P(endo), epithelium P(epi), and so on in relation to all points hitting the septum P(s) to obtain their respective volume densities per unit volume of septum: VV(c,s), VV(endo,s), or VV(epi,s), etc. Stratification can be extended by estimating, on high-power EM images (10,000–20,000×), the volume composition of septal ultrastructure (e.g., lamellar bodies [lb] in type II epithelial cells, v(lb,ep2)). The total volume of lamellar bodies V(lb) in the lung is the product of fractional quantities estimated at each level (i.e., the parameter at one level becomes the reference parameter for the next level of higher magnification):
 |
(14) |
6.3. Surface Density and Absolute Surface Area
The same stratified scheme is used to estimate absolute surface areas of alveoli S(a) and capillaries S(c); both surfaces are equally important determinants of gas exchange impairment in emphysema or fibrosis. While S(a) is often estimated on LM images, the low spatial resolution of surface details significantly underestimates S(a) compared with EM (21). Furthermore, LM provides no quantitative information on S(c), unless capillary endothelial cells are specifically highlighted by immunohistochemistry. Hence, it is recommended that alveolar-capillary surface areas be estimated under EM (> 1,000×), which is more precise but less efficient than LM combined with immunohistochemistry.
On EM images overlaid with a coherent test grid (Figures 5 and 6), intersections with the alveolar surface contour I(a) are counted, yielding alveolar surface density in septum SV(a,s)
 |
(15) |
where L(s) is the length of the test line contained in septum, ordinarily estimated by counting points P(s) on the septum: L(s) = K1·d·P(s); K1·d is line length per test point (21, 25). Multiplying SV(a,s) by the volume density of each stratified level and by absolute lung volume yields absolute S(a):
 |
(16) |
Figure 6.

Coherent test grids for point counting stereology combining test points PT spaced by distance d with lines of length LT = PT · 2d in an unbiased counting frame of a test area AT = PT · d2. (a) Light micrograph of dog lung with double lattice square grid with PT = 100, of which 25 are marked as coarse point grid; counting is efficient if rare components (∼10%) are counted with the complete grid and frequent components with the coarse grid. (b) Electron micrograph of dog lung with short-line test grid (LT = 21 d, PT = 42, AT = PT · 0.866·d2) for combined estimation of alveolar surface by intersection count with the lines and capillary volume by counting hits of the endpoints. With such a grid counting becomes efficient because the counting events are similar for surface intersections and volume point hits (here I(A) = 10, I(c) = 8, P(c) = 10). Adapted by permission from Reference 30.
The same principles are applied to measure surface density of capillaries per unit volume of septum SV(c,s) and to derive an estimate of absolute S(c).
6.4. Alveolar Number
Earlier models for quantifying alveolar number required assumptions of geometric shape factors (22). This source of bias was removed by the disector method (17). The key step lies in unambiguously identifying alveolar openings into alveolar ducts, marked by their entrance rings forming the network-like duct wall (Figure 7). Network topology is represented by an invariant number: Euler characteristic χ = 1 – n, where n is the number of alveolar entrances. Counting the number of entrance rings in paired sections by the disector technique allows estimation of total number of alveoli in the lung N(a,L) (112, 113). When using multistage stratified sampling (Figure 5), N(a,L) is the product of the number of alveolar openings per unit parenchyma volume (Σn/Vp) with the volume density of parenchyma per unit lung volume VV(p,L) and the absolute lung volume (113):
 |
(17) |
Figure 7.

Unbiased estimation of alveolar number by counting alveolar openings using the physical disector. (a) Under scanning electron microscopy, alveolar openings into the alveolar duct (D) are marked by their entrance rings, thus forming the network-like duct wall. Note that entrance rings at the cut surface of the specimen are visible as free edges of alveolar septae (arrowheads). (b) In practice, the number of entrance rings is counted in paired parallel histological sections using the physical disector technique at light microscopic level. Counting can be performed in both directions—that is, using each section once as sampling section (for counting) and once as look-up section (for comparison) using an unbiased counting frame with exclusion line (red) and inclusion line (green). In histologic sections, the network of alveolar entrance rings is represented by the free edges of alveolar septae (arrowheads). The counting event is the presence of a bridge connecting the free edges of alveolar septae in the sampling section (arrow) but not the look-up section. (b) Adapted by permission from Reference 25.
When using fractionator sampling (Figure 4),
 |
(18) |
where n is the number of alveolar openings per sample and SF is total sampling fraction, the product of the fractions of tissue bars, blocks, heights, and areas that are sampled at each level (99, 112). When estimating alveolar number using a multistage cascade sampling scheme, global specimen shrinkage should be monitored and corrected for, whereas using fractionator sampling, shrinkage may be ignored.
6.5. Alveolar Size and its Variability
The “number-weighted” mean alveolar volume,
 , is estimated indirectly by dividing total
volume of alveolar airspaces (excluding that of alveolar ducts), V(a,L), obtained by point
counting, by total alveolar number, N(a,L), obtained by the disector:
, is estimated indirectly by dividing total
volume of alveolar airspaces (excluding that of alveolar ducts), V(a,L), obtained by point
counting, by total alveolar number, N(a,L), obtained by the disector:
 |
(19) |
Alternatively, the point-sampled intercept method (48) allows estimation of “volume-weighted” mean alveolar volume,
 , as
, as
 |
(20) |
where  is the mean of the
cubed point-sampled intercepts of alveoli, again excluding that of alveolar ducts. When
both
is the mean of the
cubed point-sampled intercepts of alveoli, again excluding that of alveolar ducts. When
both  and
and  are
known, alveolar size variability can be extracted because volume-weighted mean volume
equals the number-weighted mean volume amplified by the relative variance,
CVN2 (48):
are
known, alveolar size variability can be extracted because volume-weighted mean volume
equals the number-weighted mean volume amplified by the relative variance,
CVN2 (48):
 |
(21) |
The coefficient of variation of alveolar volume can thus be estimated. Alveolar size as seen in fixed specimens depends on the inflation state during fixation and subsequent shrinkage during processing. Such measurements are meaningful only if these sources of variability are defined and standardized and if alveolar architecture is preserved.
6.6. Mean Linear Intercept
A popular, but often misinterpreted, measure of lung architecture is “mean linear intercept length” (or “mean chord length”) Lm, which is the mean length of line segments on random test lines spanning the airspace between intersections of the line with the alveolar surface (Figure 8). Chord lines often cross from one alveolus through an alveolar duct to an opposite alveolus, indicating that Lm characterizes the entire acinar airspace complex and not just alveoli. In simplest terms, Lm is an estimator of volume-to-surface ratio of acinar airspaces (V/S)airspace, alveoli and alveolar ducts taken together:
 |
(22) |
where V(airspace) is air volume in alveoli and ducts, and S(a) is alveolar surface area (7, 24, 114–117). Two methods can be used to estimate Lm (118).
Figure 8.

Principle of chord length measurement. Perfusion-fixed rabbit lung with a set of test lines for measuring chord lengths between intersections with the alveolar surface. Intercepts, marked by double-ended arrows, are measured if the solid part of the test line intersects an alveolar surface at least once (118). Note that some intercepts span one alveolus (A), whereas others cross the alveolar duct between two alveoli (D).
(1) In analogy to the estimation of alveolar surface density, Lm can be estimated, in the first place, by simple point and intersection counting using a suitable coherent test line system with unit length d (Figures 5 and 6)—that is, counting points hitting airspaces P(airspace) and intersections of a test line system with alveolar surface I(a) to obtain
 |
(23) |
With proper sampling and interpretation, this method of estimating Lm is unbiased. Note that Lm and the reciprocal of alveolar surface density in parenchymal volume, SV(a,p), are nearly the same, with one exception: Lm relates to airspaces, whereas the reference for SV(a,p) includes the volume of interalveolar septal tissue. In fibrotic lungs this difference can be significant; the correct measurement of Lm must exclude the volume occupied by the septa and limit the measurement to airspaces (Figure 8), which requires adequate magnification.
(2) Digitization of images combined with computer-assisted image analysis allows linear integration of chord lengths measured automatically or semi-automatically on a set of test lines randomly placed on a microscope field (Figure 8). From these measurements the chord length distribution, Lm, and other moments of the distribution can be calculated (118). The problem with this approach is the automated recognition of bona fide airspace intercepts; thresholding and setting lower cut-offs are approximations that introduce unknown biases. Observer intervention is required to ascertain the true intercepts on a limited sample of random test lines (Figure 8) with the computer suggesting intercepts and measuring those accepted. In view of large variability between pulmonary regions and individuals, there is very limited gain in precision by measuring, on single images, all intercepts generated by the scan. This approach is more laborious than the counting method, but justified if more information is sought than mean chord length.
Lm is often misconstrued as a measure of “airspace size.” This is incorrect because Lm reflects particle size only if the particles (alveoli) are convex (i.e., a line traversing the particle gives rise to only one intercept). Acinar airspaces do not fulfill this criterion (118) (Figure 8). The best characterization is that Lm estimates the “mean free distance” between gas exchange surfaces within the 3D acinar surface complex (alveoli and ducts) (26). Thus, Lm can characterize the movement of gas molecules within peripheral airspaces (e.g., in correlation with 3He diffusion rates within airspaces assessed by functional MRI) (71, 119, 120).
6.7. Air–Blood Barrier Thickness
The arithmetic mean thickness ( ) of air–blood
barrier measures alveolar tissue volume per surface area by point and intersection
counting (i.e., ratio of tissue volume density to alveolar surface density):
) of air–blood
barrier measures alveolar tissue volume per surface area by point and intersection
counting (i.e., ratio of tissue volume density to alveolar surface density):
 |
(24) |
The harmonic mean barrier thickness (τh) is a measure of the diffusion
resistance of air–blood barrier, where the thin barrier parts are weighed more
heavily in the morphometric estimation of lung diffusing capacity (87, 121). High-resolution
EM images (> 8,000×) are overlaid with random test lines, the intercept lengths
between alveolar surface and erythrocyte membrane are measured and 1/τh is
obtained as 2/3 of the mean of the reciprocals of the intercept lengths (87). The magnitude of
 is
usually several times greater than τh. The intercept lengths may also be
used to derive distributions of barrier thickness, which may be useful in documenting
barrier pathology (122).
is
usually several times greater than τh. The intercept lengths may also be
used to derive distributions of barrier thickness, which may be useful in documenting
barrier pathology (122).
An alternative method measures orthogonal (rather than random) intercept lengths on
random section planes where the membrane appears as a band bounded by the alveolar
epithelial surface. Random points are sampled on this surface trace by IUR test lines; the
perpendicular linear distance from this point to the nearest point on the opposite surface
(e.g., capillary endothelium or erythrocyte membrane) is measured (123). Distribution of orthogonal intercept lengths is narrower than
that of random intercept lengths, thus yielding estimates of
 and
τh with smaller variances.
and
τh with smaller variances.
6.8. Morphometric Estimation of Lung Diffusing Capacity
None of the above morphometric parameters alone adequately relates to the functional
capacity of the lung (i.e., lung diffusing capacity for oxygen,
DlO2), which is rather determined by the joint
contribution of the volume of alveolar capillary blood Vc, the intra-acinar alveolar and
capillary surfaces, S(a) and S(c), respectively, and the harmonic mean air–blood
barrier thickness, τh. These components also interact dynamically with
varying ventilation and perfusion. In simplified terms, alveolar O2 uptake can
be conceptualized as occurring in two major steps: diffusion across the membrane barrier
and binding to capillary hemoglobin. These steps impose resistances (1/D) of the alveolar
membrane barrier and capillary blood,  and
and  ,
respectively, such that total resistance is (121, 124, 125):
,
respectively, such that total resistance is (121, 124, 125):
 |
(25) |
where Dmembrane and Dblood are determined by morphometric parameters:
 |
(26) |
 |
(27) |
with KO2 = Krogh permeability coefficient for tissue and θO2 = empirical rate of O2 uptake by capillary blood. Morphometric DLO2 does not take into account diffusion across intra-acinar airways (126, 127) or various dynamic factors, for example, distributions of perfusion and capillary erythrocytes with respect to diffusion surfaces, which influence alveolar O2 uptake in vivo. Morphometric DlO2 exceeds the corresponding DlO2 estimated by physiologic methods at rest. Upon exercise, physiologic DlO2 progressively increases owing to recruitment of alveolar-capillary reserves, and approaches morphometric DlO2 at peak exercise (30, 128). Therefore, morphometric DlO2 provides a meaningful estimation of the structural capacity for alveolar O2 diffusion. Alveolar O2 flux is far below capacity of the organ in the basal physiologic state, but increases and approaches the upper limit imposed by structure when alveolar-capillary reserves are fully recruited.
6.9. Selecting Suitable Test Systems
In the spirit of optimizing sample selection known as “do more less well” (38, 39), a simple coherent test system is always the best. Usually 100 to 200 probe “hits” of the structure of interest (points, lines, or transections of planes or disectors), well distributed among about 50 fields and 10 blocks, are adequate to estimate stereological parameters per subject (90, 104). Multipurpose test systems that meet these requirements include, for example, M42, which consists of 42 test lines each with 2 ends as test points, and double density lattice grids with a ratio of 4 fine points per coarse point (Figure 6) (21).
7. ASSESSING LUNG CELL ULTRASTRUCTURE
Quantification of lung ultrastructure requires a fixation-processing protocol designed for transmission EM, which in the case of immunogold labeling must also expose epitopes, necessitating a compromise between preservation of ultrastructure and antigenicity (Section 3) (54, 55, 80). Many lung diseases are associated with hyperplasia and/or hypertrophy of certain cell types (e.g., type II alveolar epithelial cells). To distinguish between these mechanisms, the number and mean size of cells should be estimated. Changes in cell synthetic or secretory activity might be reflected by changes in number and/or size of organelles (e.g., lamellar bodies). Cell number is also important for assessing the influx of inflammatory cells into lung compartments (e.g., intra-alveolar, interstitial, intravascular). Moreover, distribution of nanoparticles or immunogold labels can be quantified under high-magnification EM.
7.1. Cells and Organelles
Useful parameters for characterizing cells and organelles include volume, number, mean size, and surface area. These parameters must be related to a meaningful reference volume, which is usually total lung volume (for cells) and mean cell volume (for organelles). The volume of any cell type can be estimated via point counting in a stratified sampling design or, alternatively, as the product of cell number and mean cell size. Cell number per lung, whether resident cells or mobile inflammatory cells, can be directly estimated using disectors (Table 1) under either LM or EM (129, 130). In conventional transmission EM, only the physical disector can be applied, a rather time-consuming approach. The advent of electron tomography could overcome this limitation by providing optical disectors in 3D stacks of ultrathin serial images (43). Depending on the sampling strategy, disector estimates can be combined with stratified sampling (“density × reference volume”) (e.g., References 113, 131, 132) or a fractionator design (“total counts × sampling fraction”) (e.g., References 92, 99, 112, 133). Because the disector is not only a tool for counting particles but also for sampling them with equal probability, it can be used to directly estimate mean cell size and size distribution (Section 2.1, d and e). Alternatively, mean cell size can be estimated indirectly from the ratio (cell volume density/cell number density) (Table 1). When the number- and volume-weighted mean cell sizes are known, size heterogeneity can also be estimated, since the volume-weighted mean volume equals the number-weighted mean volume amplified by the relative variance (Section 6.5), which is valuable for assessing the degree of cell (de-)differentiation (48).
7.2. Ultrasmall Particles: Immunoelectron Microscopy
For subcellular localization of gene products, immunoelectron microscopy using colloidal gold as an immuno-marker is the method of choice, and can be combined with stereology to quantify the distribution of labeled gold particles (see reviews in References 54, 134, 135).
Specific questions may include: (1) In which compartments do gold particles reside? (2) Are there compartments that are preferentially labeled, and, if so, which ones?, or (3) Does overall particle distribution change between experimental groups? Efficient methods to answer these questions involve counting gold particles per compartment (questions 1 and 3) or estimating the relative labeling index (RLI, question 2), a measure that compares compartmental labeling to random labeling (136). RLI is used to compare an observed distribution of gold particles associated with defined cell compartments (whose relative volumes or surface areas are estimated by stereology using point or intersection counting, respectively) with an expected distribution that would occur if the same total number of gold particles were scattered randomly according to the relative compartmental volumes or surfaces. The observed number of gold particles (Nobserved) within a cell compartment is obtained by counting these particles in a systematic uniform random sample of cell profiles. The expected distribution of gold particles in each compartment (Nexpected) is obtained from the total number of point or intersection counts across compartments. The RLI for each compartment is the observed value divided by the expected value:
 |
(28) |
Thus, RLI = 1 indicates purely random labeling. Preferential compartmental labeling is defined by two criteria: (1) RLI is significantly higher than 1, and (2) by χ2-analysis the compartmental partial χ2-value contributes substantially to the total χ2-value of all compartments. Raw gold particle distributions between groups can be compared directly by contingency table analysis and has been successfully applied to the lung (137–139). The RLI method, developed for immunogold particles on sections after postembedding labeling (136, 140–142), has been extended to analyze the distribution of airborne or synthetic nanoparticles within cell compartments, then termed relative deposition index (RDI) (81, 143). A potential problem with nanoparticles is that they are distributed through the full section depth rather than confined to its cut surface.
While RLI addresses the three questions above with respect to preferential labeling, RLI per se does not address the question of specificity of labeling, which depends on the quality of the antibody, its interaction with the antigen, and other factors unrelated to stereology.
8. ASSESSING AIRWAY AND VASCULATURE SYSTEMS
8.1. Bronchovascular Hierarchy
The airway hierarchy connects a small entrance (trachea, cross-section 2.5 cm2) to a large alveolar gas exchange surface (> 100 m2 in humans) via sequential, irregular, dichotomous branching; the number of branches doubles with each generation. The gas exchange apparatus forms a sleeve of alveoli on the surface of approximately eight generations of the most distal airways. Two functionally distinct regions require different analytical strategies: (1) conducting airways have a multilayered wall with mucous membrane, smooth muscle, and in part cartilage; and (2) acinar airways are intimately associated with gas exchanging alveoli. Because these two airway regions have different structure-function characteristics, their position in the airway tree must be identified. To capture the entire network, a binary coding system has been used (144); for general purposes, it is sufficient to identify the position of the airway by noting the generation Z of a dichotomous tree (Figure 9A), with the trachea being generation 0. The number of branches in generation Z = 2Z.
Figure 9.

Airway branch ordering systems. (A) Dichotomy; (B) Strahler ordering system.
Dichotomous branching with fractal properties is the basic rule of airway morphogenesis, with considerable species differences in the degree of irregularity (145). The main bronchial tracts follow the form of the lobe they serve. Where lobes are slim and elongated (e.g., rodents), the bronchial tract follows the main axis, giving off smaller side branches to supply segments and lobules (i.e., “monopodial” branching). To account for this irregularity, airways can be ordered by numbering in reverse order, beginning at a peripheral size class (“order-1”) and then to increase the order whenever two airways of the same order converge. Two order-2 airways converge into order-3, but when an order-1 converges with an order-2 airway the airway continues as order-2 (Figure 9B); this is called Strahler ordering, a variant of which is Horsfield ordering (146). Whereas in dichotomous branching the branching ratio Rb=2, in Strahler or Horsfield ordering Rb>2 depending on the degree of asymmetry; it describes the ratio of the number of branches from one order to the next.
The dichotomous model stresses connectivity and network architecture, allowing assessment of branching asymmetry at different levels. Strahler ordering sacrifices connectivity by grouping airways of similar size and structural features in the same order. Physiologists may find the dichotomous system useful, whereas Strahler system may be more useful in pathology.
Pulmonary arteries follow the airways in a similar branching pattern except that, at nearly all levels, small “supernumerary” branches arise from the main vessel to perfuse nearby parenchyma (147); consequently, pulmonary arteries branch over approximately five more generations than airways before reaching capillaries (22). Pulmonary arteries have been ordered according to Strahler (148); because of supernumerary branches the order numbers of arteries and airways are not congruent. Pulmonary veins course independent of airways in an intermediate position related to interlobular septa, converging on the left atrium in four main stems. In small lungs, peripheral veins converge onto main veins that course close to the monopodial airway.
8.2. Conducting Airways
Airway sampling must account for their hierarchical positions because (1) size and structure of airway wall depend on this position, (2) location in the connectivity matrix is functionally important, and (3) there are regional differences.
8.2.1. Database for functional lung models.
Functional airway models are used to answer questions such as distribution of ventilation, relative role of convection and diffusion along the airway tree, or deposition of inhaled particles and the ensuing tissue reaction. Model conception and construction depend on a sound database of airway dimensions along tree generations (e.g., length, diameter of segments, and branching angles). Such data can be obtained on corrosion airway casts prepared with resins (24, 149, 150) or silicon rubber (144, 151). Silicon rubber cast is flexible, easy to manipulate, filling even the most peripheral airways (152, 153), and the preparation can be trimmed to a certain airway size for analysis (154). The parameters length, diameter of segments, and branching angles are estimated by systematic progression along the tree. This procedure becomes problematic beyond generation 7 because several hundred airways must be measured. Sampling becomes essential, but no satisfactory solution is yet available for efficient unbiased and regionally representative sampling of peripheral airways. It remains to be explored whether a “hierarchical fractionator” sampling scheme (155) can be developed. It is essential that airway samples be assigned to the hierarchical network either in an irregular dichotomous model with identifiable connectivity, or a Strahler/Horsfield ordering system. Ordering the generations for unbiased sampling is also essential for assessing airway dimensions by nondestructive approaches such as 3D reconstruction using multidetector CT (MDCT) (156–158) (Section 10).
8.2.2. Quantifying airway pathology.
The main challenge is to sample airway tissue without bias and localize samples with respect to airway hierarchy. It is not necessary to reconstruct connectivity. Position identification is easy if the sample is obtained by biopsy (Section 9), but the range of accessible airways is limited. Different strategies are required for histologic analysis of nonuniformly orientated large airways (down to segmental bronchi) and for peripheral bronchi and bronchioles where spatial orientation is more uniform. Major airways can be traced by dissection. For smaller airways, an unbiased stratified sampling scheme can be designed, beginning with serial slicing of the lung and subsampling of airway profiles on the cut surfaces. Vertical sections are most appropriate for sampling anisotropic tubes (Figure 3). Because the probability of hitting an airway by the cutting plane is determined by airway length (or a projection of this length normal to the cutting plane), subsampling is done using a set of unbiased counting frames. Airway profiles that are sampled by a counting frame are selected. The samples can be assigned to size class bins (profile diameter 1–2 mm, 2–3 mm, etc.), which allow their localization to the airway hierarchy on a Strahler ordering system (150). Because sampling frequency is proportional to airway length, small airways may be sampled at a relatively high frequency because their total length is greater than that of larger airways (24). Further subsampling may be necessary to reduce small airway samples to a practicable number. Alternatively, microdissection can be used to define and localize samples to airway generations (34, 159).
Estimates of airway wall composition are best obtained by point and intersection counting, using, for example, the epithelial reticular basement membrane surface as a (local) reference parameter (23). With a test grid of lines and points, one counts intersections with the basement membrane, I(bm), as an estimate of its surface area, S(bm), represented in the sample and point hits on structure x (e.g., epithelial cells), P(x), are counted to yield a ratio of volume of x relative to surface of basement membrane:
 |
(29) |
where d is the spacing of test points and k is a factor that depends on the test system used (21). For layered structures (epithelium, smooth muscle sheath), V(x)/S(bm) is an estimate of (arithmetic) mean thickness of the sheet. Cell numbers are counted in a similar way using a disector test system and relating this number to S(bm).
If it is necessary to encompass the entire depth and circumference of the bronchial wall, airway cross-sections must be sampled. The procedure is to (1) obtain a uniform random sample of bronchi of a certain size class (above) irrespective of their orientation; (2) embed and reorient the sample to obtain cross-sections; and (3) obtain stereological estimates of wall components by point counting, with the epithelial reticular basement membrane surface area as reference parameter using an appropriate test grid. The “thickness” or volume-per-surface of structure x is
 |
(30) |
where 2/π replaces 1/2 because the basement membrane is not cut IUR but as the cross-sectional contour of a tube (23).
8.3. Acinar Airways
Intra-acinar airways continue to branch but their wall becomes reduced to the network of alveolar entrance rings as part of the axial fiber system of the lung; such airways are called alveolar ducts as long as they divide without reaching the terminal alveolar sac. Essential morphometric parameters of the acinus are its overall size (volume and path length along air ducts), diameter and length of the ducts, and the gas exchange surface on airway segments. Morphometric assessment should retain connectivity of the units. Two approaches are immediately accessible:
(1) Serial section reconstruction allows detailed assessment of connectivity as well as alveolar structure and the associated vasculature (160). Sampling acini for reconstruction is difficult. One approach is to use fractionator sampling down to tissue blocks large enough to contain a few acini, identify the first respiratory bronchiole (carrying alveoli), and then reconstruct the acinus volume (i.e., upward and downward). The diameter of a human acinus measures approximately 5 mm; with 10-μm section thickness, a minimum of 500 to 1,000 serial sections are required to assess the entire acinus.
(2) Acinar casts can be made by injecting silicon rubber to completely fill all airways and alveoli (152, 153). After solidification, the tissue is corroded, resulting in a flexible cast. Upon dissection of this cast, airways are followed and the origin of an acinus located by the appearance of the first respiratory bronchiole decorated with alveoli; connectivity, diameter, and length of duct segments can be measured by stereomicroscopy (152, 153). Random sampling of acini consists of two steps: (1) lobules containing bundles of acini are sampled for regional representation, preferably using the fractionator; (2) for each bundle, the collection of acini is subsampled by ensuring uniformity with respect to size distribution (153).
8.4. Pulmonary Vascular Tree
8.4.1. Database for functional lung models.
The strategies for studying the vasculature are similar to those for studying airways. The essential information is mapping the dimensions of pulmonary arteries and veins, which can be assessed on vascular casts prepared under well-controlled perfusion pressure, injectate viscosity, and lung inflation state, using either resins (161–163) or silicon rubber (148). Such casts can be systematically dissected for measuring vessel length and internal diameter in relation to branching hierarchy. Sampling proceeds in several stages (164): (1) “backbone” of main artery; (2) subtrees arising from the backbone; (3) daughter trees with diameter of 600 to 800 μm trimmed from each subtree. At each level a number of randomly selected sample trees are measured until the entire tree is sketched. Vessel hierarchy is recorded using a Strahler ordering system (Figure 9B) with modification for the occurrence of small supernumerary arteries. Such datasets have been used to construct in silico models of pulmonary vasculature (165).
8.4.2. Quantifying vascular structure.
Vascular sampling is analogous to airway sampling. The size of arteries as they appear in the fixed lung may be too small because of contraction of the arterial wall when blood pressure falls to zero; conversely, the veins may be engorged by blood pushed over from arteries. Furthermore, experimental interventions or pathologic processes or fixation methods (78) may modify vessel size; hence, assignment of vessels to size classes on such preparations must be considered critically. Small vessels may be sampled by microdissection (166).
Measurement of vascular wall follows the same procedure as that for airway wall: (1) obtain a random sample of vessels of a certain size class irrespective of orientation from IUR sections, (2) embed and reorient sample to obtain vessel cross-sections; (3) estimate wall components using point and intersection counting, with the surface area of the internal elastic membrane, S(em), as a reference space, preferably by EM—as the internal elastic membrane of small vessels may be hard to follow in LM, particularly in the contracted state. This procedure normalizes arterial dimensions for the effect of contraction, which causes medial thickening and crenation of elastic membrane (24).
9. BIOPSIES
9.1. General Issues
Endobronchial and transbronchial biopsies are obtained via the airways, whereas video-assisted thoracoscopic and open lung biopsies are taken through the chest wall. Stereologic analysis of biopsy specimens has been discussed in a separate workshop report (167) and outlined here:
Biopsy sites are nonrandom, due to technical limitations (e.g., endobronchial biopsies are taken from the carina or subcarina and not the lateral airway wall), or because they are directed to regions most affected by the pathologic process (168).
The tissue is partially or completely collapsed. Crush artifact may be present.
Methods of tissue fixation and preparation are often constrained by specific diagnostic requirements.
The reference space is restricted to the biopsy specimen and not representative of the whole organ. Where biopsy is targeted, volume of the target compartment (e.g., primary tumor or total volume of lung metastases) may be estimated using radiological techniques, but this reference volume is limited to solid tissue and cannot be applied to biopsies of aerated lung because volume of the sample ex vivo (prior to fixation and embedding) differs significantly from that in the in vivo state. Total lung volume cannot be used as a reference volume.
These constraints are present whether or not stereology is used in assessing biopsy samples. Nonetheless, stereologic techniques help avoid bias and improve the validity of analysis. For example, applying the disector technique to lung biopsy specimens allows numerical cell density to be reliably determined, thereby distinguishing cellular hypertrophy from hyperplasia (37, 169, 170).
9.2. Endobronchial and Transbronchial Biopsies
9.2.1. Sampling.
Quantification relies on local estimators within the specimen. Orientation of structures is neither isotropic nor uniform. Options for handling of orientation include the generation of IUR sections using an isector mold (Figure 4) or vertical sectioning (Figure 3), with the vertical direction perpendicular to the epithelial surface (19).
9.2.2. Fixation and preparation.
While inflation pressures cannot be controlled during fixation and the preferred fixatives may depend on study goal, local laboratory capability, requirements of multicenter studies, and the need to maintain comparability with archival material, faithful structural preservation remains essential to avoid quantifying artifacts rather than true structural changes. For example, when using snap freezing and cryostat sectioning for immunohistochemistry, the structural preservation may not be adequate for morphometry.
9.2.3. Defining the reference space.
In airway biopsies, the measured dimensions of mucosal components have been standardized with respect to the surface area of intact epithelial reticular basement membrane (169, 171, 172), and to the volume of the tissue compartment surveyed, even though the true reference space (e.g., total volume of airway tissue or airway surface area) is unknown. The best reference space for local estimation in the interstitial (subepithelial) compartment is less certain because this compartment is incompletely sampled in biopsy specimens (37).
The same considerations applies to transbronchial biopsies, with the exception that in the latter the measured parameters may be expressed per unit volume of the biopsy specimen, or, with respect to the unit area of alveolar basement membrane assessed under EM.
9.3. Thoracoscopic and Open Lung Biopsy
These biopsies yield wedge-shaped specimens with a pleural base. They are typically greater than 1 cm along each dimension in children (173) and up to 4 cm in adults (168), large enough for subdivision into separate portions for different purposes. Each portion should extend from the pleural base to the deepest part of the biopsy so that it is representative of the whole sample and not only a sub-region. Regions near the edges should not be sampled due to possible crush artifacts. Subdivided portions are usually fixed by simple immersion, or they may be partially inflated (174) by gently injecting fixatives into the specimen through the pleural surface using a small syringe and needle until the fixative drains freely from the cut surfaces. This procedure partially expands alveoli and removes much of the crush artifact. With a recognizable, relatively flat surface always present, vertical sections are optimal. Alternatively, IUR sections can be generated using the orientator (94) or isector (95). Measured parameters (volume, surface area, length. and number) can be reported as densities referred to local reference parameters (e.g., boundary surface between epithelium and reticular basement membrane in EM studies) (44).
10. QUANTITATIVE STRUCTURAL ASSESSMENT USING IN VIVO IMAGING TECHNIQUES
10.1. Combining Stereology and In Vivo Imaging Techniques
Combining stereology with in vivo lung imaging holds great potential for structural assessment in three major respects: (1) stereology can be directly applied to analyze in vivo imaging datasets using unbiased sampling procedures and test systems (e.g., Cavalieri principle, ALP-sector, or disector); (2) quantitative structural data obtained by in vivo imaging may need to be validated against histomorphometry, (3) microscopy-based stereology complements in vivo imaging and extends it to higher levels of resolution (e.g., EM). It must be noted that the slice thickness may introduce a bias due to overprojection of dense components along their edges, which may therefore be overestimated (3). Accordingly, alveolar septa or airway wall thickness may be larger on CT slices than on corresponding microscopic sections.
10.2. Computed Tomography
CT imaging permits the assessment of lung volume, regional gas volume, bronchovascular structures as well as functional parameters such as regional perfusion and ventilation (175). Advances in CT technology have reduced the time for whole lung imaging to 5 to 10 seconds, fueling a growing demand for rigorous validation of CT-derived quantitative measures in application to drug/device discovery as well as safety and outcomes assessment. With the rapid progress in genome-wide searches, there is an additional need to use these quantitative measures along with characteristic pathology to establish disease phenotypes and to identify gene associations. Clearly, stronger links between stereology and CT image analysis need to be established.
10.2.1. Lung volume, air, and tissue volumes.
Volumetric imaging using multidetector computed tomography (MDCT) performed at a fixed lung volume allows the partition of global or regional lung volumes into air and tissue (including microvascular blood) volumes (176–178) and the tissue/air volume ratio, estimated from their respective in vivo X-ray attenuation values. Correlation of CT attenuation values (in Hounsfield Units) to lung biopsy samples has been used to translate quantitative radiologic data into morphometric estimates of surface-to-volume ratios or gas volume per gm of tissue (107, 179). These CT-derived parameters have been used to follow developmental and compensatory lung growth (180–182), and to assess structural derangement in idiopathic pulmonary fibrosis (183) and emphysema (107). In vivo CT estimates of air and tissue volumes significantly correlate with independent estimates obtained by histomorphometry (106, 108), although in direct comparisons CT-derived (tissue+blood) volume is systematically larger than alveolar septal volume estimated after fixation by morphometry (108) and antemortem by physiological methods (181); CT-derived lung gas volume is modestly lower than that measured antemortem by helium dilution (181, 184). Additional measures (e.g., parenchymal texture analysis) take into account the pattern as well as the magnitude of attenuation values, permitting further quantitative detection of regional pathology (185, 186). All of these methods require design-based validation to link them with structural reality.
There is growing awareness for the judicious use of CT because of the small but real risk of radiation exposure. It is possible to limit radiation without sacrificing the accuracy of quantitative information, by implementing limited CT sampling of the lung with the sampling tools outlined in this document. For example, noncontiguous high-resolution images (1 mm thick) may be obtained at a constant interval (e.g., 10 mm apart) throughout the lung. Lung volume can be directly estimated using the Cavalieri principle (Section 5.1.2), as has been shown in other organs (187). The lung is either outlined, or point counting may be used to estimate its area. By identifying inter-lobar fissures, each lobe can be measured separately. Using point-counting, major bronchovascular structures and lymph nodes larger than a defined diameter can be reliably excluded to obtain an estimate of parenchymal volume.
10.2.2. Reconstruction of airways and blood vessels.
Images obtained by MDCT can be segmented into the right and left lung as well as lobes and airways (188–190). Segmented airways are skeletonized with the branch points at their correct anatomic locations (191) to identify airway segments (192). Physical measurements (e.g., diameter, cross-sectional area, airway wall area and thickness, luminal perimeter) are made in the original gray-level CT volume (193) in 2D slices that are re-sampled perpendicular to the centerline of a segment. The measured geometry is stored in a “tree file” that records the location of bifurcation points, linkage to the tree skeleton, location of discrete points that trace the path of the airway, and the airway cross-sectional area orthogonal to each centerline point. The resulting dataset can be used to reconstruct the first 6 to 10 bronchial generations and build individualized models of the bronchovascular tree (157). Airway dimensions measured in vivo by this method agree well with those obtained on casts, and can be used to validate or rescale hierarchical measurements obtained on casts (24, 144, 149, 151) and allow construction of in silico models of the pulmonary airways down to the acinar airways (157).
10.3. Micro-CT
Micro-CT has been used to image the lung in vivo (10–15 μm resolution) and postmortem (down to 1–2 μm resolution). For in vivo imaging, respiratory motion must be eliminated by breath-holding at a fixed lung volume (194). A major advantage of micro-CT is that the dataset consists of equi-axial voxels (equal dimension on all sides), which permits virtual slicing of small lung blocks from multiple angles, and provides an important tool for cross-comparison with traditional microscopy to determine the effects of slice orientation on morphometric measurements. Furthermore, the ability to image the same lung in vivo and postmortem allows assessment of the alterations that occur after death and tissue fixation.
In vivo data obtained from MDCT and magnetic resonance imaging (MRI) have been compared with postoperative or postmortem micro-CT images of excised lung specimens and to morphometry (179, 195, 196). In one example, excised lungs were air-inflated at a constant transpulmonary pressure while suspended in liquid nitrogen fumes (71). The intact frozen lung was subjected to high-resolution CT to provide the reference volume for multistage sampling (Section 4.2.1). While kept frozen on dry ice, the lung was serially sliced at a constant interval and tissue samples were collected using a precooled thin-walled “cork borer,” placed in precooled (−40°C) acetone solution with 1% glutaraldehyde, allowed to fix at −80°C for 2 h, then postfixed in osmium after warming to room temperature and critical point dried. The fixed tissue cores were imaged by micro-CT at an isotropic resolution (8–16 μm) sufficient for measuring surface-to-volume ratio. The same core samples may be further processed for morphometry and gene expression assays (70). However, freezing tissue introduces cellular artifacts that limit the resolution of ultrastructural details under EM (73).
Currently, micro-CT reaches sufficiently high resolutions for alveolar imaging only in chemically fixed tissue. This approach permits postmortem nondestructive stereology without tissue dissection, embedding, and sectioning. Whole lung scans can be used to choose regions for high-resolution micro-CT according to stereological principles. In a first step, Cavalieri principle is used to estimate total lung volume and major subcomponent volumes. Next, systemic uniform random (SUR) sampling is applied to select sample positions and, if necessary, spatial orientation for high-resolution micro-CT, to estimate volume of alveoli and alveolar ducts, alveolar surface, septal tissue volume, septal thickness, and alveolar number and size.
10.4. Functional Lung Imaging Techniques
In addition to CT, MRI, positron emission tomography (PET), and single photon emission computed tomography (SPECT) provide noninvasive data on functional processes that reflect structural properties and pathology. Quantitative data obtained using these techniques also require validation by comparison with stereological studies performed on CT images or histologic specimens.
10.4.1. Combining MRI with stereology.
One application of morphometry to functional MRI involves the estimation of apparent diffusion coefficient (ADC) of a hyperpolarized gas such as 3He inhaled in lung airspaces (197–199). The ADC is related to the size, shape, and porosity of the space within which the gas diffuses (120), and thus a function of the mean free distance within the airspace; it is affected by anisotropy and tortuosity of distal airways, and by the connectivity of collateral ventilatory channels (e.g., pores of Kohn). The ADC value of hyperpolarized 3He gas in unrestricted air (0.8 cm2/s) is reduced to 0.2 cm2/s in a normal living human lung, and increases in severe emphysema—0.6 cm2/s is common (199, 200); the corresponding values are lower in small animals (198, 201). Applying intersection and point counting to histologic lung specimens related to the MRI permits interpretation of the ADC with respect to morphometric characteristics of peripheral airspaces (71, 119, 201, 202), namely, the alveolar surface-to-volume ratio or its reciprocal, Lm (Section 6.6). Both the ADC and Lm estimate the mean free distance within the combined airspaces of alveolar sacs and ducts. Moreover, the in vivo lung morphometry technique with hyperpolarized 3He diffusion MRI (120) that is based on a geometrical model of lung acinar airways (153) may allow estimation of acinar airways geometrical parameters analogous to those provided by casting techniques (203). The key in comparing techniques is to ensure unbiased tissue sampling and spatial coordination between in vivo MRI and the excised tissue samples, by using image-guided sampling and preparation procedures that retain the original tissue dimensions.
10.4.2. PET and SPECT.
These evolving modalities allow noninvasive measurement of dynamic cellular and molecular processes, for example, metabolic rates, vascular perfusion, capillary filtration, inflammation, or genetic targets in relation to their spatial localization. Understanding these processes requires (1) mapping imaging results onto lung microstructure, and (2) obtaining unbiased measurements of tissue structures associated with the functional processes.
Visualization of the 3D distribution of inhaled or injected radionuclides with PET (204) reflects functional processes such as inflammation or altered permeability, and can potentially guide therapeutic strategies in acute lung injury, provided the results could be interpreted with respect to the underlying structural changes. As lung injury is characterized by heterogeneity, tissue samples for microscopy must be selected by a strategy that allows coordinated registration with PET images; the relative volume represented by the sample on PET images must be estimated by the Cavalieri method (Section 5.1.2). As an example for such studies, increased permeability was induced by oleic acid in dogs and the pulmonary transcapillary escape rate (rPTCER) of 68Ga-transferrin was imaged (205). Image-guided tissue samples with varying rPTCER values were obtained and prepared for light microscopy. Stereological analysis showed that rPTCER correlated not only with the distribution of alveolar edema but more consistently with the relative surface of alveolar septa showing damage to the lining cells of endothelium and epithelium, suggesting that rPTCER may be used as an index of lung injury. Similar strategies can be developed to validate histopathologic interpretation of PET images with respect to ventilation–perfusion inequalities, inflammation, or gene expression. Similar strategies can also be extended to SPECT (206). For such attempts to be successful, it will be important to employ unbiased sampling and measurement procedures to ensure efficiency and accuracy of the results.
11. CONCLUSIONS
Design-based stereology, characterized by accuracy, precision and efficiency, provides a set of tools for sampling and measuring irregular structure. These tools are flexible in that they can be applied to a variety of imaging approaches. For these reasons, this approach has become the gold standard in quantitative structural analysis of different organs, including the lung. This document summarizes the principles and guidelines for basic methodological standards in lung stereology and morphometry, aimed at promoting the uniform application of sound analytical techniques to experimental and translational studies in the lung. Due to space limitation, this document cannot comprehensively cover step-by-step implementation of each technique, the details of which can be found in the appropriate references.
This Statement was prepared by the co-chairs on behalf of a Joint Task Force of the American Thoracic Society and the European Respiratory Society.
Members of the Task Force were:
Connie C.W. Hsia (Co-chair), M.D.
Dallas M. Hyde (Co-chair), Ph.D.
Matthias Ochs (Co-chair), M.D.
Ewald R. Weibel (Co-chair), M.D., D.Sc. (hon)
Kurt H. Albertine, Ph.D.
Peter H. Burri, M.D.
James D. Crapo, M.D.
Heinz Fehrenbach, Ph.D.
Philippe A. Grenier, M.D.
Hans Jørgen G. Gundersen, M.D., D.M.Sci.
Eric A. Hoffman, Ph.D.
James C. Hogg, M.D., Ph.D.
Peter K. Jeffery, D.Sc., Ph.D., M.Sc.
Paul McLoughlin, M.B., Ph.D.
Terence M. Mayhew, Ph.D.
Wayne Mitzner, Ph.D.
Charles G. Plopper, Ph.D.
Daniel P. Schuster†, M.D.
Prescott Woodruff, M.D., M.P.H.
Footnotes
This official statement of the American Thoracic Society (ATS) and the European Respiratory Society (ERS) was approved by the ATS Board of Directors, July, 2009, and the ERS Executive Committee, April 2009.
Deceased.
Conflict of Interest Statement: The following author disclosures were consistent with current American Thoracic Society policy. C.C.W.H reported she did not have a financial relationship with a commercial entity that has an interest in the subject of this manuscript. D.M.H. was a consultant to Genentech (up to $1,000). He received grants from Ligocyte (>$100,000), Schering-Plough/Biopharma (>$100,000); he was on the Board of National Jewish Health (up to $1,000). M.O. reported he did not have a financial relationship with a commercial entity that has an interest in the subject of this manuscript. E.R.W. reported he did not have a financial relationship with a commercial entity that has an interest in the subject of this manuscript. The following disclosures by additional contributors (members of ATS/ERS Joint Task Force) were consistent with American Thoracic Society policy at initiation of project. K.H.A., P.H.B., and J.D.C. reported they did not have a financial relationship with a commercial entity that has an interest in the subject of this manuscript. H.F. received lecture fees from GlaxoSmithKline and Altana Pharma AG. P.A.G. served on the Advisory Board of Philips Medical Systems. H.J.G.G. reported he did not have a financial relationship with a commercial entity that has an interest in the subject of this manuscript. E.A.H. was a consultant to GlaxoSmithKline, Eli Lilly, Sanofi Aventis, Siemens Medical, and Spiration; he was on the Advisory Board of Siemens Medical and received grants from them; he held patents with the University of Iowa, VIDA Diagnostics, and MARVAL; he was founder and shareholder in VIDA Diagnostics. P.K.J. and P.M. reported they did not have a financial relationship with a commercial entity that has an interest in the subject of this manuscript. T.M.M. received royalties from Nottingham University Press. W.M. and C.G.P. reported they did not have a financial relationship with a commercial entity that has an interest in the subject of this manuscript. D.P.S. is deceased and is unable to provide a financial disclosure statement. P.W. had grants from Aerovance (>$100,000) and Genentech ($100,000); he held a patent with the University of California at San Francisco.
References
- 1.Lum H, Mitzner W. Effects of 10% formalin fixation on fixed lung volume and lung tissue shrink: a comparison of eleven laboratory species. Am Rev Respir Dis 1985;132:1078–1083. [DOI] [PubMed] [Google Scholar]
- 2.Kendall MG, Moran PAP. Geometrical probability. London: Charles Griffin and Co., Ltd.; 1963. pp. 1–125.
- 3.Miles RE, Davy PJ. Precise and general conditions for the validity of a comprehensive set of stereological fundamental formulae. J Microsc 1976;107:211–226. [Google Scholar]
- 4.Miles RE, Serra J. Geometrical probability and biological structures: Buffon's 200th anniversary. Lecture notes in biomathematics [Vol 23]. New York: Springer-Verlag; 1978.
- 5.Cruz-Orive LM. Stereology: historical notes and recent evolution. Acta Stereol 1987;6:43–56. [Google Scholar]
- 6.Weibel ER. Stereology in perspective: a mature science evolves. Acta Stereol 1992;11:1–13. [Google Scholar]
- 7.Tomkeieff, S. I. Linear intercepts, areas and volumes. Nature 1945;155:24 [correction on p 107]. [Google Scholar]
- 8.Saltykov SA. The method of intersections in metallography. Zavodskaya Laboratoriya 1946;12:816–825. (in Russian). [Google Scholar]
- 9.Delesse A. Procede mechanique pour determiner la composition des roches. CR Acad Sci (Paris) 1847;25:544–545. [Google Scholar]
- 10.Rosiwal A. Ueber geometrische Gesteinsanalysen. Verh. K. K. Geol. Reichsanst Wien 1898;143–175.
- 11.Thomson E. Quantitative microscopic analysis. J Geol 1930;38:193–222. [Google Scholar]
- 12.Glagolev AA. On geometrical methods of quantitative mineralogic analysis of rocks. Trans Inst Econ Min (Moscow) 1933;59:1–47. [Google Scholar]
- 13.Chalkley HW. Methods for quantitative morphological analysis of tissue. J Natl Cancer Inst 1943;4:47–53. [Google Scholar]
- 14.Wicksell SD. The corpuscle problem. Biometrika 1925;17:84–99. [Google Scholar]
- 15.Dehoff RT, Rhines FN. Determination of the number of particles per unit volume from measurements made on random plane sections: the general cylinder and the ellipsoid. Trans AIME 1961;221:975–982. [Google Scholar]
- 16.Weibel ER, Gomez DM. A principle for counting tissue structures on random sections. J Appl Physiol 1962;17:343–348. [DOI] [PubMed] [Google Scholar]
- 17.Sterio DC. The unbiased estimation of number and sizes of arbitrary particles using the disector. J Microsc 1984;134:127–136. [DOI] [PubMed] [Google Scholar]
- 18.Gundersen HJ, Bagger P, Bendtsen TF, Evans SM, Korbo L, Marcussen N, Moller A, Nielsen K, Nyengaard JR, Pakkenberg B. The new stereological tools: disector, fractionator, nucleator and point sampled intercepts and their use in pathological research and diagnosis. APMIS 1988;96:857–881. [DOI] [PubMed] [Google Scholar]
- 19.Baddeley A, Vedel Jensen EB. Stereology for statisticians. Boca Raton, FL: Chapman and Hall; 2005. pp. 1–395.
- 20.Reed MG, Howard CV. Surface-weighted star volume: concept and estimation. J Microsc 1998;190:350–356. [DOI] [PubMed] [Google Scholar]
- 21.Weibel ER. Stereological methods, vol 1. Practical methods for biological morphometry. London: Academic Press, Inc.; 1979. pp. 1–415.
- 22.Weibel ER, Gomez DM. Architecture of the human lung: use of quantitative methods establishes fundamental relations between size and number of lung structures. Science 1962;137:577–585. [DOI] [PubMed] [Google Scholar]
- 23.Weibel ER. Principles and methods for the morphometric study of the lung and other organs. Lab Invest 1963;12:131–155. [PubMed] [Google Scholar]
- 24.Weibel ER. Morphometry of the human lung. New York: Academic Press; 1963. pp. 1–151.
- 25.Ochs M. A brief update on lung stereology. J Microsc 2006;222:188–200. [DOI] [PubMed] [Google Scholar]
- 26.Weibel ER. Stereological methods, vol. 2. Theoretical foundations. New York: Academic Press; 1980. pp. 1–340.
- 27.Gundersen HJ, Bendtsen TF, Korbo L, Marcussen N, Moller A, Nielsen K, Nyengaard JR, Pakkenberg B, Sorensen FB, Vesterby A, et al. Some new, simple and efficient stereological methods and their use in pathological research and diagnosis. APMIS 1988;96:379–394. [DOI] [PubMed] [Google Scholar]
- 28.Howard CV, Reed MG. Unbiased stereology, 2nd ed. New York: Garland Science/BIOS Scientific; 2005. pp. 1–277.
- 29.Weibel ER, Cruz-Orive LM. Morphometric methods. In: Crystal RG, West JB, Weibel ER, Barnes PJ, editors. The lung: scientific foundations, 2nd ed. Philadelphia: Lippincott-Raven; 1997. pp. 333–344.
- 30.Weibel ER, Hsia CC, Ochs M. How much is there really? Why stereology is essential in lung morphometry. J Appl Physiol 2007;102:459–467. [DOI] [PubMed] [Google Scholar]
- 31.Bolender RP, Hyde DM, Dehoff RT. Lung morphometry: a new generation of tools and experiments for organ, tissue, cell, and molecular biology. Am J Physiol 1993;265:L521–L548. [DOI] [PubMed] [Google Scholar]
- 32.Nyengaard JR, Gundersen HJG. Sampling for stereology in lungs. Eur Respir Rev 2006;15:107–114. [Google Scholar]
- 33.Ochs M. Stereological analysis of acute lung injury. Eur Respir Rev 2006;15:115–121. [Google Scholar]
- 34.Hyde DM, Miller LA, Schelegle ES, Fanucchi MV, Van Winkle LS, Tyler NK, Avdalovic MV, Evans MJ, Kajekar R, Buckpitt AR, et al. Asthma: a comparison of animal models using stereologic methods. Eur Respir Rev 2006;15:122–135. [Google Scholar]
- 35.Fehrenbach H. Animal models of pulmonary emphysema: a stereologist's perspective. Eur Respir Rev 2006;15:136–147. [Google Scholar]
- 36.Hsia CCW. Quantitative morpholoogy of compensatory lung growth. Eur Respir Rev 2006;15:148–156. [Google Scholar]
- 37.Woodruff PG, Innes AL. Quantitative morphology using bronchial biopsies. Eur Respir Rev 2006;15:157–161. [Google Scholar]
- 38.Mathieu O, Cruz-Orive LM, Hoppeler H, Weibel ER. Measuring error and sampling variation in stereology: comparison of the efficiency of various methods for planar image analysis. J Microsc 1981;121:75–88. [DOI] [PubMed] [Google Scholar]
- 39.Gundersen HJ, Osterby R. Optimizing sampling efficiency of stereological studies in biology: or ‘do more less well!’. J Microsc 1981;121:65–73. [DOI] [PubMed] [Google Scholar]
- 40.Gupta M, Mayhew TM, Bedi KS, Sharma AK, White FH. Inter-animal variation and its influence on the overall precision of morphometric estimates based on nested sampling designs. J Microsc 1983;131:147–154. [DOI] [PubMed] [Google Scholar]
- 41.West MJ, Gundersen HJ. Unbiased stereological estimation of the number of neurons in the human hippocampus. J Comp Neurol 1990;296:1–22. [DOI] [PubMed] [Google Scholar]
- 42.Howell K, Hopkins N, McLoughlin P. Combined confocal microscopy and stereology: a highly efficient and unbiased approach to quantitative structural measurement in tissues. Exp Physiol 2002;87:747–756. [DOI] [PubMed] [Google Scholar]
- 43.Vanhecke D, Studer D, Ochs M. Stereology meets electron tomography: towards quantitative 3D electron microscopy. J Struct Biol 2007;159:443–450. [DOI] [PubMed] [Google Scholar]
- 44.Vedel Jensen EB. Local stereology. Singapore: World Scientific Publishers; 1998.
- 45.Cruz-Orive LM. Editorial. J Microsc 1988;151:1–2. [Google Scholar]
- 46.Gundersen HJ. The nucleator. J Microsc 1988;151:3–21. [DOI] [PubMed] [Google Scholar]
- 47.Vedel Jensen EB, Gundersen HJG. The rotator. J Microsc 1993;170:35–44. [Google Scholar]
- 48.Gundersen HJ, Jensen EB. Stereological estimation of the volume-weighted mean volume of arbitrary particles observed on random sections. J Microsc 1985;138:127–142. [DOI] [PubMed] [Google Scholar]
- 49.Nyengaard JR. Stereologic methods and their application in kidney research. J Am Soc Nephrol 1999;10:1100–1123. [DOI] [PubMed] [Google Scholar]
- 50.Schmitz C, Hof PR. Design-based stereology in neuroscience. Neuroscience 2005;130:813–831. [DOI] [PubMed] [Google Scholar]
- 51.Weibel ER. Morphometric and stereological methods in respiratory physiology, including fixation techniques. In: Otis AB, editor. Techniques in the life sciences, part 1: Respiratory physiology. Ireland: Elsevier; 1984. pp. 1–35.
- 52.Hayat MA. Principles and techniques of electron microscoopy: biological applications, 4th ed. Cambridge: Cambridge University Press; 2000.
- 53.Kiernan JA. Histological and histochemical methods, 3rd ed. New York: A Hodder Arnold Publication; 1999. pp. 1–502.
- 54.Griffiths G. Fine structure immunocytochemistry. Berlin: Springer; 1993. pp. 1–459.
- 55.Skepper JN. Immunocytochemical strategies for electron microscopy: choice or compromise. J Microsc 2000;199:1–36. [DOI] [PubMed] [Google Scholar]
- 56.Sabatini DD, Bensch K, Barrnett RJ. Cytochemistry and electron microscopy: the preservation of cellular ultrastructure and enzymatic activity by aldehyde fixation. J Cell Biol 1963;17:19–58. [DOI] [PMC free article] [PubMed] [Google Scholar]
- 57.Kiernan J. Formaldehyde, formalin, paraformaldehyde and glutaralhyde: what they are and what they do. Microsc Today 2000;8:8–12. [Google Scholar]
- 58.Karnovsky MJ. A formaldehyde-glutaraldehyde fixative of high osmolality for use in electron microscopy. J Cell Biol 1965;27:137A–138A. [Google Scholar]
- 59.Mathieu O, Claassen H, Weibel ER. Differential effect of glutaraldehyde and buffer osmolarity of cell dimensions: a study on lung tissue. J Ultrastruct Res 1978;63:20–34. [DOI] [PubMed] [Google Scholar]
- 60.Huang TH, Blume A, Das Gupta SK, Griffin RG. Nuclear magnetic resonance and calorimetric study of the structure, dynamics, and phase behavior of uranyl ion/dipalmitoylphosphatidylcholine complexes. Biophys J 1988;54:173–179. [DOI] [PMC free article] [PubMed] [Google Scholar]
- 61.Fehrenbach H, Richter J, Schnabel PA. Improved preservation of phospholipid-rich multilamellar bodies in conventionally embedded mammalian lung tissue–an electron spectroscopic study. J Microsc 1991;162:91–104. [DOI] [PubMed] [Google Scholar]
- 62.Ochs M, Fehrenbach H, Richter J. Electron spectroscopic imaging (ESI) and electron energy loss spectroscopy (EELS) of multilamellar bodies and multilamellar body-like structures in tannic acid-treated alveolar septal cells. J Histochem Cytochem 1994;42:805–809. [DOI] [PubMed] [Google Scholar]
- 63.Oldmixon EH, Suzuki S, Butler JP, Hoppin FG Jr. Perfusion dehydration fixes elastin and preserves lung air-space dimensions. J Appl Physiol 1985;58:105–113. [DOI] [PubMed] [Google Scholar]
- 64.Bachofen H, Ammann A, Wangensteen D, Weibel ER. Perfusion fixation of lungs for structure-function analysis: credits and limitations. J Appl Physiol Respirat Environ Exercise Physiol 1982;53:528–533. [DOI] [PubMed] [Google Scholar]
- 65.Gil J, Weibel ER. Extracellular lining of bronchioles after perfusion-fixation of rat lungs for electron microscopy. Anat Rec 1971;169:185–199. [DOI] [PubMed] [Google Scholar]
- 66.Gil J. Controlled and reproducible fixation of the lung for correlated studies. In: Gil J, editor. Models of lung disease: lung biology in health and disease. New York: Marcel Dekker; 1990. pp. 3–22.
- 67.Bachofen M, Weibel ER, Roos B. Postmortem fixation of human lungs for electron microscopy. Am Rev Respir Dis 1975;111:247–256. [DOI] [PubMed] [Google Scholar]
- 68.Albertine KH, Wiener-Kronish JP, Bastacky J, Staub NC. No evidence for mesothelial cell contact across the costal pleural space of sheep. J Appl Physiol 1991;70:123–134. [DOI] [PubMed] [Google Scholar]
- 69.Gosselink JV, Hayashi S, Chau E, Cooper J, Elliott WM, Hogg JC. Evaluation of small sample cDNA amplification for microdissected airway expression profiling in COPD. COPD 2007;4:91–105. [DOI] [PubMed] [Google Scholar]
- 70.Ding L, Quinlan KB, Elliott WM, Hamodat M, Pare PD, Hogg JC, Hayashi S. A lung tissue bank for gene expression studies in chronic obstructive pulmonary disease. COPD 2004;1:191–204. [DOI] [PubMed] [Google Scholar]
- 71.Woods JC, Choong CK, Yablonskiy DA, Bentley J, Wong J, Pierce JA, Cooper JD, Macklem PT, Conradi MS, Hogg JC. Hyperpolarized 3He diffusion MRI and histology in pulmonary emphysema. Magn Reson Med 2006;56:1293–1300. [DOI] [PMC free article] [PubMed] [Google Scholar]
- 72.Albertine KH, Schultz EL, Wiener-Kronish JP, Staub NC. Regional differences in pleural lymphatic albumin concentration in sheep. Am J Physiol 1987;252:H64–H70. [DOI] [PubMed] [Google Scholar]
- 73.Weibel ER, Limacher W, Bachofen H. Electron microscopy of rapidly frozen lungs: evaluation on the basis of standard criteria. J Appl Physiol Respirat Environ Exercise Physiol 1982;53:516–527. [DOI] [PubMed] [Google Scholar]
- 74.Untersee P, Gil J, Weibel ER. Visualization of extracellular lining layer of lung alveoli by freeze-etching. Respir Physiol 1971;13:171–185. [DOI] [PubMed] [Google Scholar]
- 75.Vock R, Weibel ER. Massive hemorrhage causes changes in morphometric parameters of lung capillaries and concentration of leukocytes in microvasculature. Exp Lung Res 1993;19:559–577. [DOI] [PubMed] [Google Scholar]
- 76.Gil J, Bachofen H, Gehr P, Weibel ER. Alveolar volume-surface area relation in air- and saline-filled lungs fixed by vascular perfusion. J Appl Physiol 1979;47:990–1010. [DOI] [PubMed] [Google Scholar]
- 77.West JB, Dollery CT, Naimark A. Distribution of blood flow in isolated lung; relation to vascular and alveolar pressures. J Appl Physiol 1964;19:713–724. [DOI] [PubMed] [Google Scholar]
- 78.Howell K, Preston RJ, McLoughlin P. Chronic hypoxia causes angiogenesis in addition to remodelling in the adult rat pulmonary circulation. J Physiol 2003;547:133–145. [DOI] [PMC free article] [PubMed] [Google Scholar]
- 79.Wangensteen D, Bachofen H, Weibel ER. Effects of glutaraldehyde or osmium tetroxide fixation on the osmotic properties of lung cells. J Microsc 1981;124:189–196. [DOI] [PubMed] [Google Scholar]
- 80.Fehrenbach H, Ochs M. 1998. Studying lung ultrastructure. In: Uhlig S, Taylor AE, editors. Methods in pulmonary research. Basel: Birkhäuser; 1998. pp. 429–454.
- 81.Muhlfeld C, Mayhew TM, Gehr P, Rothen-Rutishauser B. A novel quantitative method for analyzing the distributions of nanoparticles between different tissue and intracellular compartments. J Aerosol Med 2007;20:395–407. [DOI] [PubMed] [Google Scholar]
- 82.Runciman SI, Baudinette RV, Gannon BJ. Postnatal development of the lung parenchyma in a marsupial: the tammar wallaby. Anat Rec 1996;244:193–206. [DOI] [PubMed] [Google Scholar]
- 83.Burri PH. The postnatal growth of the rat lung: III. Morphology. Anat Rec 1974;180:77–98. [DOI] [PubMed] [Google Scholar]
- 84.Zeltner TB, Bertacchini M, Messerli A, Burri PH. Morphometric estimation of regional differences in the rat lung. Exp Lung Res 1990;16:145–158. [DOI] [PubMed] [Google Scholar]
- 85.Dorph-Petersen KA, Nyengaard JR, Gundersen HJ. Tissue shrinkage and unbiased stereological estimation of particle number and size. J Microsc 2001;204:232–246. [DOI] [PubMed] [Google Scholar]
- 86.Yan X, Polo Carbayo JJ, Weibel ER, Hsia CC. Variation of lung volume after fixation when measured by immersion or Cavalieri method. Am J Physiol Lung Cell Mol Physiol 2003;284:L242–L245. [DOI] [PubMed] [Google Scholar]
- 87.Weibel ER, Knight BW. A morphometric study on the thickness of the pulmonary air-blood barrier. J Cell Biol 1964;21:367–396. [DOI] [PMC free article] [PubMed] [Google Scholar]
- 88.Dobrin PB. Effect of histologic preparation on the cross-sectional area of arterial rings. J Surg Res 1996;61:413–415. [DOI] [PubMed] [Google Scholar]
- 89.Mayhew TM. Taking tissue samples from the placenta: an illustration of principles and strategies. Placenta 2008;29:1–14. [DOI] [PubMed] [Google Scholar]
- 90.Cruz-Orive LM, Weibel ER. Sampling designs for stereology. J Microsc 1981;122:235–257. [DOI] [PubMed] [Google Scholar]
- 91.Gundersen HJ, Jensen EB. The efficiency of systematic sampling in stereology and its prediction. J Microsc 1987;147:229–263. [DOI] [PubMed] [Google Scholar]
- 92.Ogbuihi S, Cruz-Orive LM. Estimating the total number of lymphatic valves in infant lungs with the fractionator. J Microsc 1990;158:19–30. [DOI] [PubMed] [Google Scholar]
- 93.Hsia CCW, Herazo LF, Fryder-Doffey F, Weibel ER. Compensatory lung growth occurs in adult dogs after right pneumonectomy. J Clin Invest 1994;94:405–412. [DOI] [PMC free article] [PubMed] [Google Scholar]
- 94.Mattfeldt T, Mall G, Gharehbaghi H, Moller P. Estimation of surface area and length with the orientator. J Microsc 1990;159:301–317. [DOI] [PubMed] [Google Scholar]
- 95.Nyengaard JR, Gundersen HJG. The isector: a simple and direct method for generating isotropic, uniform random sections from small specimens. J Microsc 1992;165:427–431. [Google Scholar]
- 96.Baddeley AJ, Gundersen HJ, Cruz-Orive LM. Estimation of surface area from vertical sections. J Microsc 1986;142:259–276. [DOI] [PubMed] [Google Scholar]
- 97.Gundersen HJ. Stereology of arbitrary particles. A review of unbiased number and size estimators and the presentation of some new ones, in memory of William R. Thompson. J Microsc 1986;143:3–45. [PubMed] [Google Scholar]
- 98.Gundersen HJ. The smooth fractionator. J Microsc 2002;207:191–210. [DOI] [PubMed] [Google Scholar]
- 99.Hyde DM, Blozis SA, Avdalovic MV, Putney LF, Dettorre R, Quesenberry NJ, Singh P, Tyler NK. Alveoli increase in number but not size from birth to adulthood in rhesus monkeys. Am J Physiol Lung Cell Mol Physiol 2007;293:L570–L579. [DOI] [PubMed] [Google Scholar]
- 100.Muller AE, Cruz-Orive LM, Gehr P, Weibel ER. Comparison of two subsampling methods for electron microscopic morphometry. J Microsc 1981;123:35–49. [DOI] [PubMed] [Google Scholar]
- 101.Hyde DM, Henderson TS, Giri SN, Tyler NK, Stovall MY. Effect of murine gamma interferon on the cellular responses to bleomycin in mice. Exp Lung Res 1988;14:687–704. [DOI] [PubMed] [Google Scholar]
- 102.Cruz-Orive LM. Precision of Cavalieri sections and slices with local errors. J Microsc 1999;193:182–198. [DOI] [PubMed] [Google Scholar]
- 103.Cruz-Orive LM. Best linear unbiased estimators for stereology. Biometrics 1980;36:595–605. [Google Scholar]
- 104.Gundersen HJ, Jensen EB, Kieu K, Nielsen J. The efficiency of systematic sampling in stereology–reconsidered. J Microsc 1999;193:199–211. [DOI] [PubMed] [Google Scholar]
- 105.Weibel ER, Kistler GS, Scherle WF. Practical stereological methods for morphometric cytology. J Cell Biol 1966;30:23–38. [DOI] [PMC free article] [PubMed] [Google Scholar]
- 106.Coxson HO, Mayo JR, Behzad H, Moore BJ, Verburgt LM, Staples CA, Pare PD, Hogg JC. Measurement of lung expansion with computed tomography and comparison with quantitative histology. J Appl Physiol 1995;79:1525–1530. [DOI] [PubMed] [Google Scholar]
- 107.Coxson HO, Rogers RM, Whittall KP, D'yachkova Y, Pare PD, Sciurba FC, Hogg JC. A quantification of the lung surface area in emphysema using computed tomography. Am J Respir Crit Care Med 1999;159:851–856. [DOI] [PubMed] [Google Scholar]
- 108.Ravikumar P, Yilmaz C, Dane DM, Johnson RL Jr, Estrera AS, Hsia CC. Regional lung growth following pneumonectomy assessed by computed tomography. J Appl Physiol 2004;97:1567–1574. [DOI] [PubMed] [Google Scholar]
- 109.Pache JC, Roberts N, Vock P, Zimmermann A, Cruz-Orive LM. Vertical LM sectioning and parallel CT scanning designs for stereology: application to human lung. J Microsc 1993;170:9–24. [DOI] [PubMed] [Google Scholar]
- 110.Michel RP, Cruz-Orive LM. Application of the Cavalieri principle and vertical sections method to lung: estimation of volume and pleural surface area. J Microsc 1988;150:117–136. [DOI] [PubMed] [Google Scholar]
- 111.Scherle WF. A simple method of volumetry of organs in quantitative stereology. Mikroskopie 1970;26:57–60. [PubMed] [Google Scholar]
- 112.Hyde DM, Tyler NK, Putney LF, Singh P, Gundersen HJ. Total number and mean size of alveoli in mammalian lung estimated using fractionator sampling and unbiased estimates of the Euler characteristic of alveolar openings. Anat Rec 2004;277A:216–226. [DOI] [PubMed] [Google Scholar]
- 113.Ochs M, Nyengaard JR, Jung A, Knudsen L, Voigt M, Wahlers T, Richter J, Gundersen HJ. The number of alveoli in the human lung. Am J Respir Crit Care Med 2004;169:120–124. [DOI] [PubMed] [Google Scholar]
- 114.Chalkley HW, Cornfield J, Park H. A method for estimating volume-surface ratios. Science 1949;110:295–297. [DOI] [PubMed] [Google Scholar]
- 115.Campbell H, Tomkeieff SI. Calculation of the internal surface of a lung. Nature 1952;170:116–117. [PubMed] [Google Scholar]
- 116.Thurlbeck WM. Internal surface area and other measurements in emphysema. Thorax 1967;22:483–496. [DOI] [PMC free article] [PubMed] [Google Scholar]
- 117.Thurlbeck WM. The internal surface area of nonemphysematous lungs. Am Rev Respir Dis 1967;95:765–773. [DOI] [PubMed] [Google Scholar]
- 118.Knudsen L, Weibel ER, Gundersen HJG, Weinstein FV, Ochs M. Assessment of airspace size characteristics by intercept (chord) measurement: an accurate and efficient stereological approach. J Appl Physiol 2010;108:412–421. [DOI] [PubMed] [Google Scholar]
- 119.Tanoli TS, Woods JC, Conradi MS, Bae KT, Gierada DS, Hogg JC, Cooper JD, Yablonskiy DA. In vivo lung morphometry with hyperpolarized 3He diffusion MRI in canines with induced emphysema: disease progression and comparison with computed tomography. J Appl Physiol 2007;102:477–484. [DOI] [PMC free article] [PubMed] [Google Scholar]
- 120.Yablonskiy DA, Sukstanskii AL, Leawoods JC, Gierada DS, Bretthorst GL, Lefrak SS, Cooper JD, Conradi MS. Quantitative in vivo assessment of lung microstructure at the alveolar level with hyperpolarized 3He diffusion MRI. Proc Natl Acad Sci USA 2002;99:3111–3116. [DOI] [PMC free article] [PubMed] [Google Scholar]
- 121.Weibel ER. Morphometric estimation of pulmonary diffusion capacity: I. Model and method. Respir Physiol 1970;11:54–75. [DOI] [PubMed] [Google Scholar]
- 122.Gundersen HJ, Jensen TB, Osterby R. Distribution of membrane thickness determined by lineal analysis. J Microsc 1978;113:27–43. [DOI] [PubMed] [Google Scholar]
- 123.Jensen EB, Gundersen HJ, Osterby R. Determination of membrane thickness distribution from orthogonal intercepts. J Microsc 1979;115:19–33. [DOI] [PubMed] [Google Scholar]
- 124.Roughton FJ, Forster RE. Relative importance of diffusion and chemical reaction rates in determining rate of exchange of gases in the human lung, with special reference to true diffusing capacity of pulmonary membrane and volume of blood in the lung capillaries. J Appl Physiol 1957;11:290–302. [DOI] [PubMed] [Google Scholar]
- 125.Weibel ER, Federspiel WJ, Fryder-Doffey F, Hsia CCW, Künig M, Stalder-Navarro V, Vock R. Morphometric model for pulmonary diffusing capacity: I. Membrane diffusing capacity. Respir Physiol 1993;93:125–149. [DOI] [PubMed] [Google Scholar]
- 126.Sapoval B, Filoche M, Weibel ER. Smaller is better–but not too small: a physical scale for the design of the mammalian pulmonary acinus. Proc Natl Acad Sci USA 2002;99:10411–10416. [DOI] [PMC free article] [PubMed] [Google Scholar]
- 127.Weibel ER, Sapoval B, Filoche M. Design of peripheral airways for efficient gas exchange. Respir Physiol Neurobiol 2005;148:3–21. [DOI] [PubMed] [Google Scholar]
- 128.Takeda SI, Ramanathan M, Estrera AS, Hsia CC. Postpneumonectomy alveolar growth does not normalize hemodynamic and mechanical function. J Appl Physiol 1999;87:491–497. [DOI] [PubMed] [Google Scholar]
- 129.Petersen MS, Petersen CC, Agger R, Hokland M, Gundersen HJ. A simple method for unbiased quantitation of adoptively transferred cells in solid tissues. J Immunol Methods 2006;309:173–181. [DOI] [PubMed] [Google Scholar]
- 130.Hyde DM, Miller LA, McDonald RJ, Stovall MY, Wong V, Pinkerton KE, Wegner CD, Rothlein R, Plopper CG. Neutrophils enhance clearance of necrotic epithelial cells in ozone- induced lung injury in rhesus monkeys. Am J Physiol 1999;277:L1190–L1198. [DOI] [PubMed] [Google Scholar]
- 131.Ochs M, Knudsen L, Allen L, Stumbaugh A, Levitt S, Nyengaard JR, Hawgood S. GM-CSF mediates alveolar epithelial type II cell changes, but not emphysema-like pathology, in SP-D-deficient mice. Am J Physiol Lung Cell Mol Physiol 2004;287:L1333–L1341. [DOI] [PubMed] [Google Scholar]
- 132.Jung A, Allen L, Nyengaard JR, Gundersen HJ, Richter J, Hawgood S, Ochs M. Design-based stereological analysis of the lung parenchymal architecture and alveolar type II cells in surfactant protein A and D double deficient mice. Anat Rec A Discov Mol Cell Evol Biol 2005;286:885–890. [DOI] [PubMed] [Google Scholar]
- 133.Geiser M, Cruz-Orive LM, Im Hof V, Gehr P. Assessment of particle retention and clearance in the intrapulmonary conducting airways of hamster lungs with the fractionator. J Microsc 1990;160:75–88. [DOI] [PubMed] [Google Scholar]
- 134.Lucocq J. Quantitation of gold labelling and antigens in immunolabelled ultrathin sections. J Anat 1994;184:1–13. [PMC free article] [PubMed] [Google Scholar]
- 135.Mayhew TM. Quantitative immunoelectron microscopy: alternative ways of assessing subcellular patterns of gold labeling. Methods Mol Biol 2007;369:309–329. [DOI] [PubMed] [Google Scholar]
- 136.Mayhew TM, Lucocq JM, Griffiths G. Relative labelling index: a novel stereological approach to test for non-random immunogold labelling of organelles and membranes on transmission electron microscopy thin sections. J Microsc 2002;205:153–164. [DOI] [PubMed] [Google Scholar]
- 137.Ochs M, Johnen G, Muller KM, Wahlers T, Hawgood S, Richter J, Brasch F. Intracellular and intraalveolar localization of surfactant protein A (SP-A) in the parenchymal region of the human lung. Am J Respir Cell Mol Biol 2002;26:91–98. [DOI] [PubMed] [Google Scholar]
- 138.Fehrenbach H, Tews S, Fehrenbach A, Ochs M, Wittwer T, Wahlers T, Richter J. Improved lung preservation relates to an increase in tubular myelin-associated surfactant protein A. Respir Res 2005;6:1–12. [DOI] [PMC free article] [PubMed] [Google Scholar]
- 139.Schmiedl A, Ochs M, Muhlfeld C, Johnen G, Brasch F. Distribution of surfactant proteins in type II pneumocytes of newborn, 14-day old, and adult rats: an immunoelectron microscopic and stereological study. Histochem Cell Biol 2005;124:465–476. [DOI] [PubMed] [Google Scholar]
- 140.Mayhew T, Griffiths G, Habermann A, Lucocq J, Emre N, Webster P. A simpler way of comparing the labelling densities of cellular compartments illustrated using data from VPARP and LAMP-1 immunogold labelling experiments. Histochem Cell Biol 2003;119:333–341. [DOI] [PubMed] [Google Scholar]
- 141.Mayhew TM, Griffiths G, Lucocq JM. Applications of an efficient method for comparing immunogold labelling patterns in the same sets of compartments in different groups of cells. Histochem Cell Biol 2004;122:171–177. [DOI] [PubMed] [Google Scholar]
- 142.Mayhew TM, Lucocq JM. Quantifying immunogold labelling patterns of cellular compartments when they comprise mixtures of membranes (surface-occupying) and organelles (volume-occupying). Histochem Cell Biol 2008;129:367–378. [DOI] [PubMed] [Google Scholar]
- 143.Muhlfeld C, Rothen-Rutishauser B, Vanhecke D, Blank F, Gehr P, Ochs M. Visualization and quantitative analysis of nanoparticles in the respiratory tract by transmission electron microscopy. Part Fibre Toxicol 2007;4:11. [DOI] [PMC free article] [PubMed] [Google Scholar]
- 144.Raabe OG, Yeh HC, Schum GM, Phalen RF. Tracheobronchial geometry: human, dog, rat, hamster. LF-53 Category UC-48. Albuquerque, New Mexico: Inhalation Toxicology Research Institute; 1976.
- 145.Weibel ER. Fractal geometry: a design principle for living organisms. Am J Physiol Lung Cell Mol Physiol 1991;5:L361–L369. [DOI] [PubMed] [Google Scholar]
- 146.Horsfield K. Pulmonary airways and blood vessels considered as confluent trees. In: Crystal RG, West JB, Weibel ER, Barnes PJ, editors. The lung: scientific foundations, 2nd ed. Philadelphia: Lippencott-Raven Publishers; 1997. pp. 1073–1079.
- 147.Hislop A, Reid L. Intra-pulmonary arterial development during fetal life-branching pattern and structure. J Anat 1972;113:35–48. [PMC free article] [PubMed] [Google Scholar]
- 148.Huang W, Yen RT, McLaurine M, Bledsoe G. Morphometry of the human pulmonary vasculature. J Appl Physiol 1996;81:2123–2133. [DOI] [PubMed] [Google Scholar]
- 149.Horsfield K, Relea FG, Cumming G. Diameter, length and branching ratios in the bronchial tree. Respir Physiol 1976;26:351–356. [DOI] [PubMed] [Google Scholar]
- 150.Horsfield K, Dart G, Olson DE, Filley GF, Cumming G. Models of the human bronchial tree. J Appl Physiol 1971;31:207–217. [DOI] [PubMed] [Google Scholar]
- 151.Phalen RF, Oldham MJ. Tracheobronchial airway structure as revealed by casting techniques. Am Rev Respir Dis 1983;128:S1–S4. [DOI] [PubMed] [Google Scholar]
- 152.Rodriguez M, Bur S, Favre A, Weibel ER. Pulmonary acinus: geometry and morphometry of the peripheral airway system in rat and rabbit. Am J Anat 1987;180:143–155. [DOI] [PubMed] [Google Scholar]
- 153.Haefeli-Bleuer B, Weibel ER. Morphometry of the human pulmonary acinus. Anat Rec 1988;220:401–414. [DOI] [PubMed] [Google Scholar]
- 154.Phalen RF, Oldham MJ, Beaucage CB, Crocker TT, Mortensen JD. Postnatal enlargement of human tracheobronchial airways and implications for particle deposition. Anat Rec 1985;212:368–380. [DOI] [PubMed] [Google Scholar]
- 155.Maletti GM, Wulfsohn D. Evaluation of variance models for fractionator sampling of trees. J Microsc 2006;222:228–241. [DOI] [PubMed] [Google Scholar]
- 156.Sauret V, Halson PM, Brown IW, Fleming JS, Bailey AG. Study of the three-dimensional geometry of the central conducting airways in man using computed tomographic (CT) images. J Anat 2002;200:123–134. [DOI] [PMC free article] [PubMed] [Google Scholar]
- 157.Tawhai MH, Hunter P, Tschirren J, Reinhardt J, McLennan G, Hoffman EA. CT-based geometry analysis and finite element models of the human and ovine bronchial tree. J Appl Physiol 2004;97:2310–2321. [DOI] [PubMed] [Google Scholar]
- 158.Brillet PY, Fetita CI, Beigelman-Aubry C, Saragaglia A, Perchet D, Preteux F, Grenier PA. Quantification of bronchial dimensions at MDCT using dedicated software. Eur Radiol 2007;17:1483–1489. [DOI] [PubMed] [Google Scholar]
- 159.Plopper CG, Heidsiek JG, Weir AJ, George JA, Hyde DM. Tracheobronchial epithelium in the adult rhesus monkey: a quantitative histochemical and ultrastructural study. Am J Anat 1989;184:31–40. [DOI] [PubMed] [Google Scholar]
- 160.Mercer RR, Crapo JD. Three-dimensional reconstruction of the rat acinus. J Appl Physiol 1987;63:785–794. [DOI] [PubMed] [Google Scholar]
- 161.Singhal S, Henderson R, Horsfield K, Harding K, Cumming G. Morphometry of the human pulmonary arterial tree. Circ Res 1973;33:190–197. [DOI] [PubMed] [Google Scholar]
- 162.Horsfield K, Gordon WI. Morphometry of pulmonary veins in man. Lung 1981;159:211–218. [DOI] [PubMed] [Google Scholar]
- 163.Dawson CA, Krenz GS, Karau KL, Haworth ST, Hanger CC, Linehan JH. Structure-function relationships in the pulmonary arterial tree. J Appl Physiol 1999;86:569–583. [DOI] [PubMed] [Google Scholar]
- 164.Jiang ZL, Kassab GS, Fung YC. Diameter-defined Strahler system and connectivity matrix of the pulmonary arterial tree. J Appl Physiol 1994;76:882–892. [DOI] [PubMed] [Google Scholar]
- 165.Burrowes KS, Hunter PJ, Tawhai MH. Anatomically based finite element models of the human pulmonary arterial and venous trees including supernumerary vessels. J Appl Physiol 2005;99:731–738. [DOI] [PubMed] [Google Scholar]
- 166.Davies P, Reid L. Hypoxic remodeling of the rat pulmonary arterial microcirculation assessed by microdissection. J Appl Physiol 1991;71:1886–1891. [DOI] [PubMed] [Google Scholar]
- 167.Jeffery P, Holgate S, Wenzel S. Methods for the assessment of endobronchial biopsies in clinical research: application to studies of pathogenesis and the effects of treatment. Am J Respir Crit Care Med 2003;168:S1–S17. [DOI] [PubMed] [Google Scholar]
- 168.Kadokura M, Colby TV, Myers JL, Allen MS, Deschamps C, Trastek VF, Pairolero PC. Pathologic comparison of video-assisted thoracic surgical lung biopsy with traditional open lung biopsy. J Thorac Cardiovasc Surg 1995;109:494–498. [DOI] [PubMed] [Google Scholar]
- 169.Regamey N, Ochs M, Hilliard TN, Muhlfeld C, Cornish N, Fleming L, Saglani S, Alton EW, Bush A, Jeffery PK, et al. Increased airway smooth muscle mass in children with asthma, cystic fibrosis, and non-cystic fibrosis bronchiectasis. Am J Respir Crit Care Med 2008;177:837–843. [DOI] [PubMed] [Google Scholar]
- 170.Woodruff PG, Dolganov GM, Ferrando RE, Donnelly S, Hays SR, Solberg OD, Carter R, Wong HH, Cadbury PS, Fahy JV. Hyperplasia of smooth muscle in mild to moderate asthma without changes in cell size or gene expression. Am J Respir Crit Care Med 2004;169:1001–1006. [DOI] [PubMed] [Google Scholar]
- 171.Ordonez CL, Khashayar R, Wong HH, Ferrando R, Wu R, Hyde DM, Hotchkiss JA, Zhang Y, Novikov A, Dolganov G, et al. Mild and moderate asthma is associated with airway goblet cell hyperplasia and abnormalities in mucin gene expression. Am J Respir Crit Care Med 2001;163:517–523. [DOI] [PubMed] [Google Scholar]
- 172.Ferrando RE, Nyengaard JR, Hays SR, Fahy JV, Woodruff PG. Applying stereology to measure thickness of the basement membrane zone in bronchial biopsy specimens. J Allergy Clin Immunol 2003;112:1243–1245. [DOI] [PubMed] [Google Scholar]
- 173.Langston C, Patterson K, Dishop MK, Askin F, Baker P, Chou P, Cool C, Coventry S, Cutz E, Davis M, et al. A protocol for the handling of tissue obtained by operative lung biopsy: recommendations of the chILD pathology co-operative group. Pediatr Dev Pathol 2006;9:173–180. [DOI] [PubMed] [Google Scholar]
- 174.Churg A. An inflation procedure for open lung biopsies. Am J Surg Pathol 1983;7:69–71. [DOI] [PubMed] [Google Scholar]
- 175.Hoffman EA, Olsen LE. 1998. Characteristics of respiratory system complexity captured via X-ray computed tomography: image acquisition, display, and analysis. In: Hlastalla M, Robertson T, editors. Complexities of structure and function of the lung. New York: Marcel Dekker, Inc.; 1998. pp. 325–378.
- 176.Hoffman EA, Sinak LJ, Robb RA, Ritman EL. Noninvasive quantitative imaging of shape and volume of lungs. J Appl Physiol 1983;54:1414–1421. [DOI] [PubMed] [Google Scholar]
- 177.Hoffman EA. Effect of body orientation on regional lung expansion: a computed tomographic approach. J Appl Physiol 1985;59:468–480. [DOI] [PubMed] [Google Scholar]
- 178.Won C, Chon D, Tajik J, Tran BQ, Robinswood GB, Beck KC, Hoffman EA. CT-based assessment of regional pulmonary microvascular blood flow parameters. J Appl Physiol 2003;94:2483–2493. [DOI] [PubMed] [Google Scholar]
- 179.Madani A, Zanen J, de Maertelaer V, Gevenois PA. Pulmonary emphysema: objective quantification at multi-detector row CT–comparison with macroscopic and microscopic morphometry. Radiology 2006;238:1036–1043. [DOI] [PubMed] [Google Scholar]
- 180.de Jong PA, Nakano Y, Lequin MH, Merkus PJ, Tiddens HA, Hogg JC, Coxson HO. Estimation of lung growth using computed tomography. Eur Respir J 2003;22:235–238. [DOI] [PubMed] [Google Scholar]
- 181.Takeda S, Wu EY, Epstein RH, Estrera AS, Hsia CC. In vivo assessment of changes in air and tissue volumes after pneumonectomy. J Appl Physiol 1997;82:1340–1348. [DOI] [PubMed] [Google Scholar]
- 182.Ravikumar P, Yilmaz C, Dane DM, Johnson RL Jr, Estrera AS, Hsia CC. Developmental signals do not further accentuate nonuniform postpneumonectomy compensatory lung growth. J Appl Physiol 2007;102:1170–1177. [DOI] [PubMed] [Google Scholar]
- 183.Coxson HO, Hogg JC, Mayo JR, Behzad H, Whittall KP, Schwartz DA, Hartley PG, Galvin JR, Wilson JS, Hunninghake GW. Quantification of idiopathic pulmonary fibrosis using computed tomography and histology. Am J Respir Crit Care Med 1997;155:1649–1656. [DOI] [PubMed] [Google Scholar]
- 184.Wandtke JC, Hyde RW, Fahey PJ, Utell MJ, Plewes DB, Goske MJ, Fischer HW. Measurement of lung gas volume and regional density by computed tomography in dogs. Invest Radiol 1986;21:108–117. [DOI] [PubMed] [Google Scholar]
- 185.Uppaluri R, Hoffman EA, Sonka M, Hartley PG, Hunninghake GW, McLennan G. Computer recognition of regional lung disease patterns. Am J Respir Crit Care Med 1999;160:648–654. [DOI] [PubMed] [Google Scholar]
- 186.Xu Y, Sonka M, McLennan G, Guo J, Hoffman EA. MDCT-based 3-D texture classification of emphysema and early smoking related lung pathologies. IEEE Trans Med Imaging 2006;25:464–475. [DOI] [PubMed] [Google Scholar]
- 187.Roberts N, Puddephat MJ, McNulty V. The benefit of stereology for quantitative radiology. Br J Radiol 2000;73:679–697. [DOI] [PubMed] [Google Scholar]
- 188.Hu S, Hoffman EA, Reinhardt JM. Automatic lung segmentation for accurate quantitation of volumetric X-ray CT images. IEEE Trans Med Imaging 2001;20:490–498. [DOI] [PubMed] [Google Scholar]
- 189.Tschirren J, Hoffman EA, McLennan G, Sonka M. Intrathoracic airway trees: segmentation and airway morphology analysis from low-dose CT scans. IEEE Trans Med Imaging 2005;24:1529–1539. [DOI] [PMC free article] [PubMed] [Google Scholar]
- 190.Ukil S, Reinhardt JM. Anatomy-guided lung lobar surface detection in X-ray CT images. IEEE Trans Med Imaging 2009;28:202–214. [DOI] [PMC free article] [PubMed] [Google Scholar]
- 191.Palagyi K, Tschirren J, Sonka M. Quantitative analysis of intrathoracic airway trees: methods and validation. Inf Process Med Imaging 2003;18:222–233. [DOI] [PubMed] [Google Scholar]
- 192.Tschirren J, McLennan G, Palagyi K, Hoffman EA, Sonka M. Matching and anatomical labeling of human airway tree. IEEE Trans Med Imaging 2005;24:1540–1547. [DOI] [PMC free article] [PubMed] [Google Scholar]
- 193.Saba OI, Hoffman EA, Reinhardt JM. Maximizing quantitative accuracy of lung airway lumen and wall measures obtained from X-ray CT imaging. J Appl Physiol 2003;95:1063–1075. [DOI] [PubMed] [Google Scholar]
- 194.Namati E, Chon D, Thiesse J, Hoffman EA, de Ryk J, Ross A, McLennan G. In vivo micro-CT lung imaging via a computer-controlled intermittent iso-pressure breath hold (IIBH) technique. Phys Med Biol 2006;51:6061–6075. [DOI] [PubMed] [Google Scholar]
- 195.Cavanaugh D, Travis EL, Price RE, Gladish G, White RA, Wang M, Cody DD. Quantification of bleomycin-induced murine lung damage in vivo with micro-computed tomography. Acad Radiol 2006;13:1505–1512. [DOI] [PubMed] [Google Scholar]
- 196.Litzlbauer HD, Neuhaeuser C, Moell A, Greschus S, Breithecker A, Franke FE, Kummer W, Rau WS. Three-dimensional imaging and morphometric analysis of alveolar tissue from microfocal X-ray-computed tomography. Am J Physiol Lung Cell Mol Physiol 2006;291:L535–L545. [DOI] [PubMed] [Google Scholar]
- 197.Saam B, Yablonskiy DA, Gierada DS, Conradi MS. Rapid imaging of hyperpolarized gas using EPI. Magn Reson Med 1999;42:507–514. [DOI] [PubMed] [Google Scholar]
- 198.Chen XJ, Hedlund LW, Moller HE, Chawla MS, Maronot RR, Johnson GA. Detection of emphysema in rat lungs by using magnetic resonance measurements of 3He diffusion. Proc Natl Acad Sci USA 2000;97:11478–11481. [DOI] [PMC free article] [PubMed] [Google Scholar]
- 199.Leawoods JC, Yablonskiy DA, Saam B, Gierada DS, Conrad MS. Hyperpolarized 3He gas production and MR imaging of the lung. Concepts Magn Reson 2001;13:277–293. [Google Scholar]
- 200.Saam BT, Yablonskiy DA, Kodibagkar VD, Leawoods JC, Gierada DS, Cooper JD, Lefrak SS, Conradi MS. MR imaging of diffusion of (3)He gas in healthy and diseased lungs. Magn Reson Med 2000;44:174–179. [DOI] [PubMed] [Google Scholar]
- 201.Peces-Barba G, Ruiz-Cabello J, Cremillieux Y, Rodriguez I, Dupuich D, Callot V, Ortega M, Rubio Arbo ML, Cortijo M, Gonzalez-Mangado N. Helium-3 MRI diffusion coefficient: correlation to morphometry in a model of mild emphysema. Eur Respir J 2003;22:14–19. [DOI] [PubMed] [Google Scholar]
- 202.Emami K, Cadman RV, Woodburn JM, Fischer MC, Kadlecek SJ, Zhu J, Pickup S, Guyer RA, Law M, Vahdat V, et al. Early changes of lung function and structure in an elastase model of emphysema–a hyperpolarized 3He MRI study. J Appl Physiol 2008;104:773–786. [DOI] [PubMed] [Google Scholar]
- 203.Sukstanskii AL, Yablonskiy DA. In vivo lung morphometry with hyperpolarized 3He diffusion MRI: theoretical background. J Magn Reson 2008;190:200–210. [DOI] [PMC free article] [PubMed] [Google Scholar]
- 204.Harris RS, Schuster DP. Visualizing lung function with positron emission tomography. J Appl Physiol 2007;102:448–458. [DOI] [PubMed] [Google Scholar]
- 205.Velazquez M, Weibel ER, Kuhn C III, Schuster DP. PET evaluation of pulmonary vascular permeability: a structure-function correlation. J Appl Physiol 1991;70:2206–2216. [DOI] [PubMed] [Google Scholar]
- 206.Petersson J, Sanchez-Crespo A, Larsson SA, Mure M. Physiological imaging of the lung: single-photon-emission computed tomography (SPECT). J Appl Physiol 2007;102:468–476. [DOI] [PubMed] [Google Scholar]
- 207.Hsia CC, Fryder-Doffey F, Stalder-Navarro V, Johnson RLJ, Reynolds RC, Weibel ER. Structural changes underlying compensatory increase of diffusing capacity after left pneumonectomy in adult dogs. J Clin Invest 1993;92:758–764. [(Published erratum appears in J Clin Invest 1994;93:913.] [DOI] [PMC free article] [PubMed] [Google Scholar]
- 208.Hyde DM, Tyler NK, Plopper CG. Morphometry of the respiratory tract: avoiding the sampling, size, orientation, and reference traps. Toxicol Pathol 2007;35:41–48. [DOI] [PubMed] [Google Scholar]