

Abstract
Mitochondria accumulate within nerve terminals and support synaptic function, most notably through ATP production. They can also sequester Ca2+ during nerve stimulation, but it is unknown whether this limits presynaptic Ca2+ levels at physiological nerve firing rates. Similarly, it is unclear whether mitochondrial Ca2+ sequestration differs between functionally different nerve terminals. We addressed these questions using a combination of synthetic and genetically encoded Ca2+ indicators to examine cytosolic and mitochondrial Ca2+ levels in presynaptic terminals of tonic (MN13-Ib) and phasic (MNSNb/d-Is) motor neurons in Drosophila, which, as we determined, fire during fictive locomotion at ∼42 Hz and ∼8 Hz, respectively. Mitochondrial Ca2+ sequestration starts in both terminals at ∼250 nm, exhibits a similar Ca2+-uptake affinity (∼410 nm), and does not require Ca2+ release from the endoplasmic reticulum. Nonetheless, mitochondrial Ca2+ uptake in type Is terminals is more responsive to low-frequency nerve stimulation and this is due to higher cytosolic Ca2+ levels. Since type Ib terminals have a higher mitochondrial density than Is terminals, it seemed possible that greater mitochondrial Ca2+ sequestration may be responsible for the lower cytosolic Ca2+ levels in Ib terminals. However, genetic and pharmacological manipulations of mitochondrial Ca2+ uptake did not significantly alter nerve-stimulated elevations in cytosolic Ca2+ levels in either terminal type within physiologically relevant rates of stimulation. Our findings indicate that presynaptic mitochondria have a similar affinity for Ca2+ in functionally different nerve terminals, but do not limit cytosolic Ca2+ levels within the range of motor neuron firing rates in situ.
Introduction
Presynaptic mitochondria may support synaptic function by producing ATP, sequestering Ca2+, releasing Ca2+, and generating reactive oxygen species (ROS). Mitochondrial Ca2+ sequestration in response to depolarization-induced increases in cytosolic Ca2+ levels has been well documented in various systems (Kann and Kovacs, 2007). However, it remains largely unknown whether mitochondrial Ca2+ sequestration constitutes an effective and possibly universal mechanism for buffering presynaptic cytosolic Ca2+.
Mitochondria sequester cytosolic Ca2+ via a Ca2+/H+ antiporter (Sparagna et al., 1995; Jiang et al., 2009) and a Ca2+ uniporter (Gunter et al., 2004; Kirichok et al., 2004) using the chemiosmotic gradient generated across the inner mitochondrial membrane by the respiratory chain. Mitochondria near the Ca2+ channels of the plasma membrane or endoplasmic reticulum (ER) can sequester Ca2+ during fast Ca2+ transients when Ca2+ reaches micromolar concentrations (Alonso et al., 2006; Rizzuto et al., 2009); and even when they are not close to these channels, they can sequester Ca2+ at ambient levels as low as 200 nm (Gunter and Sheu, 2009).
A major problem in determining the role of mitochondrial Ca2+ sequestration in Ca2+ regulation arises from the fact that mitochondrial ATP production is coupled to Ca2+ signaling (McCormack et al., 1990). Cytosolic Ca2+ spikes can activate at least four Ca2+-sensitive mitochondrial dehydrogenases and the F1F0-ATPase, increasing ATP production through oxidative phosphorylation (Balaban, 2009; Denton, 2009). Accordingly, mitochondrial Ca2+ sequestration in nerve terminals may constitute an effective cytosolic Ca2+ buffer, but it also may serve to integrate ATP supply with the demands of synaptic activity.
At nerve terminals, pharmacological inhibition of mitochondrial Ca2+ sequestration results in higher presynaptic Ca2+ levels than those seen in the presence of functional mitochondria during prolonged and/or high-frequency nerve stimulation (Tang and Zucker, 1997; David et al., 1998; Narita et al., 1998; David and Barrett, 2000; Billups and Forsythe, 2002; Suzuki et al., 2002; Bennett et al., 2007), suggesting that mitochondrial Ca2+ sequestration may limit presynaptic Ca2+ levels at least during excessive stimulation. However, data from such experimental protocols can be difficult to interpret since ATP deficiencies may occur in the absence of Ca2+-stimulated mitochondrial ATP production. ATP deficiencies will in turn compromise ATP-driven Ca2+ pumps (Blaustein et al., 2002; Guerini et al., 2005) and ATP-driven pumps that maintain Na+ and K+ gradients, which provide the driving force for Ca2+ removal by Na+- and Na+/K+-Ca2+ exchangers (Lytton, 2007). Accordingly, the tightly interrelated nature of mitochondrial Ca2+ sequestration, ATP production and nonmitochondrial Ca2+ clearance mechanisms makes it difficult to discern the physiological role of mitochondrial Ca2+ sequestration in nerve terminals, especially when stimulation protocols do not reflect physiological ranges of nerve activity.
In this study, we examined whether the sensitivity of mitochondrial Ca2+ sequestration differed between synaptic terminals of two functionally different motor neurons (MNs) in Drosophila larvae, and whether mitochondrial Ca2+ sequestration limits presynaptic Ca2+ levels within physiological rates of MN activity. Despite the very different activity levels of tonic and phasic MNs, mitochondria in the two terminal types showed the same affinity for taking up Ca2+, and were similarly ineffective in limiting cytosolic Ca2+ levels within physiologically relevant ranges of neuronal activity.
Materials and Methods
Fly stocks.
Flies were raised on standard medium with dry yeast at 25°C. The w1118 strain was used as a wild-type control for all experiments. We used the enhancer-trap strain w1118; P[w+, OK6::Gal4] to drive expression of each reporter transgene in MNs of third instar larvae (Aberle et al., 2002). Flies containing the drp12 mutant allele of the dynamin related protein-1 gene (Verstreken et al., 2005) were obtained from H. Bellen (Baylor College of Medicine, Houston, TX). drp12 was kept balanced over CyO, P{ActGFP}JMR1 allowing selection of drp12 homozygous mutant larvae. Flies containing the dmiroB682 mutant allele of the dmiro gene were kept balanced over TM6, Tb, Sb allowing selection of non-tubby dmiroB682 homozygous larvae (Guo et al., 2005). Flies containing a double insertion of the GCaMP1.3 transgene on the X-chromosome (Wang et al., 2003) were obtained from R. Axel (Columbia University, New York, NY). Flies carrying a UAS-DsRed transgene were obtained from the Bloomington Stock Center (Bloomington, IN). Transgenic UAS-Lyso-GFP-KDEL flies were a gift from M. Lilly (National Institutes of Health, Bethesda, MD). UAS-mito-GFP transgenic flies were a gift from W. Saxton (Indiana University, Bloomington, IN).
Solutions and chemicals.
Unless indicated otherwise, chemicals were purchased from Sigma-Aldrich. Carbonyl cyanide 3-chlorophenylhydrazone (CCCP; Cat. No. 0452) was from Tocris Bioscience. Thapsigargin (Cat. No. 586005) and Ryanodine (Cat. No. 559276) were from Calbiochem (EMD Biosciences). Stock solutions were made in Pluronic F-127 (20% Pluronic in DMSO; Cat. No. P3000MP; Invitrogen). Hemolymph-like solution No. 6 (HL6) containing 15 mm Mg2+, pH 7.3, was used in all experiments (Macleod et al., 2002). Synthetic Ca2+-indicators (rhod-2, rhod-FF, rhod-5N, fura-dextran and rhod-dextran) were obtained from Invitrogen (Cat. Nos. R1245MP, R23983, R14208, F3029, and R34677, respectively), as were AF647-dextran, Texas Red dextran and BAPTA-AM (Cat. Nos. D22914, D1828, and B6769, respectively).
Immunohistochemistry.
Third instar Drosophila larvae were fillet-dissected in HL6 containing no Ca2, rinsed in HL6, and fixed with 4% paraformaldehyde for 60 min at room temperature. Fixed preparations were washed 3 times in PBS, pH 7.4, containing 0.1% Triton X-100 (PBST) before blocking for 1 h with 2% bovine serum albumin dissolved in PBST. Preparations were incubated overnight at 4°C in PBST containing rabbit anti-GFP (green fluorescent protein) Alexa Fluor 488-conjugated antibodies (1:500; Invitrogen, Cat. No. A21311), along with either mouse anti-CSP (cysteine-string protein) (1:100, ab49, Zinsmaier et al., 1990) or mouse anti-Brp (Bruchpilot) antibodies (1:100, nc82; obtained from E. Buchner, University of Würzburg, Germany). After washing in PBS, the preparation was then incubated in PBST containing anti-mouse CY3-conjugated goat antibody (1:500; Jackson ImmunoResearch, Cat. No. 715-165-150) for 2 h at room temperature, washed in PBST, and incubated in PBS for image acquisition using an Olympus FV300 confocal laser-scanning microscope equipped with an Olympus 60× 0.9 numerical aperture (NA) water-immersion objective.
Electron microscopy.
Dissected larvae were prefixed in a mixture of 3% glutaraldehyde and 1% formaldehyde in 0.1 m cacodylate buffer for 2 h at room temperature and then overnight at 4°C. After washing in 0.1 m cacodylate buffer, the tissue was postfixed in 2% osmium tetroxide in 0.1 m cacodylate buffer for 1 h at room temperature, dehydrated in a series of ethanol dilutions (50%, 70%, 90%, 95%, and 100%) followed by propylene oxide, and embedded in Epon/Araldite. Ultrathin sections (60 nm) were poststained with 2% uranyl acetate and Reynold's lead citrate. Images were obtained on a JEOL (JEM-1200EX) electron microscope fitted with a Gatan BioScan digital camera.
Generation of flies transgenic for mitochondrially targeted Ca2+ indicators.
Genetically encoded Ca2+ indicators (GECIs) were expressed in MNs under the control of the GAL4/UAS system (Brand and Perrimon, 1993). cDNAs for ratiometric pericam (RP), camgaroo-2 (CG2), and yellow cameleon-2 (YC2) were provided by Nicolas Demaurex. GECIs were targeted to matrices of mitochondria by fusing a tandem repeat of the first 36 aa of subunit VIII of human cytochrome oxidase (COX) (Filippin et al., 2005) to the N terminus of each GECI. The fused cDNAs were then cloned into a P-element vector (pUAST), and injected into w1118 Drosophila embryos by Rainbow Transgenic Flies (Newbury Park, CA). Strains containing homozygous transgenes were obtained after determining the chromosome harboring the transgene and out-crossing all other chromosomes. In Ca2+-imaging experiments, a single copy of a UAS-GECI transgene was driven by a single copy of the MN driver OK6-Gal4.
Wide-field Ca2+ imaging.
Imaging of fura-dextran, rhod-dextran, AF647-dextran and all mitochondrial GECIs, was performed using wide-field microscopy on an Olympus BX51WI microscope fitted with a 100× water-immersion objective (1.0 NA). A Sutter Instrument DG4 fluorescence excitation system was used to select excitation wavelengths, while a Sutter Instrument Lambda 10-B filter wheel, placed before an Andor Technology EMCCD camera (DV887), was used to filter emitted fluorescence. Filters and dichroic mirrors were obtained from Chroma Technology or Semrock. The imaging system was controlled through an Andor Technology PCU100 and Dell PC running Andor IQ software (ver.1.8).
To stimulate larval MN axons, the segmental nerve was cut close to the ventral ganglion and drawn into the lumen of a glass micropipette. Individual stimulus impulses were 300 μs in duration and 2.4 V in amplitude. Stimuli were delivered via a Master-8 stimulator (A.M.P.I.) and a Digitimer model DS2A Mk.II. All Ca2+ imaging was performed in HL6 solution containing 2 mm Ca2+ and 7 mm l-glutamic acid to desensitize postsynaptic glutamate receptors and eliminate muscle contraction (Macleod et al., 2004).
Fura-dextran, a high-affinity (KD = 594 nm in vitro) Ca2+-indicator conjugated to 10,000 MW dextran, was used to measure the concentration of free Ca2+ in the cytosol ([Ca2+]c). Fura was forward-filled into terminals by cutting the segmental nerve of a dissected larva and exposing the cut end to a mixture of HL6 and distilled-water containing the fluorophore (∼2 mm). After ∼40 min Fura was rinsed off and the dye was allowed to equilibrate in the axon for >60 min (Macleod et al., 2002; Rossano and Macleod, 2007).
Fura fluorescence was examined using alternating 340/26 and 387/11 nm exciter filters, a 409 nm dichroic mirror and a 510/84 nm emission (em) filter. Fluorescence signals were converted to [Ca2+]c using Equation 5 of Grynkiewicz et al. (1985). Values of Rmax were obtained in situ through incubation of preparations in HL6 containing 10 mm Ca2+ and 100 μm ionomycin (Sigma, Cat. No. I9657). Values of Rmin were more difficult to obtain in situ. Despite long incubation times in Ca2+-free HL6 with 5 mm EGTA and high concentrations of various permeabilization agents (ionomycin, digitonin and β-escin), the measured value of R did not fall significantly below resting values of R in 2 mm Ca2+ HL6. Hence, Rmin was obtained by incubating preparations in Ca2+-free HL6 with 1 mm EGTA and 100 μm BAPTA-AM (1% DMSO) for 20 min (Hendel et al., 2008). The levels of [Ca2+]c estimated in this study are sensitive to the quality of the estimate of KD for fura-dextran in vivo and the estimate of Rmin. It is likely that the KD value used here (865 nm; Tank et al., 1995) is an underestimate for fura-dextran (Thomas et al., 2000) and that the value of Rmin reflects R in the presence of a low (but non-zero) concentration of Ca2+. Both errors will result in an underestimate of the true [Ca2+]c values. Hence, the obtained values are considered to define the lower bound for the true values of [Ca2+]c. Importantly, however, any errors in the conversion from fura ratio values to [Ca2+]c will not void tests examining differences in [Ca2+]c (see Figs. 7 and 8).
Figure 7.
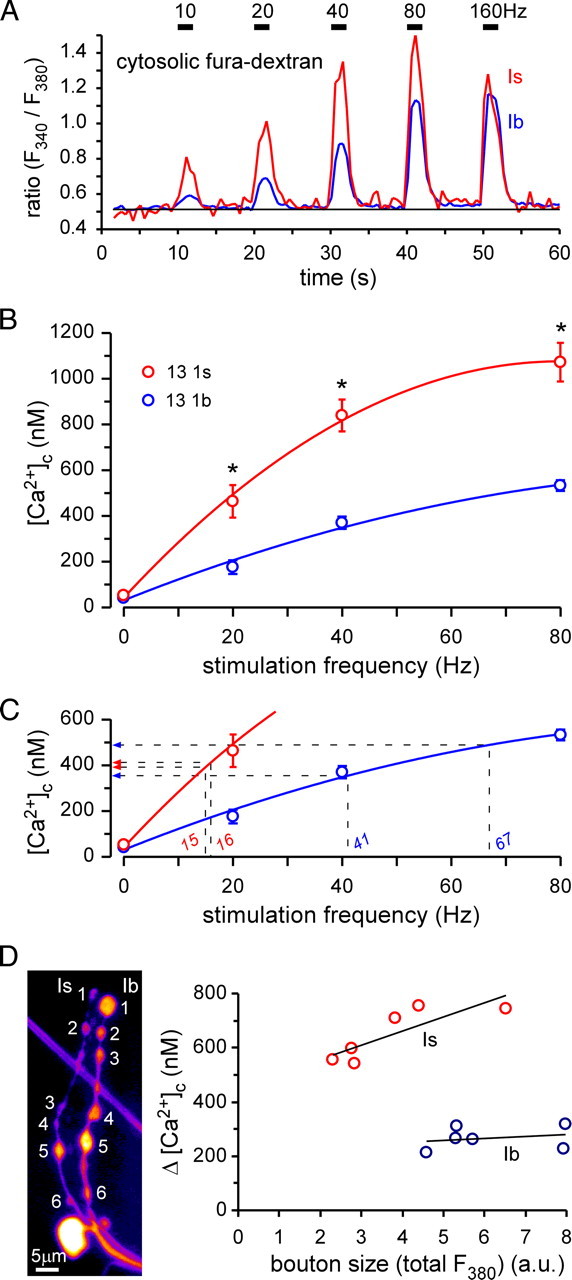
Nerve stimulation-dependent cytosolic Ca2+ levels are significantly different in type Is and Ib terminals. A, Changes in the ratio (340/380 nm) of fura-dextran fluorescence in response to nerve stimulation at 10, 20, 40, 80, and 160 Hz in MN13-Ib and MNSNb/d-Is terminals. Changes in the fura ratio can be calibrated and converted to changes in [Ca2+]c. B, Average [Ca2+]c in type Is and Ib terminals for each stimulation frequency. Data were fitted with a cubic spline. Asterisks indicate significant differences in pairwise comparisons (two-way ANOVA, p < 0.05 overall, Holm-Sidak post hoc test). Error bars indicate SEM. C, Same plot as in B but overlaid with projections of the half-maximal response frequencies of mito-RP and rhod-FF (Figs. 3D, 4E) from the abscissa to the ordinate. The corresponding values of [Ca2+]c are: MNSNb/d-Is, 412 nm (mito-RP), 391 nm (rhod-FF); MN13-Ib: 355 nm (mito-RP), 489 nm (rhod-FF). D, Plot of nerve stimulation-dependent (40 Hz, 2 s) changes in [Ca2+]c (Δ[Ca2+]c) for boutons of different sizes from type Is and Ib terminals (6 boutons from each terminal, as indicated in the image of fura-loaded MN terminals). There was no correlation between bouton size and Δ[Ca2+]c in either terminal (Spearman rank order correlation, p > 0.2).
Figure 8.

Cytosolic Ca2+ levels ([Ca2+]c) in type Ib and Is terminals do not depend on the presence of functional mitochondria. A, Average [Ca2+]c in type Ib (left) and Is terminals (right) on muscle 13 in response to a 2 s 40 Hz stimulation train. Average [Ca2+]c is shown for the wild-type control (w1118), wild-type control exposed to 3 μm CCCP, and mutant terminals homozygous for drp12 or dmiroB682. The numbers of type Ib and Is terminal pairs are indicated in the bars. No difference was found within terminal type between control and CCCP, drp12, or dmiroB682. For each treatment, [Ca2+]c responses to nerve stimulation are significantly different between type Ib and Is terminals (two-way ANOVA, p < 0.05 overall, Holm-Sidak post hoc test). B, Average [Ca2+]c in the same terminals as in A before nerve stimulation. No significant differences were found within terminal type or between treatments (two-way ANOVA). Error bars indicate SEM.
Rhod-dextran, a low-affinity 10,000 MW dextran-conjugated Ca2+ indicator (KD = 3.0 μm), was forward-filled and examined using a 543/22 nm exciter filter, a 552 nm dichroic mirror and a 593/40 nm emission filter. AF647-dextran, a Ca2+-insensitive dextran-conjugated fluorophore (10,000 MW), was forward-filled and examined using a 628/40 nm exciter filter, a 660 nm dichroic mirror and a 692/40 nm emission filter.
Confocal Ca2+ imaging.
Imaging of rhod-2, rhod-FF, rhod-5N, Texas Red dextran (10,000 MW) and GCaMP1.3 was performed on an upright Olympus confocal line-scanning microscope (BX50WI/FluoView 300) using a 60× water-immersion objective (0.9 NA). Rhod-2, -FF and -5N and Texas Red imaging settings were as follows: 543 nm laser excitation, 570 nm edge dichroic, BA605BP emission filter. GCaMP1.3, a high affinity GECI (KD ∼250 nm), was used to confirm the propagation of action potentials into nerve terminals, but was not used to quantify cytosolic Ca2+ levels. GCaMP and GFP imaging settings were: 488 nm laser excitation, 505 nm edge dichroic, BA510IF emission filter. When alternating between GCaMP imaging and rhod-FF imaging on the same terminal, an acoustic-optical tunable filter was used. Axons were stimulated as above.
Loading of synthetic mitochondrial Ca2+ indicators.
Rhod-2, -FF and -5N were loaded by bath application of the acetyloxymethyl (AM) forms using a larval preparation with uncut segmental nerves. Briefly, a 2 mm stock was made in 100% DMSO/20% pluronic acid, diluted to 5 μm (0.25% DMSO/0.05% pluronic acid) in HL6, applied to the preparation at room temperature, and incubated in the dark at 4°C for 10 min. To clear the Ca2+-indicator from the cytosol, the preparation was rinsed in Ca2+-indicator-free chilled HL6 and incubated in the dark at room temperature for 90–300 min. HL6 was replaced every 30 min during this incubation and nerves were cut and drawn into a stimulating pipette at least 20 min before imaging.
Electrophysiology.
Experiments were performed on fillet-dissected wandering third instar larvae pinned on Sylgard (Dow Corning, Midland). Segmental nerves were left intact and electrophysiological measurements during randomly occurring fictive locomotion were made within 30 min of dissection in HL6 with 2 mm CaCl2. Recordings were made using a 20× water-immersion objective of a BX51WI Olympus microscope allowing unequivocal identification of body-wall muscles 6, 13 and 12 in abdominal segment 4 (Hoang and Chiba, 2001). Micropipettes were filled with a 1:1 mixture of 3 m KCl and 3 m K+-acetate (final resistance ∼50 MΩ). Each electrode was connected to an Axoclamp 900A amplifier through 0.1 or 1.0 gain headstages (Molecular Devices). Data were digitized (model 4/30, PowerLab) and acquired with Chart 5.5.6 software (ADInstruments software and hardware). Data were analyzed using Chart software. It was often difficult to maintain long-lasting recordings during rhythmic activity. Hence, records were accepted for analysis even if resting membrane potentials fell as low as −30 mV. However, as we were quantifying a presynaptic phenomenon, and excitatory junction potentials (EJPs) at high extracellular [Ca2+] can be unambiguously resolved from the baseline (see Fig. 6), it is unlikely that accepting such data could compromise the conclusions.
Figure 6.
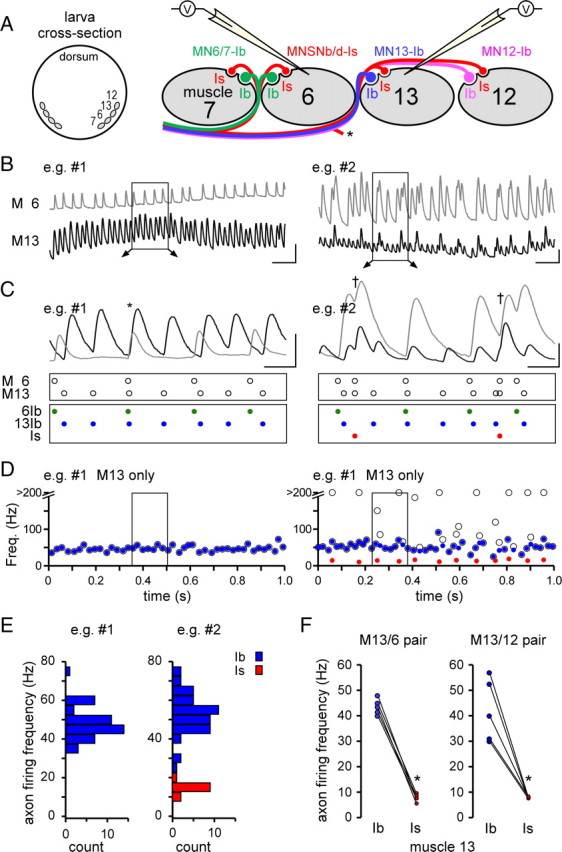
Motor neurons MNSNb/d-Is and MN13-Ib fire at different frequencies during fictive locomotion. A, Left: Cross-sectional representation showing the location of larval body-wall muscles 7, 6, 13, and 12. Right: Representation of dual recording from muscles 13 and 6 and the pattern of MN innervation. MNSNb/d-Is forms type Is boutons on all muscle fibers while motor neurons MN6/7-Ib, MN13-Ib, and MN12-Ib form type Ib boutons on selected muscle fibers. The asterisk indicates another branch of the MNSNb/d-Is. B, Two example traces (left and right) of EJPs during fictive locomotion recorded simultaneously from adjacent muscles (6 and 13). Left: Traces showing synaptic activity from separate MNs (MN6/7-Ib and MN13-Ib) on the separate muscles. Right: Traces showing synaptic activity from MN6/7-Ib and MN13-Ib, in addition to periodic input from MNSNb/d-Is that innervates both muscles. Scale bars, 100 ms and 5 mV. C, EJP–MN relationship (from boxed sections in B). Open circles (in the boxes below the traces) denote the occurrence of each EJP according to the muscle in which it is detected. Color, filled circles (in the lowest boxes) identify the MN from which each EJP originates. Coincident events between traces can be attributed to chance, alone (*left), or a common innervating axon (MNSNb/d-Is, †right). D, Plots of instantaneous EJP frequencies for muscle 13 from the example traces in B. The identity of each contributing MN is indicated: open circles, all EJPs before identification; blue circles, MN13-Ib EJPs; red circles, MNSNb/d-Is EJPs. Events occurring <3 ms apart could not be discriminated and were plotted with all other events with an instantaneous frequency of >200 Hz. E, Firing frequency distributions for the MNs producing the EJPs shown in D. F, Average maximum firing frequencies for MN13-Ib and MNSNb/d-Is (calculated during the most active 2 s period in each record). Each pair of connected circles represents estimates made from a different pair of muscle fibers, either 13 and 6 (left) or 13 and 12 (right). Asterisks indicate significance (p < 0.005) in paired t tests.
To determine the identity of the MN responsible for an EJP during fictive locomotion, we simultaneously recorded from muscle 13 and a neighboring muscle fiber (see Fig. 6A); a recording configuration used in early studies on crayfish abdominal muscles (Kennedy and Takeda, 1965). Since MNSNb/d-Is forms terminals on muscles 6, 7, 13 and 12 while MN13-Ib forms terminals only on muscle 13 (Hoang and Chiba, 2001), the dual recordings allowed us to identify the MN responsible for each EJP in muscle 13. A similar technique has been used by Lnenicka and Keshishian (2000) and Dunn and Mercier (2005) to identify MNs giving rise to nerve stimulus-evoked EJPs in Drosophila muscles.
For example, if an EJP was recorded only in muscle 13 but no simultaneous EJP was recorded in the adjacent muscle, then MN13-Ib was responsible for the EJP, as this is the only MN that exclusively innervates muscle 13 (see Fig. 6B–D, left). If EJPs were recorded simultaneously in adjacent muscles, the EJP was most likely triggered by MNSNb/d-Is, as it innervates both muscles (see Fig. 6B–D, right). Simultaneous EJPs in muscle pairs can also be expected if an AP in MN6-Ib or MN12-Ib is simply coincident with an AP in MN13-Ib. However, these events are relatively easy to discriminate, since at physiological levels of Ca2+ (2 mm) the amplitudes of EJPs triggered by MNSNb/d-Is are larger than those that are triggered by MNI3-Ib (Kurdyak et al., 1994; Cattaert and Birman, 2001) (see Fig. 6B–D, right).
Our analysis could be confounded if either MNSNb/d-II or MN12-III, which also form boutons on these muscles (muscle pair 13 and 12 and muscle 12, respectively), also generate EJPs in these muscles. Therefore, we examined the frequency of the simultaneous activity measured in muscle pair 13 and 6 versus 13 and 12. We might expect to estimate a higher average instantaneous frequency for MNSNb/d-Is when recording from muscle pair 13 and 12 (Ib: 44.2 ± 3.0 Hz, Is: 7.8 ± 0.1 Hz, mean and SEM, n = 9 and 5), relative to 13 and 6 (Ib: 40.8 ± 1.0 Hz, Is: 7.8 ± 0.6 Hz, n = 9 and 6), as MNSNb/d-II innervates muscle pair 13 and 12 but only muscle 13 in the 13 and 6 muscle pair, but no difference was detected. Therefore, any EJPs that result from APs in MNSNb/d-II are either very small or very infrequent. MN12-III is unlikely to confound our analysis since it only innervates muscle 12.
Results
Subcellular distribution of mitochondria and ER in motor neuron terminals
Each muscle fiber in the body wall of Drosophila larvae is typically innervated by two glutamatergic MNs that are morphologically and functionally different (Johansen et al., 1989; Atwood et al., 1993; Jia et al., 1993; Kurdyak et al., 1994; Lnenicka and Keshishian, 2000; Karunanithi et al., 2002). “Tonic-like” MNs form type Ib (big-bouton) terminals, while “phasic-like” MNs form type Is (small-bouton) terminals. Immunolabeling reveals an enrichment of mitochondria in most boutons of type Ib and Is terminals (Fig. 1A,B).
Figure 1.
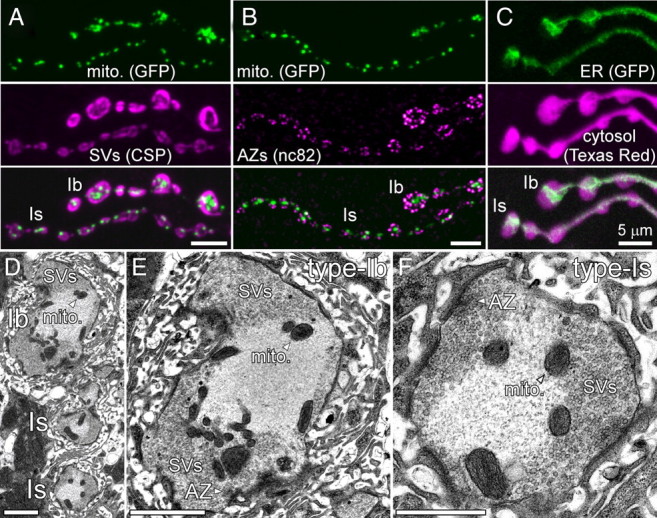
Distribution of mitochondria and the ER in larval Drosophila MN terminals. A, Confocal microscopy images of type Ib and Is terminals on muscle 6 immunolabeled for mito-GFP (green) and CSP of synaptic vesicles (SVs; magenta). Mito-GFP was expressed in MNs with the OK6-Gal4 driver. B, Confocal images of terminals immunolabeled for mito-GFP (green) and Brp (stained with antibody nc82) that is found in active zones (AZs; magenta). C, Confocal image of the ER in type Ib and Is terminals labeled by OK6-Gal4-driven expression of ER-GFP (Lyso-GFP-KDEL; green). The MN was visualized by filling the cytosol with Texas Red dextran (magenta). Note that the ER-GFP fluorescence suggests a continuous ER system throughout all boutons. Scale bars (A–C), 5 μm. D–F, Electron micrographs showing cross-sections of type Is and Ib boutons in overview (D) and in higher magnification (E, F). Mitochondria are mostly found at the interface between a central synaptic vesicle-free and a peripheral synaptic vesicle-rich region of Is and Ib boutons. Active zones with or without T-bars are indicated. Scale bars (D, E, F), 2, 2, and 1 μm, respectively.
Within axon terminals in the rat CNS and crayfish MNs, mitochondria are typically localized to a central region of synaptic boutons, termed the mitochondrial domain, which contains numerous mitochondria but almost no synaptic vesicles (Gotow et al., 1991; King et al., 1996). Mitochondria in Drosophila MN terminals show a similar localization (Fig. 1A,B,D–F). Most mitochondria are found in a more central region of the bouton, showing little overlap with synaptic vesicles, which are mostly localized in the periphery of the bouton (Fig. 1A). Importantly, most mitochondria are localized well clear of active zones (Fig. 1B). Consistently, electron micrographs show that most mitochondria are found at the interface between a central synaptic vesicle-free region and a peripheral synaptic vesicle-rich region of type Is and Ib boutons (Fig. 1D–F). Sporadically, mitochondria localize close to the plasma membrane and active zones (see also Meinertzhagen et al., 1998).
Since mitochondria can sequester Ca2+ originating from Ca2+ channels in the plasma membrane or the ER membrane (Alonso et al., 2006; Rizzuto et al., 2009), we also tested whether ER is present within terminals of larval Drosophila MNs by expressing a transgenic ER-GFP marker (Lysozyme-GFP-KDEL) and subsequently filling the MN cytosol with Texas Red dextran. ER-GFP expression has previously been shown to reliably label the ER in Drosophila cells (Snapp et al., 2004). Live imaging revealed a filamentous, likely continuous, GFP-positive network that invades every bouton in both terminal types (Fig. 1C). The extensive presynaptic distribution of the ER at larval Drosophila neuromuscular junction (NMJ) is consistent with the large number of presynaptic (ER-like) cisternae observed by EM (Guo et al., 2005), the presynaptic localization of ER-associated reticulon (Wakefield and Tear, 2006), and the effects of mutations in the sarco-ER Ca2+-ATPase (SERCA) on neurotransmitter release (Sanyal et al., 2005). Considering the extensive distribution of the ER in type Is and Ib terminals (Fig. 1C), it is therefore possible that presynaptic mitochondria may sequester Ca2+ originating from the ER.
Targeting genetically encoded Ca2+-indicators to presynaptic mitochondria
Using the GAL4/UAS system (Brand and Perrimon, 1993), we expressed genetically encoded Ca2+-indicators (GECIs) that were targeted to the mitochondrial matrix in a tissue-specific manner. Targeting of ratiometric pericam (RP), camgaroo-2 (CG2) and yellow cameleon-2 (YC2) to the mitochondrial matrix (Fig. 2A, insets) was achieved by fusing a tandem repeat of the signal sequence from subunit VIII of cytochrome oxidase c (Filippin et al., 2005) to the N terminus of each GECI. Coexpression of each GECI with cytosolic DsRed in MNs (OK6-GAL4) revealed distinct, stationary punctae of mito-RP, mito-CG2 and mito-YC2 fluorescence in synaptic boutons of larval NMJs (Fig. 2A). These punctae were often mobile in axons, moving either antero- or retrogradely in a saltatory manner (data not shown). These observations on the distribution and motion of labeled punctae are similar in all respects to those made previously for mito-GFP fluorescence (Guo et al., 2005; Pilling et al., 2006). Although expression of DsRed was strongest in type Ib terminals, mitochondrial GECIs were expressed equally in both (Fig. 2A).
Figure 2.
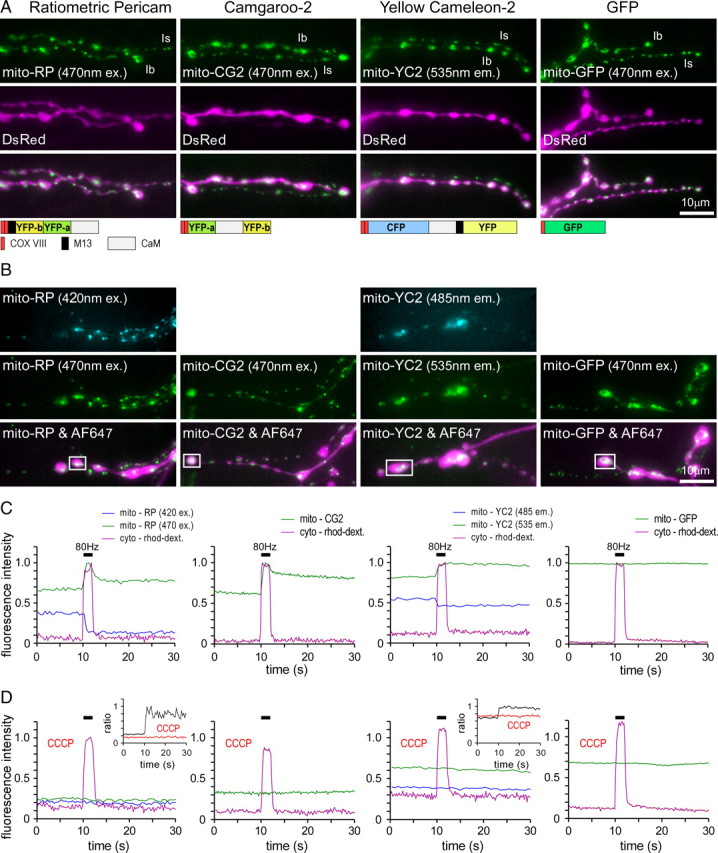
GECIs targeted to mitochondria report mitochondrial Ca2+ uptake in response to nerve stimulation. A, Fluorescence images (wide-field microscopy) showing OK6-driven expression of ratiometric mito-RP, mito-CG2, mito-YC2, and mito-GFP in type Is and Ib MN terminals on muscle 13 (top row) that were filled with cytosolic DsRed (second row). The inset below shows the basic design of each GECI. B, Fluorescence images of mito-RP, mito-CG2, mito-YC2, and mito-GFP in terminals (two top rows) filled with AF647-dextran and rhod-dextran (bottom row). Mito-RP fluorescence (520 nm emission) was excited alternately at 420 and 470 nm, mito-YC2 fluorescence (485 and 535 nm emission) was excited at 440 nm, and CG2 fluorescence (520 nm emission) and mito-GFP fluorescence (520 nm emission) was excited at 470 nm. C, D, Changes in fluorescence (boxed regions in B) in response to nerve stimulation (80 Hz, 2 s) in the absence (C) and presence (D) of the protonophore CCCP. Changes in the fluorescence of mito-RP, mito-CG2, and mito-YC2 were only observed in the absence of 3 μm CCCP, and showed little delay relative to changes in fluorescence of the cytosolic Ca2+ indicator rhod-dextran. The maximum fluorescence responses of rhod-dextran and the GECIs were normalized to a value of 1 (C), and the same scaling factors were used after application of CCCP (D). As expected, mito-GFP showed no response to nerve stimulation.
To test functionality and targeting specificity of each GECI, we compared the changes in fluorescence of each mitochondrially targeted GECI with those of a synthetic low-affinity cytosolic Ca2+-indicator (rhod-dextran) before, during and after nerve stimulation (Fig. 2B). Since rhod-dextran is invisible at resting Ca2+ levels in the cytosol, we coloaded Ca2+-insensitive AF647-dextran to visualize nerve terminals. All Ca2+-imaging data were obtained from synaptic boutons of the two MNs innervating muscle 13, MN13-Ib and MNSNb/d-Is.
Nerve stimulation for 2 s at 80 Hz caused a rapid increase in cytosolic rhod-dextran fluorescence that decayed immediately after stimulation (Fig. 2C, purple trace). Mito-RP, mito-CG2 and mito-YC2 fluorescence also changed rapidly in response to nerve stimulation but, in contrast to the cytosolic rhod-dextran fluorescence, returned only slowly to baseline after stimulation (Fig. 2C). The slow decay of mito-GECI fluorescence cannot be explained by slower Ca2+ binding and release kinetics, as all 3 untagged indicators are capable of reporting the fast decay of cytosolic Ca2+ transients in Drosophila MN terminals (Reiff et al., 2005; Mank et al., 2006). To further test the specificity of GECI targeting, we used the protonophore CCCP, which permeabilizes the inner mitochondrial membrane to protons thereby eliminating the driving force for mitochondrial Ca2+ uptake (David et al., 1998). Application of 3 μm CCCP completely abolished stimulation-dependent changes in mito-RP, mito-CG2 and mito-YC2 fluorescence while changes in cytosolic rhod-dextran responses were undiminished (Fig. 2D). This confirms that all 3 GECIs are effectively targeted to mitochondria.
It is noteworthy that mito-RP and mito-CG2 responses differ slightly from mito-YC2 responses as both show a rapid, although partial, decrease in fluorescence immediately after stimulation (Fig. 2C). This feature is not due to small amounts of mito-RP and mito-CG2 in the cytosol since application of CCCP abolishes any stimulation-dependent response (Fig. 2D). Neither mito-YC2 (Fig. 2C) nor the synthetic Ca2+ indicators rhod-2, rhod-FF and rhod-5N show a similar characteristic (see Fig. 4). Since both RP and CG2 contain cpYFP, a confirmed reporter of the superoxide anion (O2•−; Wang et al., 2008), it is likely that the transient feature is an artifact of mitochondrial O2•− production.
Figure 4.
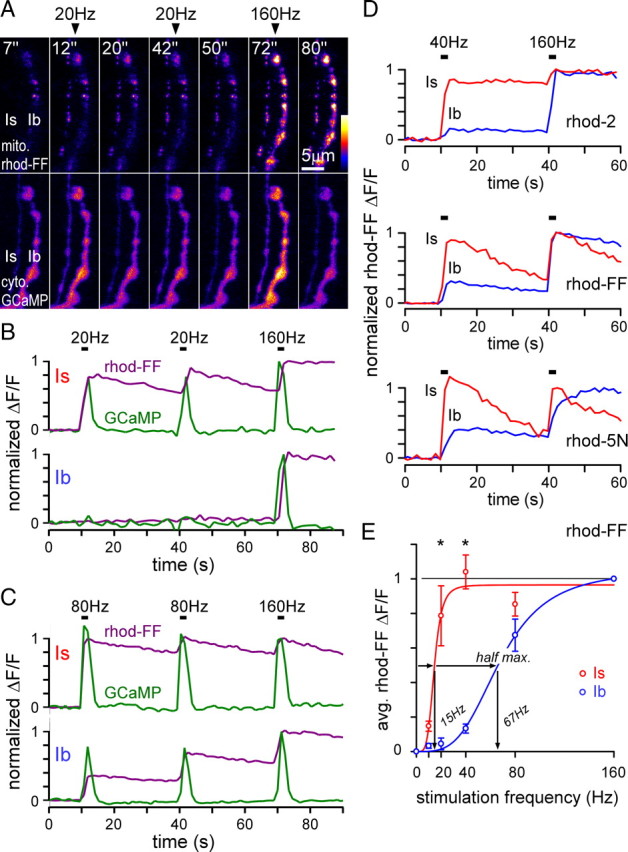
Synthetic Ca2+-indicators confirm differences in nerve stimulation-dependent mitochondrial Ca2+ uptake between terminals types. A, Fluorescence from mitochondrially localized rhod-FF (top panels) and cytosolic GCaMP1.3 (bottom panels, expression driven by OK6-Gal4) in type Is and Ib terminals on muscle 13 before, during, and after the indicated stimulus trains. B, Typical plots of nerve-stimulated (20 and 160 Hz) changes in rhod-FF and GCaMP fluorescence from the terminals in A. The ΔF/F response to 160 Hz was assigned a value of 1 and all other values of ΔF/F were scaled in proportion. C, Typical plots of changes in rhod-FF and GCaMP fluorescence in response to 80 and 160 Hz nerve stimulation. D, Typical plots of nerve-stimulated (40 and 160 Hz) changes in the fluorescence of mitochondrially targeted rhod-2, rhod-FF, and rhod-5N in type Is and Ib terminals. E, Average change in rhod-FF fluorescence from Is and Ib terminals on muscle 13 in response to various stimulation frequencies (10, 20, 40, and 80 Hz) after normalizing individual responses (as in B and C). Sigmoidal curve fits were made using the Hill equation, which was used to estimate half-maximal values as shown. Significant differences are indicated (p < 0.001, N ≥ 6, two-way ANOVA, Holm-Sidak post hoc test). Error bars indicate SEM.
Stimulation-dependent mitochondrial Ca2+ uptake differs between type Is and Ib terminals
To determine whether mitochondrial Ca2+ uptake is different between functionally different MN terminals, we compared fluorescence responses of mito-RP between type Is and Ib terminals on muscle 13 (Fig. 3). To increase cytosolic Ca2+ in a systematic manner, we applied a series of 2 s long stimulus trains spaced at 7 s long intervals. In addition, we doubled the frequency of stimulation with each stimulus train in the series; a protocol expected to double the concentration of free Ca2+ in the cytosol ([Ca2+]c) with each train in the progression (Macleod et al., 2002; Hendel et al., 2008). Surprisingly, mitochondria in type Is terminals were far more responsive to nerve stimulation than those in Ib terminals. While mitochondria in type Is terminals showed pronounced changes in mito-RP fluorescence at 20 Hz, mitochondria in Ib terminals were essentially unresponsive at the same stimulation frequency (Fig. 3B). The differential responses between terminal types were also observed with mito-CG2 and mito-YC2 (data not shown).
Figure 3.
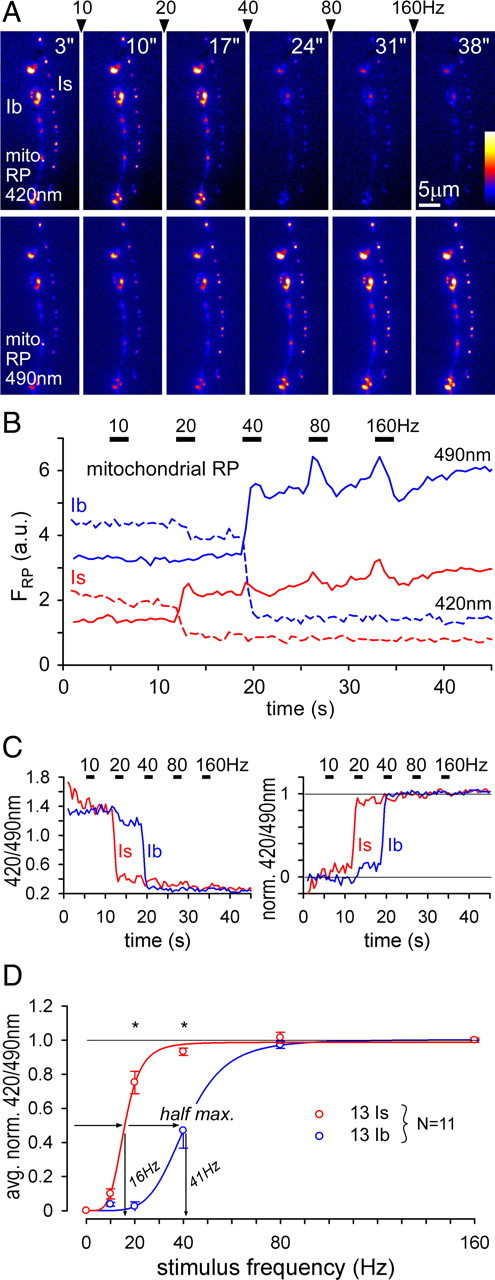
GECIs reveal differences in mitochondrial Ca2+ uptake between terminals of MN13-Ib and MNSNb/d-Is. A, Images of mito-RP fluorescence before and after successive nerve stimulus trials (left to right: stimulation frequency indicated between frames) from type Ib and Is terminals on muscle 13. Mito-RP fluorescence was collected through a 520/35 nm filter during sequential 420 nm (top panel) and 490 nm (bottom panel) excitation. B, Plot of nerve stimulation-induced changes in mito-RP fluorescence (from A). The 490ex/520em mito-RP fluorescence increased while 420ex/520em fluorescence decreased in response to 10, 20, 40, 60, and 160 Hz stimulus trains (2 s each). In contrast to 420ex/520em fluorescence, 490ex/520em fluorescence decreased when stimulation ceased, and the transient is likely due to changes in superoxide anion concentration (see Results). Images were captured at 2 frames per second for each excitation wavelength. C, Left panel: Plot of the mito-RP emission intensity ratios (420/490 nm excitation) for the terminals shown above (A, B). Right panel: Plot of the reciprocal mito-RP emission intensity ratio normalized to a value of 0 before the first train (t = 3 s) and a maximum response of 1 after the last train (t = 38 s), i.e., inverted relative to the left panel. D, Average mito-RP ratio responses plotted against the frequency of stimulation for type Ib and Is terminals on muscle 13 (n = 11). Sigmoidal curve fits were made using the Hill equation (SigmaPlot 10, Systat Software Inc.), which was used to estimate half-maximal values shown. Asterisks indicate highly significant differences (p < 0.001) between type Ib and Is responses in pairwise comparisons (two-way ANOVA, p < 0.05 overall, Tukey post hoc test). Error bars indicate SEM.
To quantify the mito-RP response, we took the ratio of RP fluorescence emitted at 520 nm when excited at 420 nm, relative to excitation at 490 nm (Fig. 3C, left), and inverted and normalized the ratio to the maximal response at 160 Hz (Fig. 3C, right). The average changes in the ratio for pairs of type Is and Ib terminals were then plotted against the frequency of stimulation (Fig. 3D). The difference in mitochondrial Ca2+ uptake between terminal types was highly significant at 20 and 40 Hz stimulation, with mitochondria in type Is terminals taking up Ca2+ at lower stimulus frequencies than in type Ib terminals (11/11 pairs; Fig. 3D). An analysis of only the 420ex/520em (excitation/emission) mito-RP response (excluding the influence of the purported O2•− transient in the 490 nm excitation response) revealed the same statistical differences between both terminal types (data not shown). Responses in the 420ex/520em mito-RP signal are considered to be very specific for Ca2+ changes whereas the 490ex/520em response is also pH-sensitive (Nagai et al., 2001; Jiang et al., 2009). Estimation of the average nerve stimulation rate at the half-maximal mitochondrial response revealed a severalfold difference between type Is and Ib terminals, i.e., 16 Hz versus 41 Hz, respectively (Fig. 3D).
Estimating the time course of decay of free Ca2+ concentration in the mitochondrial matrix ([Ca2+]m) is problematic for all three GECIs. For both mito-RP and mito-CG2, the purported O2•− transient (Fig. 2D) produces a biphasic decay that will lead to an overestimation of the initial rate of [Ca2+]m decay. Estimates of [Ca2+]m decay from mito-YC2 data are also problematic since EYFP of YC2 is pH-sensitive (Filippin et al., 2005) and susceptible to photochromism (Miyawaki et al., 1997; Abad et al., 2004). If mitochondria in type Is terminals sequester more Ca2+ under the same stimulus conditions, yet have the same Ca2+ release mechanism as mitochondria in Ib terminals, one would expect mitochondria in type Is terminals to release Ca2+ for a longer period of time after stimulation (García-Chacón et al., 2006). This trend was indeed observed with all three mitochondrial GECIs (data not shown), but the aforementioned limitations of the GECIs precluded a systematic quantitative comparison.
Synthetic Ca2+-indicators confirm different nerve stimulus thresholds for mitochondrial Ca2+ uptake
The evoked responses from mito-RP (Fig. 3) seem to indicate that mitochondria in type Is and Ib terminals have different Ca2+-handling properties. To test this further, we examined mitochondrial Ca2+ levels using synthetic Ca2+ indicators. We loaded the acetoxymethyl ester (AM) forms of rhod-2, rhod-FF or rhod-5N (KD = 0.57, 19, and 320 μm, respectively) into the mitochondria using a modified protocol of Guo et al. (2005). As rhod-FF and rhod-5N have lower affinities for Ca2+ than the mito-GECIs, they are unlikely to saturate at the previously estimated in situ values of [Ca2+]m for presynaptic mitochondria (∼1 μm: David, 1999; David et al., 2003; ≥5 μm: Billups and Forsythe, 2002). GCaMP was transgenically expressed in the same terminals to monitor cytosolic Ca2+ levels.
For these experiments, we used a modified nerve stimulation protocol to ensure that submaximal responses were both repeatable and additive. We first applied a stimulus train at a given frequency, repeated the same stimulus train after 30 s, and ended the series after a second 30 s rest period with a final high-frequency train at 160 Hz (320 pulses; Fig. 4A–C). Since all rhod-indicators are poorly visible at low levels of Ca2+, ΔF/F measurements were normalized to the maximal response at 160 Hz to avoid the high degree of variance that would arise if responses were normalized to resting fluorescence levels. Stimulus-evoked transients of rhod-2 (Fig. 4D), rhod-FF (Fig. 4B–D) and rhod-5N (Fig. 4D) were qualitatively much different to those of GCaMP in the cytosol (Fig. 4B,C). In addition, application of the protonophore CCCP abolished changes in rhod-FF but not GCaMP fluorescence (data not shown), confirming a mitochondrial localization.
Like mitochondrial GECIs (Fig. 3), Rhod-2, -FF and -5N revealed pronounced differences in mitochondrial Ca2+ uptake between type Is and Ib terminals (Fig. 4B–D). A rhod-FF response was usually evident in type Is terminals at a stimulation frequency of just 10 Hz, while Ib terminals were usually not responsive below 40 Hz (Fig. 4E). The stimulus-dependent, half-maximal mitochondrial rhod-FF response was significantly different between type Is (15 Hz) and Ib (67 Hz) terminals (Fig. 4E). A similar relative difference between terminal types was seen with rhod-2 and rhod-5N (Fig. 4D). The rhod-FF-based half-maximal estimate for type Ib was higher than that based on mito-RP data (67 Hz vs 41 Hz, respectively). A possible explanation is that [Ca2+]m approaches levels that saturate mito-RP, but not rhod-FF.
When the high-affinity Ca2+ indicator rhod-2 was substituted for rhod-FF, mitochondrial Ca2+ uptake in type Ib terminals was still not detectable during 10 Hz stimulation (data not shown). In addition, when the low-affinity Ca2+ indicator rhod-5N was substituted for rhod-FF, the fluorescent signal from type Is terminals still appeared to “peak” at a stimulation frequency of 40 Hz (Fig. 4D, bottom panel, and see Fig. 4E). Since the ratio of the 40 Hz to the 160 Hz response was similar when using rhod-5N or rhod-FF (compare Fig. 4D bottom panel with middle panel), rhod-FF was likely to be within a linear response range (i.e., the 40 Hz response in either terminal type is well below the rhod-FF KD of ∼19 μm).
Notably, the time course of mitochondrial rhod-FF fluorescence decay was significantly different between terminal types. In type Is terminals it took 181 s to decay by ∼63% after a 40 Hz 2 s stimulus train, while it took only 46 s in Ib terminals (monoexponential fit, median values, Mann–Whitney rank sum test; p < 0.01). The slower [Ca2+]m decay in type Is terminals indicates either a slower rate of Ca2+ release or a greater mitochondrial Ca2+ load. Considering that mitochondria in type Is terminals are more responsive to nerve stimulation it is likely that these mitochondria obtained a greater Ca2+ load. The slower rate of rhod-2 fluorescence decay in both terminal types (Fig. 4D), relative to rhod-FF or rhod-5N, may be due to a contribution of rhod-2 to the Ca2+ buffering capacity of the mitochondrial matrix, which can slow the kinetics of mitochondrial Ca2+ loss (Gaspers and Thomas, 2008).
Mitochondrial Ca2+ uptake does not rely on ER Ca2+ transfer
One possible explanation for the higher sensitivity of mitochondrial Ca2+ sequestration to nerve stimulation in type Is terminals is that mitochondria in these terminals are in close association with Ca2+ micro-domains. Since most mitochondria in both type Is and Ib boutons are found relatively distant from active zones harboring presynaptic Ca2+ channels (Fig. 1B,D–F), a close association between mitochondria and Ca2+-channels in plasma membrane can excluded. However, mitochondria in type Is and/or Ib terminals could be in close association with Ca2+ channels on the ER membrane due to the extensive nature of the ER network (Fig. 1C). However, mitochondrial Ca2+ uptake was undiminished in either terminal type in the presence of 20 μm thapsigargin (Fig. 5A,B), a SERCA inhibitor that mimics presynaptic Ca2+ clearance defects of Drosophila SERCA mutants at larval NMJs (Kuromi and Kidokoro, 2002; Sanyal et al., 2005). Similarly, in the presence of 100 μm ryanodine, which inhibits ryanodine receptors (Shakiryanova et al., 2007), mitochondrial Ca2+ uptake was also undiminished (Fig. 5C). Hence, the differential mitochondrial responses in type Is and Ib terminals cannot be explained by preferential ER Ca2+ transfer. Consequently, it seems likely that mitochondria mostly sequester Ca2+ from the undifferentiated cytosol, where [Ca2+]c only rises to several hundred nm during comparable stimulus trains (Macleod et al., 2004; Guo et al., 2005, their Fig. 7C).
Figure 5.

Mitochondrial Ca2+ uptake is not dependent on Ca2+ transfer from the ER. A–C, Plots of the average mito-RP fluorescence in type Ib and Is terminals on muscle 13 in response to nerve stimulation (40 Hz, 2 s). The mito-RP ratio (420/470) is shown on an inverted scale for untreated terminals (A) and terminals treated with 20 μm thapsigargin (B) or 100 μm ryanodine (C). The records are truncated at the end of the stimulus train, as treated preparations (≥30 min) commonly contracted at the end of each train. The numbers of terminal pairs examined are shown at the bottom of each plot.
Motor neurons MNSNb/d-Is and MN13-Ib fire at different frequencies
To provide a physiological context for the observed differences in mitochondrial Ca2+-uptake between type Is and Ib terminals, and to determine whether mitochondrial Ca2+ sequestration limits cytosolic Ca2+ within a physiological range of activity, we determined the native firing frequencies of the two MNs innervating muscle 13 (MNSNb/d-Is and MN13-Ib). Since MN13-Ib only innervates muscle 13 while MNSNb/d-Is also innervates neighboring muscles (Fig. 6A), simultaneous recordings of excitatory junctional potentials (EJPs) from muscle 13 and the neighboring muscle 6 can identify the MN that triggered a particular EJP (Fig. 6A–D; see Materials and Methods for a full description).
When the nerve was left intact, we observed rhythmic bursts of spontaneous synaptic activity that have been earlier described as fictive locomotion activity (Budnik et al., 1990; Cooper and Neckameyer, 1999; Cattaert and Birman, 2001; Barclay et al., 2002; Suster et al., 2004; Wang et al., 2004; Klose et al., 2005; Fox et al., 2006). After correlating each EJP with its originating MN (Fig. 6C), we calculated the instantaneous firing frequency for each MN (1/time interval in s between EJPs; Fig. 6D,E), from which we then determined the average peak firing frequency for a period of 2 s (Fig. 6F). This analysis revealed, on average, a maximum firing frequency of 7.8 ± 0.3 Hz (SEM; n = 11) for MNSNb/d-Is, and 42.4 Hz ± 1.6 Hz (n = 18) for MN13-Ib (p < 0.005, Fig. 6F). The same significant difference in firing frequencies was observed for paired recordings from muscle pair 13 and 6 (Fig. 6F, left) and 13 and 12 (Fig. 6F, right).
The firing frequencies measured for both MNs provided an important foundation for considering the physiological significance of mitochondrial Ca2+ sequestration. In addition, comparing the average maximum firing frequencies with the observed sensitivity of mitochondrial Ca2+ sequestration to nerve stimulation (Figs. 3D, 4E) predicted that mitochondria in MN13-Ib terminals may sequester Ca2+ more actively than those of MNSNb/d-Is terminals.
Stimulus-dependent cytosolic Ca2+ levels are higher in type Is than Ib terminals
Why do mitochondria in type Is terminals take up Ca2+ at much lower axon excitation frequencies than those in Ib terminals? Mitochondria could have different thresholds (set points) for Ca2+ sequestration. Alternatively, [Ca2+]c could rise higher in type Is than Ib terminals for a given stimulation frequency, although this was previously discounted (Karunanithi et al., 1997; Reiff et al., 2002; but see Rossano and Macleod, 2007, and He et al., 2009).
Since a reliable estimate of [Ca2+]c is required for evaluating the role of mitochondrial Ca2+ sequestration, we measured [Ca2+]c in type Is and Ib terminals using the ratiometric Ca2+-indicator Fura. We applied a series of 2 s long stimulus trains spaced at 10 s intervals, doubling the stimulation frequency with each train (Fig. 7A). Unexpectedly, [Ca2+]c reached much higher levels in type Is than in Ib terminals at all examined stimulation frequencies (Fig. 7A,B). Since type Is boutons are much smaller than Ib boutons, it was possible that the higher [Ca2+]c in Is boutons is due to the difference in the surface area-to-volume ratio. However, this possibility could be excluded since no correlation was detected between the size of a bouton and its stimulated [Ca2+]c level (Fig. 7D). The higher [Ca2+]c in type Is boutons is consistent with a higher per-volume-density of active zones in phasic MN terminals, as reported previously in Drosophila (Meinertzhagen et al., 1998; He et al., 2009) and crayfish (Msghina et al., 1999).
The much higher cytosolic Ca2+ levels of type Is terminals provide a simple explanation for why mitochondria in type Is terminals sequester Ca2+ at lower stimulation frequencies than in Ib terminals. In addition, relating stimulation-dependent [Ca2+]c to mitochondrial Ca2+ sequestration revealed that mitochondrial Ca2+ sequestration in Is and Ib terminals has similar Ca2+ thresholds and affinities. At stimulation frequencies corresponding to the half-maximal mitochondrial response (Figs. 3D, 4E), the projected values of [Ca2+]c were quite similar for both terminals, reaching 402 nm for MNSNb/d-Is and 422 nm for MN13-Ib (Fig. 7C). This suggests that mitochondria in different types of terminals exhibit a similar affinity for Ca2+ uptake. In addition, mitochondria in both terminal types start acquiring Ca2+ once it exceeds ∼250 nm (i.e., mitochondria start acquiring Ca2+ at ∼10 Hz in type Is terminals and soon after 20 Hz is exceeded in Ib terminals, Figs. 3D, 4E).
Stimulus-dependent cytosolic Ca2+ levels are not affected by the absence of functional mitochondria
As the Ca2+ affinity of mitochondrial Ca2+ sequestration is similar in type Is and Ib terminals, it seemed possible that a higher mitochondrial density may more effectively limit stimulus-dependent elevations in [Ca2+]c. Both immunolabelings (Fig. 1A,B) and 3D-EM reconstructions suggest that type Ib terminals may have more mitochondria than Is terminals (Atwood et al., 1993; Hill, 1996). Accordingly, the higher stimulus-dependent [Ca2+]c in type Is terminals could be due to a reduced mitochondrial Ca2+ buffering capacity.
To determine the significance of mitochondrial Ca2+ sequestration for limiting [Ca2+]c, we measured the [Ca2+]c in type Is and Ib terminals after acutely or chronically abolishing mitochondrial Ca2+ uptake (Fig. 8). Although application of the protonophore CCCP acutely eliminated mitochondrial Ca2+ uptake (Fig. 2D), it had little impact on the [Ca2+]c in type Ib or Is terminals during stimulation (Fig. 8A) or at rest (Fig. 8B). In addition, stimulus-dependent or resting cytosolic Ca2+ levels were not affected by the chronic reduction of mitochondria (Fig. 8A,B) in terminals of drp12 mutants (Verstreken et al., 2005), or the chronic lack of mitochondria (Fig. 8A,B) in terminals of dmiroB682 mutants (Guo et al., 2005). Hence, mitochondrial Ca2+ sequestration does not limit stimulated Ca2+ levels in these MN terminals during short trains of up to 40 Hz stimulation, which mimics the upper range of MN13-Ib firing frequencies during fictive locomotion and exceeds those of MNSNb/d-Is by fivefold.
Discussion
This study pursued two major goals: to test whether mitochondrial Ca2+ sequestration limits cytosolic Ca2+ in axon terminals within a physiological range of activity, and to test whether mitochondrial Ca2+ sequestration is tuned to the different Ca2+ environments and demands of two functionally different MN terminals. The arrangement of the Drosophila larval NMJ, where phasic-like and tonic-like MNs innervate the same muscle fiber, provides a convenient model for investigating both questions. Despite the striking differences in native firing rates and stimulus-dependent Ca2+ levels of the two terminals, their presynaptic mitochondria exhibit a similar affinity for Ca2+ uptake in response to transient, depolarization-dependent Ca2+ elevations without significantly constraining cytosolic Ca2+ levels.
Suitability of GECIs for monitoring mitochondrial Ca2+ uptake in presynaptic terminals
Synthetic Ca2+-indicators have excellent properties but cell-specific loading can be challenging. While GECIs have been previously targeted to mitochondria in neurons (Núñez et al., 2007), their utility as reporters of [Ca2+]m in the highly dynamic Ca2+ environment of a nerve terminal has not been tested. In our system, RP, YC2 and CG2 were very effectively targeted to the matrix of presynaptic mitochondria, as no fluorescence originating from the presynaptic cytosol could be detected. This was a fortunate result, as a similar targeting strategy resulted in significant fluorescence from the cytosol of HeLa cells (Filippin et al., 2005). Mitochondrial transport may take credit for this serendipitous result, since axon terminals are likely out of range for diffusion from the soma where the proteinaceous indicators are translated and likely imported into mitochondria.
All of the mitochondrial GECIs examined are highly responsive to nerve stimulation. Synthetic Ca2+-indicators covering a wide range of Ca2+-affinities did not report any changes in [Ca2+]m that went undetected by the mitochondrially targeted GECIs, indicating that the Ca2+-affinity of mito-RP, mito-YC2 and mito-CG2 are well suited for reporting changes in [Ca2+]m. Although the response time of GECIs is often inferior to that of synthetic Ca2+-indicators (Pologruto et al., 2004; Wallace et al., 2008), this did not limit their utility in the mitochondrial matrix.
Mitochondrial Ca2+ sequestration is not tuned to different presynaptic Ca2+ environments
Mitochondria isolated from different regions of the rat brain differ in their enzyme activities, fatty acid content, ROS content, and their Ca2+ dependence of mitochondrial depolarization and permeability transition pore opening (Lai et al., 1977, 1994; Battino et al., 1991; Friberg et al., 1999; Dubinsky, 2009). In the context of such functional heterogeneity, it seems possible, if not likely, that mitochondrial Ca2+ sequestration may be tuned to different presynaptic Ca2+ environments, like those of phasic and tonic neurons.
Our analysis of mitochondrial Ca2+ sequestration in terminals of tonic-like MN13-Ib and phasic-like MNSNb/d-Is MNs provided no evidence for differential regulation of mitochondrial Ca2+ sequestration in functionally different terminals. Presynaptic mitochondria in type Is and Ib terminals exhibited similar affinities (∼410 nm) for Ca2+ sequestration, although the native firing rate and stimulated [Ca2+]c differ significantly between the two terminal types. In addition, [Ca2+]c needs to reach only ∼250 nm for ≤2 s before mitochondria take up Ca2+ in each type of terminal. This threshold is similar to that estimated for lizard MN terminals (≤300 nm; David et al., 1998; David et al., 2003) and is consistent with the low values estimated in dissociated sympathetic neurons (Colegrove et al., 2000). Similar to findings in other terminals (Tang and Zucker, 1997; David, 1999; Billups and Forsythe, 2002; Kim et al., 2005), we also found that Ca2+ release from the ER is not required for presynaptic mitochondrial Ca2+ sequestration in response to presynaptic stimulation. Finally, mitochondrial Ca2+ sequestration had little or no impact on [Ca2+]c in response to nerve stimulation in either terminal type.
Mitochondrial Ca2+ sequestration is unlikely to be a universal mechanism limiting presynaptic Ca2+ levels at native firing rates
A primary objective of this study was to test the ability of mitochondrial Ca2+-sequestration to limit the [Ca2+]c in presynaptic terminals of MNs during physiologically relevant firing rates and durations. Our data provide such a test for the following reasons: a) Both MN axons were stimulated at, or above, the maximal firing rate that was recorded in situ for each MN during fictive locomotion. b) We used a 2 s long stimulation train, which is similar in duration to the period of rhythmic bursts of activity during fictive locomotion, and probably exceeds the duration of episodic activity during unrestrained locomotion (Klose et al., 2005). c) It seems unlikely that a single, 2 s long stimulation train will significantly deplete the ATP available to power Ca2+ clearance mechanisms. d) After inhibiting the mitochondrial proton gradient, MN terminals were only stimulated after a resting period of at least 10 min, a period over which it is reasonable to expect that the ATP/ADP ratio reaches equilibrium by glycolysis alone.
To comprehensively address the role of mitochondrial Ca2+ sequestration in buffering cytosolic Ca2+ levels, we used the protonophore CCCP to acutely inhibit mitochondrial Ca2+ sequestration. In addition, we examined the effects of chronically reducing or abolishing presynaptic mitochondria by examining [Ca2+]c in mutant terminals that either contained a greatly reduced number of mitochondria (drp12) or no mitochondria at all (dmiroB682). Consistently, neither acute nor chronic manipulations had an impact on evoked [Ca2+]c during short stimulus trains at 40 Hz. This lack of an effect indicates that mitochondrial Ca2+ sequestration is ineffective at buffering changes in presynaptic [Ca2+]c at nerve firing rates close to or above native firing rates. Hence, mitochondrial Ca2+ sequestration is not universally required for buffering transient changes in presynaptic Ca2+ within physiological ranges of nerve activity.
Two other studies examining mitochondrial Ca2+ sequestration at MN terminals also found no evidence that mitochondrial Ca2+ sequestration limits [Ca2+]c during lower frequencies of stimulation (David and Barrett, 2000; Lnenicka et al., 2006) but did not provide the physiological context of native firing frequencies. In addition, mitochondria at the Calyx of Held apparently participate in Ca2+ clearance only when the Ca2+ load is large or prolonged (Kim et al., 2005; Lee et al., 2007), although it is not clear whether these are physiological Ca2+ loads.
The design of our study, and consequently our findings, differ from those of earlier studies on MN terminals (Tang and Zucker, 1997; David et al., 1998; Narita et al., 1998; David and Barrett, 2000; Suzuki et al., 2002; Guo et al., 2005; Verstreken et al., 2005; Bennett et al., 2007). We specifically focused on the impact of mitochondrial Ca2+ sequestration in limiting [Ca2+]c at physiological axon firing rates to avoid misleading or artifactual results. Specifically, we did not consider conditions of either prolonged or high-frequency nerve stimulation, where Ca2+-induced mitochondrial ATP production is likely required to limit [Ca2+]c. In fact, prolonged stimulation (>30 s at 10 Hz) of Drosophila type Ib terminals that lack a normal amount of mitochondria (drp1 or dmiro mutants) causes an abnormal increase in [Ca2+]c and a run-down of neurotransmitter release, which can be restored by providing ATP in the recording solution (Guo et al., 2005; Verstreken et al., 2005).
What is the consequence of mitochondrial Ca2+ uptake?
If Ca2+-sequestration by presynaptic mitochondria is not required for buffering cytosolic Ca2+ transients within physiological ranges of stimulation, then what is its physiological role? One possibility is that it may serve to coordinate ATP supply with demand in axon terminals during synaptic transmission. Considering the high ATP demands of recycling synaptic vesicles, Ca2+ clearance mechanisms, and maintaining ion gradients, it is unlikely that glycolysis alone can meet a rapid increase in presynaptic ATP demand. Consistently, glycolysis alone is adequate to maintain ATP-dependent processes in synaptosomes at rest, but not in response to challenges that accelerate ATP demand (Scott and Nicholls, 1980). Oxidative phosphorylation, and thereby ATP production, can be increased in non-neuronal cells by cytosolic Ca2+ spikes that stimulate up to four Ca2+-sensitive mitochondrial dehydrogenases and the F1F0-ATPase (for review, see Denton, 2009; Balaban, 2009). Mitochondrial ATP production in neurons and axon terminals may also be controlled by such a mechanism although experimental evidence is lacking (Kann and Kovacs, 2007).
Footnotes
This study was supported by grants from the National Institute of Neurological Disorders and Stroke to G.T.M. [National Institutes of Health (NIH) R01 NS061914] and K.E.Z. (NIH R21 NS055202). We are grateful to Andrea Wellington for assistance in preparing cDNA for transforming animals, and to Mingshan Xue and James Fisher for assistance in collecting preliminary data. We thank Roger Tsien and Atsushi Miyawaki for permission to use Camgaroo (Tsien), Yellow Cameleon (Tsien), and Ratiometric Pericam (Miyawaki), and Tullio Pozzan and Nicolas Demaurex for providing plasmids containing the cDNA. We thank Richard Axel, Hugo Bellen, Mary Lilly, and William Saxton for providing fly strains, Rosario Martinez for maintaining fly stocks, Harold Atwood for helpful discussions, and Joel Rawson for critical comments on the manuscript.
References
- Abad MF, Di Benedetto G, Magalhães PJ, Filippin L, Pozzan T. Mitochondrial pH monitored by a new engineered green fluorescent protein mutant. J Biol Chem. 2004;279:11521–11529. doi: 10.1074/jbc.M306766200. [DOI] [PubMed] [Google Scholar]
- Aberle H, Haghighi AP, Fetter RD, McCabe BD, Magalhães TR, Goodman CS. wishful thinking encodes a BMP type II receptor that regulates synaptic growth in Drosophila. Neuron. 2002;33:545–558. doi: 10.1016/s0896-6273(02)00589-5. [DOI] [PubMed] [Google Scholar]
- Alonso MT, Villalobos C, Chamero P, Alvarez J, García-Sancho J. Calcium microdomains in mitochondria and nucleus. Cell Calcium. 2006;40:513–525. doi: 10.1016/j.ceca.2006.08.013. [DOI] [PubMed] [Google Scholar]
- Atwood HL, Govind CK, Wu CF. Differential ultrastructure of synaptic terminals on ventral longitudinal abdominal muscles in Drosophila larvae. J Neurobiol. 1993;24:1008–1024. doi: 10.1002/neu.480240803. [DOI] [PubMed] [Google Scholar]
- Balaban RS. Domestication of the cardiac mitochondrion for energy conversion. J Mol Cell Cardiol. 2009;46:832–841. doi: 10.1016/j.yjmcc.2009.02.018. [DOI] [PMC free article] [PubMed] [Google Scholar]
- Barclay JW, Atwood HL, Robertson RM. Impairment of central pattern generation in Drosophila cysteine string protein mutants. J Comp Physiol A Neuroethol Sens Neural Behav Physiol. 2002;188:71–78. doi: 10.1007/s00359-002-0279-9. [DOI] [PubMed] [Google Scholar]
- Battino M, Bertoli E, Formiggini G, Sassi S, Gorini A, Villa RF, Lenaz G. Structural and functional aspects of the respiratory chain of synaptic and nonsynaptic mitochondria derived from selected brain regions. J Bioenerg Biomembr. 1991;23:345–363. doi: 10.1007/BF00762227. [DOI] [PubMed] [Google Scholar]
- Bennett MR, Farnell L, Gibson WG, Dickens P. Mechanisms of calcium sequestration during facilitation at active zones of an amphibian neuromuscular junction. J Theor Biol. 2007;247:230–241. doi: 10.1016/j.jtbi.2007.03.022. [DOI] [PubMed] [Google Scholar]
- Billups B, Forsythe ID. Presynaptic mitochondrial calcium sequestration influences transmission at mammalian central synapses. J Neurosci. 2002;22:5840–5847. doi: 10.1523/JNEUROSCI.22-14-05840.2002. [DOI] [PMC free article] [PubMed] [Google Scholar]
- Blaustein MP, Juhaszova M, Golovina VA, Church PJ, Stanley EF. Na/Ca exchanger and PMCA localization in neurons and astrocytes: functional implications. Ann N Y Acad Sci. 2002;976:356–366. doi: 10.1111/j.1749-6632.2002.tb04762.x. [DOI] [PubMed] [Google Scholar]
- Brand AH, Perrimon N. Targeted gene expression as a means of altering cell fates and generating dominant phenotypes. Development. 1993;118:401–415. doi: 10.1242/dev.118.2.401. [DOI] [PubMed] [Google Scholar]
- Budnik V, Zhong Y, Wu CF. Morphological plasticity of motor axons in Drosophila mutants with altered excitability. J Neurosci. 1990;10:3754–3768. doi: 10.1523/JNEUROSCI.10-11-03754.1990. [DOI] [PMC free article] [PubMed] [Google Scholar]
- Cattaert D, Birman S. Blockade of the central generator of locomotor rhythm by noncompetitive NMDA receptor antagonists in Drosophila larvae. J Neurobiol. 2001;48:58–73. doi: 10.1002/neu.1042. [DOI] [PubMed] [Google Scholar]
- Colegrove SL, Albrecht MA, Friel DD. Dissection of mitochondrial Ca2+ uptake and release fluxes in situ after depolarization-evoked [Ca2+]i elevations in sympathetic neurons. J Gen Physiol. 2000;115:351–370. doi: 10.1085/jgp.115.3.351. [DOI] [PMC free article] [PubMed] [Google Scholar]
- Cooper RL, Neckameyer WS. Dopaminergic modulation of motor neuron activity and neuromuscular function in Drosophila melanogaster. Comp Biochem Physiol B Biochem Mol Biol. 1999;122:199–210. doi: 10.1016/s0305-0491(98)10160-8. [DOI] [PubMed] [Google Scholar]
- David G. Mitochondrial clearance of cytosolic Ca2+ in stimulated lizard motor nerve terminals proceeds without progressive elevation of mitochondrial matrix [Ca2+] J Neurosci. 1999;19:7495–7506. doi: 10.1523/JNEUROSCI.19-17-07495.1999. [DOI] [PMC free article] [PubMed] [Google Scholar]
- David G, Barrett EF. Stimulation-evoked increases in cytosolic [Ca2+] in mouse motor nerve terminals are limited by mitochondrial uptake and are temperature-dependent. J Neurosci. 2000;20:7290–7296. doi: 10.1523/JNEUROSCI.20-19-07290.2000. [DOI] [PMC free article] [PubMed] [Google Scholar]
- David G, Barrett JN, Barrett EF. Evidence that mitochondria buffer physiological Ca2+ loads in lizard motor nerve terminals. J Physiol. 1998;509:59–65. doi: 10.1111/j.1469-7793.1998.059bo.x. [DOI] [PMC free article] [PubMed] [Google Scholar]
- David G, Talbot J, Barrett EF. Quantitative estimate of mitochondrial [Ca2+] in stimulated motor nerve terminals. Cell Calcium. 2003;33:197–206. doi: 10.1016/s0143-4160(02)00229-4. [DOI] [PubMed] [Google Scholar]
- Denton RM. Regulation of mitochondrial dehydrogenases by calcium ions. Biochim Biophys Acta. 2009;1787:1309–1316. doi: 10.1016/j.bbabio.2009.01.005. [DOI] [PubMed] [Google Scholar]
- Dubinsky JM. Heterogeneity of nervous system mitochondria: location, location, location! Exp Neurol. 2009;218:293–307. doi: 10.1016/j.expneurol.2009.05.020. [DOI] [PubMed] [Google Scholar]
- Dunn TW, Mercier AJ. Synaptic modulation by a Drosophila neuropeptide is motor neuron-specific and requires CaMKII activity. Peptides. 2005;26:269–276. doi: 10.1016/j.peptides.2004.09.010. [DOI] [PubMed] [Google Scholar]
- Filippin L, Abad MC, Gastaldello S, Magalhães PJ, Sandonà D, Pozzan T. Improved strategies for the delivery of GFP-based Ca2+ sensors into the mitochondrial matrix. Cell Calcium. 2005;37:129–136. doi: 10.1016/j.ceca.2004.08.002. [DOI] [PubMed] [Google Scholar]
- Fox LE, Soll DR, Wu CF. Coordination and modulation of locomotion pattern generators in Drosophila larvae: effects of altered biogenic amine levels by the tyramine beta hydroxlyase mutation. J Neurosci. 2006;26:1486–1498. doi: 10.1523/JNEUROSCI.4749-05.2006. [DOI] [PMC free article] [PubMed] [Google Scholar]
- Friberg H, Connern C, Halestrap AP, Wieloch T. Differences in the activation of the mitochondrial permeability transition among brain regions in the rat correlate with selective vulnerability. J Neurochem. 1999;72:2488–2497. doi: 10.1046/j.1471-4159.1999.0722488.x. [DOI] [PubMed] [Google Scholar]
- García-Chacón LE, Nguyen KT, David G, Barrett EF. Extrusion of Ca2+ from mouse motor terminal mitochondria via a Na+-Ca2+ exchanger increases post-tetanic evoked release. J Physiol. 2006;574:663–675. doi: 10.1113/jphysiol.2006.110841. [DOI] [PMC free article] [PubMed] [Google Scholar]
- Gaspers LD, Thomas AP. Calcium-dependent activation of mitochondrial metabolism in mammalian cells. Methods. 2008;46:224–232. doi: 10.1016/j.ymeth.2008.09.012. [DOI] [PMC free article] [PubMed] [Google Scholar]
- Gotow T, Miyaguchi K, Hashimoto PH. Cytoplasmic architecture of the axon terminal: filamentous strands specifically associated with synaptic vesicles. Neuroscience. 1991;40:587–598. doi: 10.1016/0306-4522(91)90143-c. [DOI] [PubMed] [Google Scholar]
- Grynkiewicz G, Poenie M, Tsien RY. A new generation of Ca2+ indicators with greatly improved fluorescence properties. J Biol Chem. 1985;260:3440–3450. [PubMed] [Google Scholar]
- Guerini D, Coletto L, Carafoli E. Exporting calcium from cells. Cell Calcium. 2005;38:281–289. doi: 10.1016/j.ceca.2005.06.032. [DOI] [PubMed] [Google Scholar]
- Gunter TE, Sheu SS. Characteristics and possible functions of mitochondrial Ca2+ transport mechanisms. Biochim Biophys Acta. 2009;1787:1291–1308. doi: 10.1016/j.bbabio.2008.12.011. [DOI] [PMC free article] [PubMed] [Google Scholar]
- Gunter TE, Yule DI, Gunter KK, Eliseev RA, Salter JD. Calcium and mitochondria. FEBS Lett. 2004;567:96–102. doi: 10.1016/j.febslet.2004.03.071. [DOI] [PubMed] [Google Scholar]
- Guo X, Macleod GT, Wellington A, Hu F, Panchumarthi S, Schoenfield M, Marin L, Charlton MP, Atwood HL, Zinsmaier KE. The GTPase dMiro is required for axonal transport of mitochondria to Drosophila synapses. Neuron. 2005;47:379–393. doi: 10.1016/j.neuron.2005.06.027. [DOI] [PubMed] [Google Scholar]
- Hendel T, Mank M, Schnell B, Griesbeck O, Borst A, Reiff DF. Fluorescence changes of genetic calcium indicators and OGB-1 correlated with neural activity and calcium in vivo and in vitro. J Neurosci. 2008;28:7399–7411. doi: 10.1523/JNEUROSCI.1038-08.2008. [DOI] [PMC free article] [PubMed] [Google Scholar]
- He T, Singh V, Rumpal N, Lnenicka GA. Differences in Ca2+ regulation for high-output Is and low-output Ib motor terminals in Drosophila larvae. Neuroscience. 2009;159:1283–1291. doi: 10.1016/j.neuroscience.2009.01.074. [DOI] [PubMed] [Google Scholar]
- Hill CE. University of Toronto; 1996. Neuromuscular structure of the Drosophila mutant sluggish: fewer synaptic vesicles and more cisternal sacs. MS Thesis. [Google Scholar]
- Hoang B, Chiba A. Single-cell analysis of Drosophila larval neuromuscular synapses. Dev Biol. 2001;229:55–70. doi: 10.1006/dbio.2000.9983. [DOI] [PubMed] [Google Scholar]
- Jia XX, Gorczyca M, Budnik V. Ultrastructure of neuromuscular junctions in Drosophila: comparison of wild type and mutants with increased excitability. J Neurobiol. 1993;24:1025–1044. doi: 10.1002/neu.480240804. [DOI] [PMC free article] [PubMed] [Google Scholar]
- Jiang D, Zhao L, Clapham DE. Genome-wide RNAi screen identifies Letm1 as a mitochondrial Ca2+/H+ antiporter. Science. 2009;326:144–147. doi: 10.1126/science.1175145. [DOI] [PMC free article] [PubMed] [Google Scholar]
- Johansen J, Halpern ME, Johansen KM, Keshishian H. Stereotypic morphology of glutamatergic synapses on identified muscle cells of Drosophila larvae. J Neurosci. 1989;9:710–725. doi: 10.1523/JNEUROSCI.09-02-00710.1989. [DOI] [PMC free article] [PubMed] [Google Scholar]
- Kann O, Kovács R. Mitochondria and neuronal activity. Am J Physiol Cell Physiol. 2007;292:C641–657. doi: 10.1152/ajpcell.00222.2006. [DOI] [PubMed] [Google Scholar]
- Karunanithi S, Georgiou J, Charlton MP, Atwood HL. Imaging of calcium in Drosophila larval motor nerve terminals. J Neurophysiol. 1997;78:3465–3467. doi: 10.1152/jn.1997.78.6.3465. [DOI] [PubMed] [Google Scholar]
- Karunanithi S, Marin L, Wong K, Atwood HL. Quantal size and variation determined by vesicle size in normal and mutant Drosophila glutamatergic synapses. J Neurosci. 2002;22:10267–10276. doi: 10.1523/JNEUROSCI.22-23-10267.2002. [DOI] [PMC free article] [PubMed] [Google Scholar]
- Kennedy D, Takeda K. Reflex control of abdominal flexor muscles in crayfish. II. The tonic system. J Exp Biol. 1965;43:229–246. [Google Scholar]
- Kim MH, Korogod N, Schneggenburger R, Ho WK, Lee SH. Interplay between Na+/Ca2+ exchangers and mitochondria in Ca2+ clearance at the calyx of Held. J Neurosci. 2005;25:6057–6065. doi: 10.1523/JNEUROSCI.0454-05.2005. [DOI] [PMC free article] [PubMed] [Google Scholar]
- King MJ, Atwood HL, Govind CK. Structural features of crayfish phasic and tonic neuromuscular terminals. J Comp Neurol. 1996;372:618–626. doi: 10.1002/(SICI)1096-9861(19960902)372:4<618::AID-CNE9>3.0.CO;2-7. [DOI] [PubMed] [Google Scholar]
- Kirichok Y, Krapivinsky G, Clapham DE. The mitochondrial calcium uniporter is a highly selective ion channel. Nature. 2004;427:360–364. doi: 10.1038/nature02246. [DOI] [PubMed] [Google Scholar]
- Klose MK, Chu D, Xiao C, Seroude L, Robertson RM. Heat shock-mediated thermoprotection of larval locomotion compromised by ubiquitous overexpression of Hsp70 in Drosophila melanogaster. J Neurophysiol. 2005;94:3563–3572. doi: 10.1152/jn.00723.2005. [DOI] [PubMed] [Google Scholar]
- Kurdyak P, Atwood HL, Stewart BA, Wu CF. Differential physiology and morphology of motor axons to ventral longitudinal muscles in larval Drosophila. J Comp Neurol. 1994;350:463–472. doi: 10.1002/cne.903500310. [DOI] [PubMed] [Google Scholar]
- Kuromi H, Kidokoro Y. Selective replenishment of two vesicle pools depends on the source of Ca2+ at the Drosophila synapse. Neuron. 2002;35:333–343. doi: 10.1016/s0896-6273(02)00777-8. [DOI] [PubMed] [Google Scholar]
- Lai JC, Walsh JM, Dennis SC, Clark JB. Synaptic and non-synaptic mitochondria from rat brain: isolation and characterization. J Neurochem. 1977;28:625–631. doi: 10.1111/j.1471-4159.1977.tb10434.x. [DOI] [PubMed] [Google Scholar]
- Lai JC, Leung TK, Lim L. Heterogeneity of monoamine oxidase activities in synaptic and non-synaptic mitochondria derived from three brain regions: some functional implications. Metab Brain Dis. 1994;9:53–66. doi: 10.1007/BF01996074. [DOI] [PubMed] [Google Scholar]
- Lee SH, Kim MH, Lee JY, Lee SH, Lee D, Park KH, Ho WK. Na+/Ca2+ exchange and Ca2+ homeostasis in axon terminals of mammalian central neurons. Ann N Y Acad Sci. 2007;1099:396–412. doi: 10.1196/annals.1387.011. [DOI] [PubMed] [Google Scholar]
- Lnenicka GA, Keshishian H. Identified motor terminals in Drosophila larvae show distinct differences in morphology and physiology. J Neurobiol. 2000;43:186–197. [PubMed] [Google Scholar]
- Lnenicka GA, Grizzaffi J, Lee B, Rumpal N. Ca2+ dynamics along identified synaptic terminals in Drosophila larvae. J Neurosci. 2006;26:12283–12293. doi: 10.1523/JNEUROSCI.2665-06.2006. [DOI] [PMC free article] [PubMed] [Google Scholar]
- Lytton J. Na+/Ca2+ exchangers: three mammalian gene families control Ca2+ transport. Biochem J. 2007;406:365–382. doi: 10.1042/BJ20070619. [DOI] [PubMed] [Google Scholar]
- Macleod GT, Hegström-Wojtowicz M, Charlton MP, Atwood HL. Fast calcium signals in Drosophila motor neuron terminals. J Neurophysiol. 2002;88:2659–2663. doi: 10.1152/jn.00515.2002. [DOI] [PubMed] [Google Scholar]
- Macleod GT, Marin L, Charlton MP, Atwood HL. Synaptic vesicles: test for a role in presynaptic calcium regulation. J Neurosci. 2004;24:2496–2505. doi: 10.1523/JNEUROSCI.5372-03.2004. [DOI] [PMC free article] [PubMed] [Google Scholar]
- Mank M, Reiff DF, Heim N, Friedrich MW, Borst A, Griesbeck O. A FRET-based calcium biosensor with fast signal kinetics and high fluorescence change. Biophys J. 2006;90:1790–1796. doi: 10.1529/biophysj.105.073536. [DOI] [PMC free article] [PubMed] [Google Scholar]
- McCormack JG, Halestrap AP, Denton RM. Role of calcium ions in regulation of mammalian intra-mitochondrial metabolism. Physiol Rev. 1990;70:391–425. doi: 10.1152/physrev.1990.70.2.391. [DOI] [PubMed] [Google Scholar]
- Meinertzhagen IA, Govind CK, Stewart BA, Carter JM, Atwood HL. Regulated spacing of synapses and presynaptic active zones at larval neuromuscular junctions in different genotypes of the flies Drosophila and Sarcophaga. J Comp Neurol. 1998;393:482–492. doi: 10.1002/(sici)1096-9861(19980420)393:4<482::aid-cne7>3.0.co;2-x. [DOI] [PubMed] [Google Scholar]
- Miyawaki A, Llopis J, Heim R, McCaffery JM, Adams JA, Ikura M, Tsien RY. Fluorescent indicators for Ca2+ based on green fluorescent proteins and calmodulin. Nature. 1997;388:882–887. doi: 10.1038/42264. [DOI] [PubMed] [Google Scholar]
- Msghina M, Millar AG, Charlton MP, Govind CK, Atwood HL. Calcium entry related to active zones and differences in transmitter release at phasic and tonic synapses. J Neurosci. 1999;19:8419–8434. doi: 10.1523/JNEUROSCI.19-19-08419.1999. [DOI] [PMC free article] [PubMed] [Google Scholar]
- Nagai T, Sawano A, Park ES, Miyawaki A. Circularly permuted green fluorescent proteins engineered to sense Ca2+ Proc Natl Acad Sci U S A. 2001;98:3197–3202. doi: 10.1073/pnas.051636098. [DOI] [PMC free article] [PubMed] [Google Scholar]
- Narita K, Akita T, Osanai M, Shirasaki T, Kijima H, Kuba K. A Ca2+-induced Ca2+ release mechanism involved in asynchronous exocytosis at frog motor nerve terminals. J Gen Physiol. 1998;112:593–609. doi: 10.1085/jgp.112.5.593. [DOI] [PMC free article] [PubMed] [Google Scholar]
- Núñez L, Senovilla L, Sanz-Blasco S, Chamero P, Alonso MT, Villalobos C, García-Sancho J. Bioluminescence imaging of mitochondrial Ca2+ dynamics in soma and neurites of individual adult mouse sympathetic neurons. J Physiol. 2007;580:385–395. doi: 10.1113/jphysiol.2006.126524. [DOI] [PMC free article] [PubMed] [Google Scholar]
- Pilling AD, Horiuchi D, Lively CM, Saxton WM. Kinesin-1 and Dynein are the primary motors for fast transport of mitochondria in Drosophila motor axons. Mol Biol Cell. 2006;17:2057–2068. doi: 10.1091/mbc.E05-06-0526. [DOI] [PMC free article] [PubMed] [Google Scholar]
- Pologruto TA, Yasuda R, Svoboda K. Monitoring neural activity and [Ca2+] with genetically encoded Ca2+ indicators. J Neurosci. 2004;24:9572–9579. doi: 10.1523/JNEUROSCI.2854-04.2004. [DOI] [PMC free article] [PubMed] [Google Scholar]
- Reiff DF, Thiel PR, Schuster CM. Differential regulation of active zone density during long-term strengthening of Drosophila neuromuscular junctions. J Neurosci. 2002;22:9399–9409. doi: 10.1523/JNEUROSCI.22-21-09399.2002. [DOI] [PMC free article] [PubMed] [Google Scholar]
- Reiff DF, Ihring A, Guerrero G, Isacoff EY, Joesch M, Nakai J, Borst A. In vivo performance of genetically encoded indicators of neural activity in flies. J Neurosci. 2005;25:4766–4778. doi: 10.1523/JNEUROSCI.4900-04.2005. [DOI] [PMC free article] [PubMed] [Google Scholar]
- Rizzuto R, Marchi S, Bonora M, Aguiari P, Bononi A, De Stefani D, Giorgi C, Leo S, Rimessi A, Siviero R, Zecchini E, Pinton P. Ca2+ transfer from the ER to mitochondria: when, how and why. Biochim Biophys Acta. 2009;1787:1342–1351. doi: 10.1016/j.bbabio.2009.03.015. [DOI] [PMC free article] [PubMed] [Google Scholar]
- Rossano AJ, Macleod GT. Loading Drosophila nerve terminals with calcium indicators. J Vis Exp. 2007;6:250. doi: 10.3791/250. [DOI] [PMC free article] [PubMed] [Google Scholar]
- Sanyal S, Consoulas C, Kuromi H, Basole A, Mukai L, Kidokoro Y, Krishnan KS, Ramaswami M. Analysis of conditional paralytic mutants in Drosophila sarco-endoplasmic reticulum calcium ATPase reveals novel mechanisms for regulating membrane excitability. Genetics. 2005;169:737–750. doi: 10.1534/genetics.104.031930. [DOI] [PMC free article] [PubMed] [Google Scholar]
- Scott ID, Nicholls DG. Energy transduction in intact synaptosomes. Influence of plasma-membrane depolarization on the respiration and membrane potential of internal mitochondria determined in situ. Biochem J. 1980;186:21–33. doi: 10.1042/bj1860021. [DOI] [PMC free article] [PubMed] [Google Scholar]
- Shakiryanova D, Klose MK, Zhou Y, Gu T, Deitcher DL, Atwood HL, Hewes RS, Levitan ES. Presynaptic ryanodine receptor-activated calmodulin kinase II increases vesicle mobility and potentiates neuropeptide release. J Neurosci. 2007;27:7799–7806. doi: 10.1523/JNEUROSCI.1879-07.2007. [DOI] [PMC free article] [PubMed] [Google Scholar]
- Snapp EL, Iida T, Frescas D, Lippincott-Schwartz J, Lilly MA. The fusome mediates intercellular endoplasmic reticulum connectivity in Drosophila ovarian cysts. Mol Biol Cell. 2004;15:4512–4521. doi: 10.1091/mbc.E04-06-0475. [DOI] [PMC free article] [PubMed] [Google Scholar]
- Sparagna GC, Gunter KK, Sheu SS, Gunter TE. Mitochondrial calcium uptake from physiological-type pulses of calcium. A description of the rapid uptake mode. J Biol Chem. 1995;270:27510–27515. doi: 10.1074/jbc.270.46.27510. [DOI] [PubMed] [Google Scholar]
- Suster ML, Karunanithi S, Atwood HL, Sokolowski MB. Turning behavior in Drosophila larvae: a role for the small scribbler transcript. Genes Brain Behav. 2004;3:273–286. doi: 10.1111/j.1601-183X.2004.00082.x. [DOI] [PubMed] [Google Scholar]
- Suzuki S, Osanai M, Mitsumoto N, Akita T, Narita K, Kijima H, Kuba K. Ca2+-dependent Ca2+ clearance via mitochondrial uptake and plasmalemmal extrusion in frog motor nerve terminals. J Neurophysiol. 2002;87:1816–1823. doi: 10.1152/jn.00456.2001. [DOI] [PubMed] [Google Scholar]
- Tang Y, Zucker RS. Mitochondrial involvement in post-tetanic potentiation of synaptic transmission. Neuron. 1997;18:483–491. doi: 10.1016/s0896-6273(00)81248-9. [DOI] [PubMed] [Google Scholar]
- Tank DW, Regehr WG, Delaney KR. A quantitative analysis of presynaptic calcium dynamics that contribute to short-term enhancement. J Neurosci. 1995;15:7940–7952. doi: 10.1523/JNEUROSCI.15-12-07940.1995. [DOI] [PMC free article] [PubMed] [Google Scholar]
- Thomas D, Tovey SC, Collins TJ, Bootman MD, Berridge MJ, Lipp P. A comparison of fluorescent Ca2+ indicator properties and their use in measuring elementary and global Ca2+ signals. Cell Calcium. 2000;28:213–223. doi: 10.1054/ceca.2000.0152. [DOI] [PubMed] [Google Scholar]
- Verstreken P, Ly CV, Venken KJ, Koh TW, Zhou Y, Bellen HJ. Synaptic mitochondria are critical for mobilization of reserve pool vesicles at Drosophila neuromuscular junctions. Neuron. 2005;47:365–378. doi: 10.1016/j.neuron.2005.06.018. [DOI] [PubMed] [Google Scholar]
- Wakefield S, Tear G. The Drosophila reticulon, Rtnl-1, has multiple differentially expressed isoforms that are associated with a sub-compartment of the endoplasmic reticulum. Cell Mol Life Sci. 2006;63:2027–2038. doi: 10.1007/s00018-006-6142-3. [DOI] [PMC free article] [PubMed] [Google Scholar]
- Wallace DJ, Meyer zum Alten Borgloh S, Astori S, Yang Y, Bausen M, Kügler S, Palmer AE, Tsien RY, Sprengel R, Kerr JN, Denk W, Hasan MT. Single-spike detection in vitro and in vivo with a genetic Ca2+ sensor. Nat Methods. 2008;5:797–804. doi: 10.1038/nmeth.1242. [DOI] [PubMed] [Google Scholar]
- Wang JW, Wong AM, Flores J, Vosshall LB, Axel R. Two-photon calcium imaging reveals an odor-evoked map of activity in the fly brain. Cell. 2003;112:271–282. doi: 10.1016/s0092-8674(03)00004-7. [DOI] [PubMed] [Google Scholar]
- Wang P, Saraswati S, Guan Z, Watkins CJ, Wurtman RJ, Littleton JT. A Drosophila temperature-sensitive seizure mutant in phosphoglycerate kinase disrupts ATP generation and alters synaptic function. J Neurosci. 2004;24:4518–4529. doi: 10.1523/JNEUROSCI.0542-04.2004. [DOI] [PMC free article] [PubMed] [Google Scholar]
- Wang W, Fang H, Groom L, Cheng A, Zhang W, Liu J, Wang X, Li K, Han P, Zheng M, Yin J, Wang W, Mattson MP, Kao JP, Lakatta EG, Sheu SS, Ouyang K, Chen J, Dirksen RT, Cheng H. Superoxide flashes in single mitochondria. Cell. 2008;134:279–290. doi: 10.1016/j.cell.2008.06.017. [DOI] [PMC free article] [PubMed] [Google Scholar]
- Zinsmaier KE, Hofbauer A, Heimbeck G, Pflugfelder GO, Buchner S, Buchner E. A cysteine-string protein is expressed in retina and brain of Drosophila. J Neurogenet. 1990;7:15–29. doi: 10.3109/01677069009084150. [DOI] [PubMed] [Google Scholar]