

Abstract
Chronic stress and persistently high glucocorticoid levels can induce brain atrophy. Corticotropin-releasing factor (CRF)-overexpressing (OE) mice are a genetic model of chronic stress with elevated brain CRF and plasma corticosterone levels and Cushing’s syndrome. The brain structural alterations in the CRF-OE mice, however, are not well known. We found that adult male and female CRF-OE mice had significantly lower whole brain and cerebellum weights than their wild type (WT) littermates (347.7 ± 3.6 vs. 460.1 ± 4.3 and 36.3 ± 0.8 vs. 50.0 ± 1.3 mg, respectively) without sex-related difference. The epididymal/parametrial fat mass was significantly higher in CRF-OE mice. The brain weight was inversely correlated to epididymal/parametrial fat weight, but not to body weight. Computerized image analysis system in Nissl stained brain sections of female mice showed that the anterior cingulate and sensorimotor cortexes of CRF-OE mice were significantly thinner, and the volumes of the hippocampus, hypothalamic paraventricular nucleus and amygdala were significantly reduced compared to WT, while the locus coeruleus showed a non-significant increase. Motor functions determined by beam crossing and gait analysis showed that CRF-OE mice took longer time and more steps to traverse a beam with more errors, and displayed reduced stride length compared to their WT littermates. These data show that CRF-OE mice display brain size reduction associated with alterations of motor coordination and an increase in visceral fat mass providing a novel animal model to study mechanisms involved in brain atrophy under conditions of sustained elevation of brain CRF and circulating glucocorticoid levels.
Keywords: Cushing’s syndrome, hippocampus, cortex, hypothalamic paraventricular nucleus, locus coeruleus, motor functions
Introduction
Chronic stress and/or prolonged elevation of glucocorticoid levels induce brain atrophy [1;2]. Most of the studies showed atrophy of neuronal dendrites in the hippocampus in experimental animals chronically stressed or treated with corticosterone [1;3;4]. Decreased hippocampus volume was also observed in patients with Cushing’s disease and post-traumatic stress disorder (PTSD) [1;2;5;6]. Animal models with sustained high levels of corticosterone will be valuable tools to study the underlying mechanism of stress-induced brain atrophy.
Corticotropin-releasing factor (CRF)-overexpressing (OE) mice have chronic overproduction of brain CRF accompanied by elevated plasma levels of corticosterone [7]. The phenotype of CRF-OE mice displays features similar to those seen in Cushing’s disease such as truncal obesity, peripheral (muscle and skin) atrophy and hair loss [7]. More importantly, the mice have learning impairment, increased anxiety-like behavior and are more sensitive to stress [8-11]. Therefore, CRF-OE mice provide a relevant experimental model to study the impact of chronic stress. We observed that CRF-OE mice have smaller brain mass than WT mice which prompted us to assess the weights of whole brain and cerebellum. Since there was no difference in brain weight between males and females and this study was aimed at first verifying brain atrophy in CRF-OE mice, subsequent studies to determine dimension of selective brain areas and motor functions were done in one sex, that is female mice only.
Materials and Methods
CRF-OE mice were bred by the animal core of the UCLA Center for Neurobiology of Stress (Dr. M. Fanselow, Department of Psychology) and some of the mice supplied by Dr. M. P. Stenzel-Poore. The colony was originally generated by Dr. Stenzel-Poore as described previously [7]. Adult male and female CRF-OE mice and wild type (WT) littermates (age 3-6 months) were group housed (n=4/cage) with free access to water and standard rodent chow (Prolab RMH 2500, 5P14, LabDiet, St. Louis, MO) and maintained under controlled conditions of temperature (20-23 °C), humidity and lighting with a 12 h light/dark cycle (06:00–18:00 h). Experiments were performed during the light phase between 09:00 and 12:00 h. Animal care was conducted in accordance with the United States Public Health Service Guide for the Care and Use of Laboratory Animals. The procedures were approved by the Animal Research Committee at VA Greater Los Angeles Healthcare System (# 04012-06).
Male and female CRF-OE and WT littermate mice were deeply anesthetized with sodium pentobarbital (Nembutal, 100mg/kg intraperitoneally; Abbott Lab., Chicago, IL). Brains were removed and wet weight measured. Brains of female CRF-OE and WT littermate mice (n=5/group) were fixed in 10% phosphate buffered formalin and processed similarly as described previously [12]. Every third cryostat cut section (40 μm) was Nissl-stained and mounted onto glass slides. Brain areas investigated were cortex, dorsal hippocampus, amygdala, paraventricular nucleus of the hypothalamus (PVN) and locus coeruleus (LC) identified according to Franklin and Paxinos’ mouse brain atlas (coordinates given in mm from bregma) [13] and analyzed using NIH Image J version 1.42. For measurements of the neocortex (sensorimotor) and anterior cingulate cortex, photographs were taken from the left hemisphere of three representative areas/animal (0.62-0.26 mm) and the cortex thickness (mm) was assessed using Image J. The volumes of amygdala (−1.22 to −1.7 mm) and dorsal hippocampus (−1.34 to −1.82 mm) from 5-6 consecutive sections of each mouse were computed. Similarly, 3-4 consecutive sections were chosen for the LC (−5.34 to −5.68 mm) and bilateral PVN (−0.58 to −0.94 mm), respectively, depicting the nuclei at their greatest dimension. Brain areas were measured in mm2, averaged, and corresponding volumes (mm3) were calculated according to V = ΣA x T where ΣA is the sum of area measurements and T is the intersection distance 40 μm × 3 (for every third section) [12].
Behavioral studies to assess motor performance and coordination were conducted using challenging beam traversal and gait analysis respectively as detailed before [14]. Female CRF-OE (n=8-10) and WT mice (n=12) were trained for 2 days prior to experiments. Mice were videotaped while traversing a grid-surfaced beam 5 times on the same day. Videotapes were assessed in slow motion for errors, number of steps, and time to traverse across the 5 trials. An error was counted when a limb slipped through the grid during a forward movement entailing in a maximum of four errors/step. The mean of 5 trials for error/step, time to traverse, and number of steps was calculated for each animal. For gait analysis, stride length was determined by measuring the distance between paw prints [14]. Only strides made during continuous walking were included in the analysis. The maximum stride difference was calculated by subtracting the shortest from the longest stride length. Stride width was calculated by measuring the distance between hind limbs.
Data are expressed as mean±SEM. Data were analyzed by one-way ANOVA, and data from both sexes and genotypes by two-way ANOVA, followed by Tukey post hoc tests. P<0.05 was considered significant.
Body weights were significantly different between male and female WT littermates at age 3-6 months (31.6 ± 0.8 and 23.5 ± 0.4 g, respectively, n=12 and 14/group, p<0.05), while not significant between male and female CRF-OE mice (32.2 ± 0.7 and 32.3 ± 0.7 g, respectively, n=14/group, p>0.05). There was also a significant body weight difference between female WT and CRF-OE mice (p<0.05). Differences in body weights were interacted both by sex and genotype (F1,58=45.16, p<0.001). Epididymal fat in male and parametrial fat in female CRF-OE mice was significantly heavier compared to male and female WT mice respectively (epididymal fat: 1.45 ± 0.06 vs. 0.77 ± 0.09 g, n=5/group; p<0.05; parametrial fat: 1.21 ± 1.0 vs. 0.29 ± 0.5 g, n=8/group; p<0.05). There was a significant difference between male and female WT but not between male and female CRF-OE mice (sex x genotype: F1,22=2.14, p>0.05).
CRF-OE mice showed macroscopic signs of brain atrophy compared to their WT littermates (Fig. 1). Weights of whole brain and cerebellum were both significantly reduced in male and female CRF-OE mice compared to littermates (Fig. 1). There was no difference between males and females of either genotype (Fig. 1) as well as no sex x genotype-dependent difference (F1,59=2.00, p>0.05), regardless of the fact that female WT mice had lower body weights. When data from male and female mice were pooled, CRF-OE mice had significantly lower whole brain (347.7 ± 3.6 vs. 460.1 ± 4.3 mg) and cerebellum weight (36.3 ± 0.8 vs. 50.0 ± 1.3 mg) than their WT littermates. Brain weights were inversely correlated to epididymal or parametrial fat weights in males and females (r2=0.81 and r2=0.78, p<0.001, respectively), while there was no correlation between body and brain weights (r2=0.0002; p>0.05). Based on these data, we assessed the size of some selective brain areas as well as motor functions in female mice.
Fig. 1.
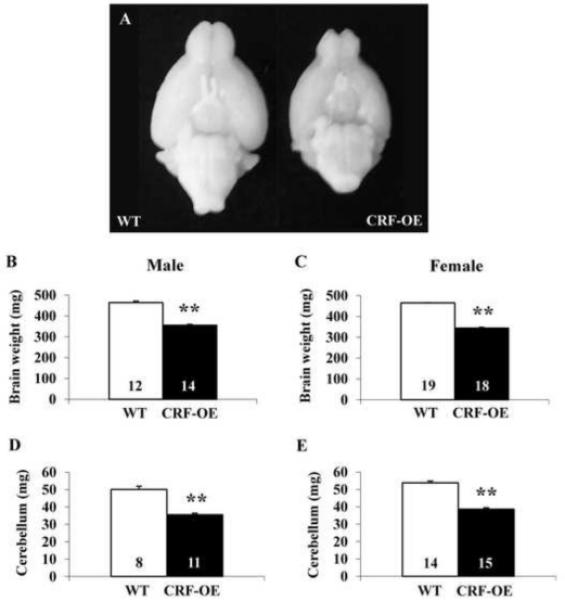
Brain size difference (A) and weight (B-E) of WT and CRF-OE mice. Bars represent mean ± SEM of number indicated at the bottom. **p<0.001 vs. WT.
At the microscopic level, female CRF-OE mice showed a significant 14% and 24% reduction in thickness of the sensorimotor cortex (1.15 ± 0.02 vs. WT 1.34 ± 0.04 mm; Fig. 2A-C) and cingulate cortex (0.57 ± 0.01 vs. WT 0.75 ± 0.01 mm; Fig. 2A-C), respectively. The PVN and amygdala both had a significant 11% reduced volume in CRF-OE mice (PVN: 119.69 ± 3.53 vs. WT 134.35 ± 6.06 μm3; Fig. 2D-F and amygdala: 1617.78 ± 54.70 vs. WT 1813.03 ± 54.70 μm3). The dorsal hippocampus volume was reduced by 23% (1519.87 ± 96.34 vs. WT 1974.79 ± 58.1 μm3, p<0.05) whereas the volume of the LC was enlarged by 9% although it did not reach statistical significance (41.47 ± 1.83 vs. WT 38.0 ± 2.34 μm3). Of note, the volumes of the measured brain structures were not the absolute whole volume, but selected segments for comparison between genotypes.
Fig. 2.
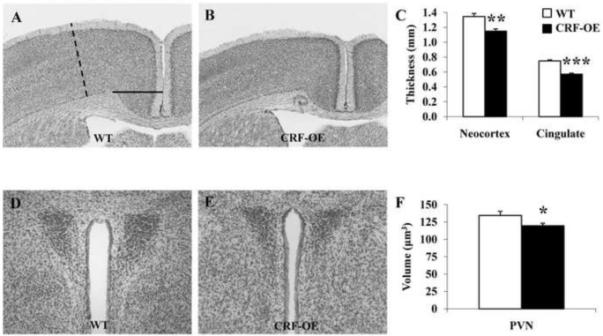
Size of representative brain areas in female CRF-OE and WT mice (n=5/group) in Nissl stained sections. Brain structure size was evaluated using NIH image J version 1.42. Neocortex (dashed line) and cingulate cortex (full line, A) as well as the paraventricular nucleus of the hypothalamus (D) were significantly smaller in CRF-OE (B, E) compared to WT littermates (A, C, D, F). * p<0.05; ** p<0.01 and *** p<0.001 vs. WT.
In the motor tests, female CRF-OE mice took longer time to traverse the beam, made more steps and more errors per step (Fig. 3A-C) compared to WT littermates. Moreover, CRF-OE mice displayed a reduced stride length compared with WT mice (Fig. 3D) whereas maximum stride difference and stride width were unaltered (Fig. 3E-F).
Fig. 3.
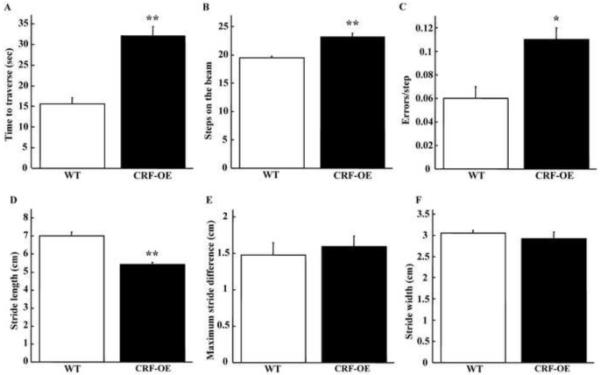
Motor performance and gait analysis in female CRF-OE mice (n=8-10) and WT littermates (n=12). CRF-OE mice showed a significantly longer time to traverse the beam (A), significantly more steps on the beam (B) and made significantly more errors/step (C). Stride length in CRF-OE was significantly smaller compared to WT (D) whereas the maximum stride difference (E) and width (F) were not changed * p<0.05 and ** p<0.01 vs. WT.
Discussion
In the present study we show that adult male and female CRF-OE mice have brain atrophy shown by the significant reduction in brain wet weight irrespective of sex. Selective brain area measurements indicate that CRF-OE mice display reduced size of the cerebral cortex, dorsal hippocampus, amygdala and PVN, while the LC shows a non-significant increase. This study also revealed that CRF-OE mice have motor deficits in addition to previously reported learning impairment, reduced attention, anxiety behavior and altered feeding response to a fast [8;9;15;16].
The hippocampus is the most studied brain structure showing neuronal degeneration associated to stress and high glucocorticoid levels [4], followed by the prefrontal cortex as observed in Cushing’s disease, major depression and PTSD [1;17;18]. Smaller amygdaloid nucleus [19] and an overall brain atrophy were also reported by magnetic resonance imaging in Cushing’s patients [5;17]. Another clinical study showed that the reduced volume of the cingulate gyrus correlated to an increase in plasma adrenocorticotropic hormone levels in humans [20]. In this study, we demonstrated that CRF-OE mice had thinner sensorimotor cortex, and smaller cerebellum and PVN, beside the structures mentioned above. As the weight reductions of whole brain and cerebellum reached 24.4% and 27.4% respectively, it is likely that brain atrophy may be more extensive. However, it seems to be region-specific as there was no significant change in the LC size. The reduced volumes in cingulate cortex, amygdala and PVN could be involved in anxiety and autonomic functional alterations [9;15;21].
The atrophy in the sensorimotor cortex and cerebellum could be closely associated to the impaired motor functions shown by prolonged time in beam traversal and reduced stride length. It has been shown that damage to either of these regions is associated with poor performance on beam tasks and alterations in gait [22;23]. Particularly, the striking size reduction of the cerebellum in CRF-OE mice may be the key factor. In humans and mice, cerebellar atrophy is associated with significant gait abnormalities including altered stride length, stance times, and coordination [24;25]. CRF is located in afferent fibers in the cerebellum including climbing fibers to Purkinje cells [26]. Constant exposure of Purkinje cells to CRF reduces dendritic outgrowth [27]. Thus, CRF may play a role in cerebellar atrophy that impairs motor coordination. Furthermore, chronic exposure to CRF is known to alter the dopaminergic systems including pathways involved in movement [28]. Our data have added new evidence that brain atrophy could cause motor dysfunction which is supported by a recent report that patients with type 2 diabetes who develop whole brain atrophy have motor disorders [29]. However, it is possible that in addition to central abnormalities peripheral alterations may also contribute to the observed motor deficits. Indeed, it is known that patients with Cushing’s syndrome develop muscle weakness and fatigue.
Chronic excess of glucocorticoids is associated with brain atrophy [4;30;31]. The hippocampus is one of the brain structures with high density of glucocorticoid receptors (GR) [32;33], which could render it more responsive to high glucocorticoid-triggered signaling processing in neurons. However, a direct corticosterone-mediated neurodegeneration is still controversial [4;30;31]. It may be related, at least partially, to the differential activation of glucocorticoid receptors type I (mineralocorticoid, MR) and II (GR) which mediate protective and damaging effects, respectively [4;30]. GR is extensively detected throughout the rodent brain [32;33], whereas not all areas with abundant GR develop atrophy in relation to elevated corticosterone levels. For instance, in this study the LC size in CRF-OE mice with sustained higher corticosterone levels is slightly increased. Some studies revealed a stress-associated increase in dendritic arborization of the amygdala while at the same time it was decreased in the hippocampus [1;34]. These data suggest that stress- and high corticosterone levels-induced changes of neuronal morphology are region-specific and result from differential processing of stress responses.
CRF has been reported to exert either degenerative or trophic effects on neuronal growth and synaptic spines [35-39], which could be target-specific or related to the amount of CRF and duration of exposure [37]. The enhanced activity of brain CRF signaling may modulate brain neuronal networks to change the process of neurogenesis. Microarray analysis of brain gene profiles of CRF-OE mice showed alterations in expression of genes involved in glucocorticoid signaling and cell proliferation [40]. CRF receptor-1 (CRF1) is recruited in the neurodegeneration induced by chronic stress and CRF as blockade of the CRF1 in mice reverses stress-induced suppression of neurogenesis [41] and CRF-induced loss of dendritic spines in hippocampus slices [38]. By contrast, CRF was also shown to increase dendritic growth in organotypic slice cultures of rat LC and LC-like CATH cells [42;43], which may have bearing in the small increase of LC volume in CRF-OE mice. CRF-OE mice provide a tool to study the action of overexpression of CRF in vivo in neuron degeneration and/or regeneration.
We found an inverse correlation between increased visceral fat and decreased brain weights. The increased mass of adipose tissue that releases inflammatory cytokines could have some impact to facilitate brain atrophy and studies have shown brain atrophy in obese humans and patients with type 2 diabetes [29;44]. Further studies on the relationship between visceral fat signals and related alterations of energy regulatory hormones to brain atrophy will help to understand the underlying mechanisms of obesity-associated neurodegeneration.
No sex difference was found in brain weights of both normal (WT) and atrophied (CRF-OE) brains. To our knowledge, there is no report on sex differences in the size reduction of the brain areas showing atrophy associated to stress and/or elevated glucocorticoid level. However, one study demonstrated that female mice have atrophied basal dendrites while males display atrophied apical dendrites in the hippocampus induced by chronic stress [3]. Additional studies are required on more selective brain areas and neuronal profiles to assess whether sex differences do exist in the brain of CRF-OE mice.
In summary, this is a seminal study that demonstrated that CRF-OE mice developed brain atrophy, irrespective of sex, affecting cortical, limbic and hypothalamic areas while sparing the locus coeruleus. The marked atrophy of the cerebellum may be a factor in the impaired coordination of motor function observed in CRF-OE mice. CRF-OE mice may provide a model to dissect the factors involved in the development of brain atrophy in relation to high levels of brain CRF and plasma corticosterone, as well as visceral obesity state.
Acknowledgments
We thank Drs. Michael Fanselow (Department of Psychology, UCLA, Los Angeles, CA) and Mary P. Stenzel-Poore (Vollum Institute, OR) for the generous supply of CRF-OE mice and wild type littermates. We are grateful to Mrs. Honghui Liang for her excellent technical support and thank Ms. Eugenia Hu for reviewing the manuscript. This work was supported by German Research Foundation grants GO 1718/1-1 (M.G.) and STE 1765/1-1 (A.S.), NIHDK 33061 (Y.T.), NIHDK AT002681 and NIHDK-41301 (Animal Core, YT, MM).
Footnotes
Publisher's Disclaimer: This is a PDF file of an unedited manuscript that has been accepted for publication. As a service to our customers we are providing this early version of the manuscript. The manuscript will undergo copyediting, typesetting, and review of the resulting proof before it is published in its final citable form. Please note that during the production process errors may be discovered which could affect the content, and all legal disclaimers that apply to the journal pertain.
References
- [1].Bremner JD. Stress and brain atroph. CNS. Neurol. Disord. Drug Targets. 2006;5:503–512. doi: 10.2174/187152706778559309. [DOI] [PMC free article] [PubMed] [Google Scholar]
- [2].McEwen BS. Possible mechanisms for atrophy of the human hippocampus. Mol. Psychiatry. 1997;2:255–262. doi: 10.1038/sj.mp.4000254. [DOI] [PubMed] [Google Scholar]
- [3].Galea LA, McEwen BS, Tanapat P, Deak T, Spencer RL, Dhabhar FS. Sex differences in dendritic atrophy of CA3 pyramidal neurons in response to chronic restraint stress. Neuroscience. 1997;81:689–697. doi: 10.1016/s0306-4522(97)00233-9. [DOI] [PubMed] [Google Scholar]
- [4].Sousa N, Cerqueira JJ, Almeida OF. Corticosteroid receptors and neuroplasticity. Brain Res. Rev. 2008;57:561–570. doi: 10.1016/j.brainresrev.2007.06.007. [DOI] [PubMed] [Google Scholar]
- [5].Simmons NE, Do HM, Lipper MH, Laws ER., Jr. Cerebral atrophy in Cushing’s disease. Surg. Neurol. 2000;53:72–76. doi: 10.1016/s0090-3019(99)00197-4. [DOI] [PubMed] [Google Scholar]
- [6].Starkman MN, Giordani B, Gebarski SS, Berent S, Schork MA, Schteingart DE. Decrease in cortisol reverses human hippocampal atrophy following treatment of Cushing’s disease. Biol. Psychiatry. 1999;46:1595–1602. doi: 10.1016/s0006-3223(99)00203-6. [DOI] [PubMed] [Google Scholar]
- [7].Stenzel-Poore MP, Cameron VA, Vaughan J, Sawchenko PE, Vale W. Development of Cushing’s syndrome in corticotropin-releasing factor transgenic mice. Endocrinology. 1992;130:3378–3386. doi: 10.1210/endo.130.6.1597149. [DOI] [PubMed] [Google Scholar]
- [8].Heinrichs SC, Stenzel-Poore MP, Gold LH, Battenberg E, Bloom FE, Koob GF, Vale WW, Pich EM. Learning impairment in transgenic mice with central overexpression of corticotropin-releasing factor. Neuroscience. 1996;74:303–311. doi: 10.1016/0306-4522(96)00140-6. [DOI] [PubMed] [Google Scholar]
- [9].van Gaalen MM, Stenzel-Poore MP, Holsboer F, Steckler T. Effects of transgenic overproduction of CRH on anxiety-like behaviour. Eur. J. Neurosci. 2002;15:2007–2015. doi: 10.1046/j.1460-9568.2002.02040.x. [DOI] [PubMed] [Google Scholar]
- [10].Dirks A, Groenink L, Bouwknecht JA, Hijzen TH, Van Der GJ, Ronken E, Verbeek JS, Veening JG, Dederen PJ, Korosi A, Schoolderman LF, Roubos EW, Olivier B. Overexpression of corticotropin-releasing hormone in transgenic mice and chronic stress-like autonomic and physiological alterations. Eur. J. Neurosci. 2002;16:1751–1760. doi: 10.1046/j.1460-9568.2002.02245.x. [DOI] [PubMed] [Google Scholar]
- [11].Million M, Wang L, Stenzel-Poore MP, Coste SC, Yuan PQ, Lamy C, Rivier J, Buffington T, Tache Y. Enhanced pelvic responses to stressors in female CRF-overexpressing mice. Am. J. Physiol Regul. Integr. Comp Physiol. 2007;292:R1429–R1438. doi: 10.1152/ajpregu.00626.2006. [DOI] [PMC free article] [PubMed] [Google Scholar]
- [12].Heine VM, Maslam S, Zareno J, Joels M, Lucassen PJ. Suppressed proliferation and apoptotic changes in the rat dentate gyrus after acute and chronic stress are reversible. Eur. J. Neurosci. 2004;19:131–144. doi: 10.1046/j.1460-9568.2003.03100.x. [DOI] [PubMed] [Google Scholar]
- [13].Franklin KBJ, Paxinos G. The Mouse Brain in Sterostaxic Coordinates. Academic Press, Inc.; San Diego: 1997. [Google Scholar]
- [14].Fleming SM, Salcedo J, Fernagut PO, Rockenstein E, Masliah E, Levine MS, Chesselet MF. Early and progressive sensorimotor anomalies in mice overexpressing wild-type human alpha-synuclein. J. Neurosci. 2004;24:9434–9440. doi: 10.1523/JNEUROSCI.3080-04.2004. [DOI] [PMC free article] [PubMed] [Google Scholar]
- [15].van Gaalen MM, Stenzel-Poore M, Holsboer F, Steckler T. Reduced attention in mice overproducing corticotropin-releasing hormone. Behav. Brain Res. 2003;142:69–79. doi: 10.1016/s0166-4328(02)00381-9. [DOI] [PubMed] [Google Scholar]
- [16].Stengel A, Goebel M, Million M, Stenzel-Poore MP, Kobelt P, Monnikes H, Tache Y, Wang L. Corticotropin-releasing factor-overexpressing mice exhibit reduced neuronal activation in the arcuate nucleus and food intake in response to fasting. Endocrinology. 2009;150:153–160. doi: 10.1210/en.2008-0723. [DOI] [PMC free article] [PubMed] [Google Scholar]
- [17].Patil CG, Lad SP, Katznelson L, Laws ER., Jr. Brain atrophy and cognitive deficits in Cushing’s disease. Neurosurg. Focus. 2007;23:E11. doi: 10.3171/foc.2007.23.3.13. [DOI] [PubMed] [Google Scholar]
- [18].Brown ES, Varghese FP, McEwen BS. Association of depression with medical illness: does cortisol play a role? Biol. Psychiatry. 2004;55:1–9. doi: 10.1016/s0006-3223(03)00473-6. [DOI] [PubMed] [Google Scholar]
- [19].Merke DP, Giedd JN, Keil MF, Mehlinger SL, Wiggs EA, Holzer S, Rawson E, Vaituzis AC, Stratakis CA, Chrousos GP. Children experience cognitive decline despite reversal of brain atrophy one year after resolution of Cushing syndrome. J Clin. Endocrinol. Metab. 2005;90:2531–2536. doi: 10.1210/jc.2004-2488. [DOI] [PubMed] [Google Scholar]
- [20].Wolf OT, Convit A, de Leon MJ, Caraos C, Qadri SF. Basal hypothalamo-pituitary-adrenal axis activity and corticotropin feedback in young and older men: relationships to magnetic resonance imaging-derived hippocampus and cingulate gyrus volumes. Neuroendocrinology. 2002;75:241–249. doi: 10.1159/000054715. [DOI] [PubMed] [Google Scholar]
- [21].Stenzel-Poore MP, Heinrichs SC, Rivest S, Koob GF, Vale WW. Overproduction of corticotropin-releasing factor in transgenic mice: a genetic model of anxiogenic behavior. J Neurosci. 1994;14:2579–2584. doi: 10.1523/JNEUROSCI.14-05-02579.1994. [DOI] [PMC free article] [PubMed] [Google Scholar]
- [22].Goldstein LB, Davis JN. Beam-walking in rats: studies towards developing an animal model of functional recovery after brain injury. J. Neurosci. Methods. 1990;31:101–107. doi: 10.1016/0165-0270(90)90154-8. [DOI] [PubMed] [Google Scholar]
- [23].Ferdinandusse S, Zomer AW, Komen JC, van den Brink CE, Thanos M, Hamers FP, Wanders RJ, van der Saag PT, Poll-The BT, Brites P. Ataxia with loss of Purkinje cells in a mouse model for Refsum disease. Proc. Natl. Acad. Sci. U. S. A. 2008;105:17712–17717. doi: 10.1073/pnas.0806066105. [DOI] [PMC free article] [PubMed] [Google Scholar]
- [24].Mascalchi M. Spinocerebellar ataxias. Neurol. Sci. 2008;29(Suppl 3):311–313. doi: 10.1007/s10072-008-1005-3. [DOI] [PubMed] [Google Scholar]
- [25].He Y, Zu T, Benzow KA, Orr HT, Clark HB, Koob MD. Targeted deletion of a single Sca8 ataxia locus allele in mice causes abnormal gait, progressive loss of motor coordination, and Purkinje cell dendritic deficits. J. Neurosci. 2006;26:9975–9982. doi: 10.1523/JNEUROSCI.2595-06.2006. [DOI] [PMC free article] [PubMed] [Google Scholar]
- [26].Ito M. Functional roles of neuropeptides in cerebellar circuits. Neuroscience. 2009;162:666–672. doi: 10.1016/j.neuroscience.2009.01.019. [DOI] [PubMed] [Google Scholar]
- [27].Swinny JD, Metzger F, IJkema-Paassen J, Gounko NV, Gramsbergen A, Van Der Want JJ. Corticotropin-releasing factor and urocortin differentially modulate rat Purkinje cell dendritic outgrowth and differentiation in vitro. Eur. J. Neurosci. 2004;19:1749–1758. doi: 10.1111/j.1460-9568.2004.03279.x. [DOI] [PubMed] [Google Scholar]
- [28].Izzo E, Sanna PP, Koob GF. Impairment of dopaminergic system function after chronic treatment with corticotropin-releasing factor. Pharmacol. Biochem. Behav. 2005;81:701–708. doi: 10.1016/j.pbb.2005.04.017. [DOI] [PubMed] [Google Scholar]
- [29].Kumar R, Anstey KJ, Cherbuin N, Wen W, Sachdev PS. Association of type 2 diabetes with depression, brain atrophy, and reduced fine motor speed in a 60- to 64-year-old community sample. Am. J. Geriatr. Psychiatry. 2008;16:989–998. doi: 10.1097/JGP.0b013e31818b40fc. [DOI] [PubMed] [Google Scholar]
- [30].McEwen BS. Corticosteroids and hippocampal plasticity. Ann. N. Y. Acad. Sci. 1994;746:134–142. doi: 10.1111/j.1749-6632.1994.tb39223.x. [DOI] [PubMed] [Google Scholar]
- [31].Sapolsky RM. Glucocorticoids, stress, and their adverse neurological effects: relevance to aging. Exp. Gerontol. 1999;34:721–732. doi: 10.1016/s0531-5565(99)00047-9. [DOI] [PubMed] [Google Scholar]
- [32].Cintra A, Zoli M, Rosen L, Agnati LF, Okret S, Wikstrom AC, Gustaffsson JA, Fuxe K. Mapping and computer assisted morphometry and microdensitometry of glucocorticoid receptor immunoreactive neurons and glial cells in the rat central nervous system. Neuroscience. 1994;62:843–897. doi: 10.1016/0306-4522(94)90481-2. [DOI] [PubMed] [Google Scholar]
- [33].Usuku T, Nishi M, Morimoto M, Brewer JA, Muglia LJ, Sugimoto T, Kawata M. Visualization of glucocorticoid receptor in the brain of green fluorescent protein-glucocorticoid receptor knockin mice. Neuroscience. 2005;135:1119–1128. doi: 10.1016/j.neuroscience.2005.06.071. [DOI] [PubMed] [Google Scholar]
- [34].Vyas A, Mitra R, Shankaranarayana Rao BS, Chattarji S. Chronic stress induces contrasting patterns of dendritic remodeling in hippocampal and amygdaloid neurons. J. Neurosci. 2002;22:6810–6818. doi: 10.1523/JNEUROSCI.22-15-06810.2002. [DOI] [PMC free article] [PubMed] [Google Scholar]
- [35].Bao AM, Meynen G, Swaab DF. The stress system in depression and neurodegeneration: focus on the human hypothalamus. Brain Res. Rev. 2008;57:531–553. doi: 10.1016/j.brainresrev.2007.04.005. [DOI] [PubMed] [Google Scholar]
- [36].Pedersen WA, McCullers D, Culmsee C, Haughey NJ, Herman JP, Mattson MP. Corticotropin-releasing hormone protects neurons against insults relevant to the pathogenesis of Alzheimer’s disease. Neurobiol. Dis. 2001;8:492–503. doi: 10.1006/nbdi.2001.0395. [DOI] [PubMed] [Google Scholar]
- [37].Fenoglio KA, Brunson KL, Baram TZ. Hippocampal neuroplasticity induced by early-life stress: functional and molecular aspects. Front Neuroendocrinol. 2006;27:180–192. doi: 10.1016/j.yfrne.2006.02.001. [DOI] [PMC free article] [PubMed] [Google Scholar]
- [38].Chen Y, Dube CM, Rice CJ, Baram TZ. Rapid loss of dendritic spines after stress involves derangement of spine dynamics by corticotropin-releasing hormone. J. Neurosci. 2008;28:2903–2911. doi: 10.1523/JNEUROSCI.0225-08.2008. [DOI] [PMC free article] [PubMed] [Google Scholar]
- [39].Bennett AOM. Stress and anxiety in schizophrenia and depression: glucocorticoids, corticotropin-releasing hormone and synapse regression. Aust. N. Z. J. Psychiatry. 2008;42:995–1002. doi: 10.1080/00048670802512073. [DOI] [PubMed] [Google Scholar]
- [40].Peeters PJ, Fierens FL, van, I d.W., Goehlmann HW, Swagemakers SM, Kass SU, Langlois X, Pullan S, Stenzel-Poore MP, Steckler T. Gene expression profiles highlight adaptive brain mechanisms in corticotropin releasing factor overexpressing mice. Brain Res. Mol. Brain Res. 2004;129:135–150. doi: 10.1016/j.molbrainres.2004.06.038. [DOI] [PubMed] [Google Scholar]
- [41].Alonso R, Griebel G, Pavone G, Stemmelin J, Le Fur G, Soubrie P. Blockade of CRF(1) or V(1b) receptors reverses stress-induced suppression of neurogenesis in a mouse model of depression. Mol. Psychiatry. 2004;9:278–86. 224. doi: 10.1038/sj.mp.4001464. [DOI] [PubMed] [Google Scholar]
- [42].Swinny JD, Valentino RJ. Corticotropin-releasing factor promotes growth of brain norepinephrine neuronal processes through Rho GTPase regulators of the actin cytoskeleton in rat. Eur. J. Neurosci. 2006;24:2481–2490. doi: 10.1111/j.1460-9568.2006.05129.x. [DOI] [PubMed] [Google Scholar]
- [43].Cibelli G, Corsi P, Diana G, Vitiello F, Thiel G. Corticotropin-releasing factor triggers neurite outgrowth of a catecholaminergic immortalized neuron via cAMP and MAP kinase signalling pathways. Eur. J. Neurosci. 2001;13:1339–1348. doi: 10.1046/j.0953-816x.2001.01510.x. [DOI] [PubMed] [Google Scholar]
- [44].Raji CA, Ho AJ, Parikshak NN, Becker JT, Lopez OL, Kuller LH, Hua X, Leow AD, Toga AW, Thompson PM. Brain structure and obesity. Hum. Brain Mapp. 2009 doi: 10.1002/hbm.20870. [DOI] [PMC free article] [PubMed] [Google Scholar]