

Abstract
This study analyses the evaluation of tomographic indicators of tibia structure, assuming that the usual loading pattern shifts from uniaxial compression close to the heel to a combined compression, torsion and bending scheme towards the knee. To this end, pQCT scans were obtained at 5% intervals of the tibia length (S5–S95 sites from heel to knee) in healthy men and women (10/10) aged 20–40 years. Indicators of bone mass [cortical area, cortical/total bone mineral content (BMC)], diaphyseal design (peri/endosteal perimeters, cortical thickness, circularity, bending/torsion moments of inertia – CSMIs), and material quality [(cortical vBMD (bone mineral density)] were determined. The longitudinal patterns of variation of these measures were similar between genders, but male values were always higher except for cortical vBMD. Expression of BMC data as percentages of the minimal values obtained along the bone eliminated those differences. The correlative variations in cortical area, BMC and thickness, periosteal perimeter and CSMIs along the bone showed that cortical bone mass was predominantly associated with cortical thickness toward the mid-diaphysis, and with bone diameter and CSMIs moving more proximally. Positive relationships between CSMIs (y) and total BMC (x) showed men’s values shifting to the upper-right region of the graph and women’s values shifting to the lower-left region. Total BMC decayed about 33% from S5 to S15 (where minimum total BMC and CSMI values and variances and maximum circularity were observed) and increased until S45, reaching the original S5 value at S40. The observed gender-related differences reflected the natural allometric relationships. However, the data also suggested that men distribute their available cortical mass more efficiently than women. The minimum amount and variance of mass indicators and CSMIs, and the largest circularity observed at S15 reflected the assumed adaptation to compression pattern at that level. The increase in CSMIs (successively for torsion, A–P bending, and lateral bending), the decrease in circularity values and the changes in cortical thickness and periosteal perimeter toward the knee described the progressive adaptation to increasing torsion and bending stresses. In agreement with the biomechanical background, the described relationships: (i) identify the sites at which some changes in tibial stresses and diaphyseal structure take place, possibly associated with fracture incidence; (ii) allow prediction of mass indicators at any site from single determinations; (iii) establish the proportionality between the total bone mass at regions with highly predominant trabecular and cortical bone of the same individual, suitable for a specific evaluation of changes in trabecular mass; and (iv) evaluate the ability of bone tissue to self-distribute the available cortical bone according to specific stress patterns, avoiding many anthropometric and gender-derived influences.
Keywords: bone biomechanics, bone structure, human tibia, peripheral quantitative computed tomography, tibia anatomy, tibia biomechanics, tibia structure
Introduction
The natural relationship between body weight and skeletal size was pointed out by Galilei (Galilei, 1668). It was not until the end of the 19th century when Wolff went one step further, stating that the functions of bones seemed to be related to the forces they have to bear (Wolff, 1892). However, Wolff did not propose any mechanism underlying that relationship, or any variable involved in a putative regulatory system of that critical association. Later on, in the 1970s, Frost was the first to propose that bones would adapt their structure to the magnitude of the forces produced by the customary mechanical usage of the skeleton (Frost, 2003). There is now ample evidence to support this idea (Rubin & Lanyon, 1984, 1987; Goodship, 1992; Burr et al. 2002; Currey, 2003).
Frost’s proposed regulatory model of bone adaptation, called bone mechanostat (Frost, 1987), is thought to modulate bone formation and resorption by feed-back control at every skeletal site following a directional pattern. As a result, local bone modeling and remodeling would be spatially oriented by the customary strains of the structure as a function of the loads induced by the habitual mechanical usage of the skeleton (Rubin & Lanyon, 1987; Turner, 1991; Goodship, 1992; Frost et al. 1997). Despite the intrinsic mechanical or ‘material’ properties of the hard tissue being known to vary much less than bone geometric indicators (Hall, 1966), it was likewise proposed that bone morphology is also adapted to local differences or changes in the stiffness of the mineralized matrix (Ferretti et al. 1993; Tommasini et al. 2005).
All compression, bending and torsion stresses are relevant in a biomechanical analysis of practically every bone in the skeleton (Wainwright et al. 1976). However, the correlations between bone mass and strength are not the same for different skeletal sites and stress patterns. To resist in compression, what actually counts is the amount of mineralized mass in the bone cross-section perpendicular to the loading force. Instead, the most important bone architectural feature to resist bending or torsion stresses is the distance at which the available cortical mass in the cross-section is distributed with reference to the corresponding bending or torsion axes (Martin et al. 1998). This interesting property is defined by the respective second cross-sectional moments of inertia (CSMIs) of the cortical bone area for bending or torsion (Wainwright et al. 1976; Guo, 2001). The CSMIs vary in proportion to the squared distance between the cortex and the selected reference axis, and describe the efficiency of the bone cross-section to resist the corresponding bending or torsion stresses (Martin et al. 1998).
The mechanostat theory can explain the determination of many aspects of both the anatomical and structural properties of practically all the trabecular networks and cortical shells quite satisfactorily (Frost, 1987, 2003). In long bones such as the human tibia, this theory can provide a reasonable explanation for the development of some anatomical features from a biomechanical point of view.
This study assumes the existence of a morphological adaptation of the human tibia to its mechanical environment following the above concepts. It is well known that the effective joint size in long bones is larger than the bone cross-section (Günther & Blickhan, 2002; Tortora & Derrickson, 2006; Rittweger, 2007), and that the total bone mass and cross-sectional area in long-bone metaphyses vary inversely with the mechanical efficiency of the combined chondral/subchondral and trabecular/cortical structures to support compressive stresses (Yamada & Evans, 1970; Frost, 2003). Friction across the joint is extremely small – friction factor μ∼0.001 for hyaline cartilage (Özkaya & Nordin, 1998) – so that the tibio-talar joint surfaces as well as the knee joint transmit almost exclusively compressive forces. The macroscopic spatial disposition of the trabecular network in long-bone metaphyses is highly adapted to transmit compressive forces from the articular surfaces to the cortical walls (Frost, 2003). From an engineering perspective, therefore, one can think of the trabecular bone in the ends of the long bones as a means to spread the effective compressive forces over a larger area of support.
In many physiological circumstances, musculoskeletal forces pass through the single joint surface at the heel and through each of the two joint surfaces at the knee. Therefore, it can be proposed that, going proximally from the tibio-talar joint, the loading scheme of the tibia would change from a predominant uniaxial (longitudinal) compression close to the heel to a progressive addition of bending and torsion stresses along the central part of the diaphysis. Then, toward the knee, two, more or less independent longitudinal compression axes would act. There is increasing evidence that both the amount and distribution of tibia cortical and trabecular bone mass should accommodate to those biomechanical relationships. A 3-D estimation of the load distribution from the hip to the heel during gait showed that ‘in the distal part of the tibia, the axial force dominated the 3-D internal load case, whereas the internal moments became more significant with increasing distance from the axle joint’ (Wehner et al. 2009).
Previous studies of serial saw-cut cross-sections of cadaveric tibiae showed that bone diameters vary differently from cortical mass over the entire length of the bone (Piziali et al. 1980; Miller & Purkey, 1980), in agreement with the alluded relationships. In extension of that work, modern technology allows the accurate assessment of all the anatomical bone properties mentioned above. This includes indicators of bone mass, bone material ‘quality’, and epiphyseal and diaphyseal design (including the CSMIs), which all can be determined noninvasively in vivo by peripheral quantitative computed tomography (pQCT) (Ferretti, 2000).
Recent pQCT studies have shown that this technology is able to evaluate both bone architecture and strength in some specific sites of human long bones in different conditions (Augat et al. 1996; Ashe et al. 2006; Braun et al. 1998; Cooper et al. 2008; Grampp et al. 1995; Groll et al. 1999; Kontulainen et al. 2003; Muller et al. 2003). In the adult human tibia, pQCT studies showed elementary biomechanical correlations (Kontulainen et al. 2008; Liu et al. 2007; Rittweger et al. 2000; Russo et al. 2003), pubertal changes (MacDonald et al. 2005; Kontulainen et al. 2006), gender-related differences (Duan et al. 2003; MacDonald et al. 2005; Evans et al. 2008), and structural adaptations to muscle strength or physical activity (Happasalo et al. 2000; Heinonen et al. 2001; Lai et al. 2005; MacDonald et al. 2005, 2009; Nikander et al. 2006; Rantalainen et al. 2008; Mikkola et al. 2009; Uusi-Rasi et al. 2009) and to the paraplegic condition (Rittweger et al. 2006; Dionyssiotis et al. 2007; Frotzler et al. 2008; Pang et al. 2008).
We have determined a number of mechanically significant indicators of bone mass, density and distribution in sequential cross-sectional pQCT images obtained at many sites from the entire tibia of healthy young adults of both sexes. The aims of the study were: (i) to describe the normal evolution and interrelationships of the determined tomographic indicators along the whole tibia in the studied sample with more detail and rigor than the way they were previously reported; and (ii) to propose the application of some of those new descriptions and relationships to improve the understanding of the tibia structure and the diagnostic scope of pQCT technology.
Materials and methods
The sample
Ten men and 12 women aged 20–40 years volunteered to participate the study. All of them were healthy, sedentary individuals with no history of fractures or diseases or treatments which may affect the skeleton. Informed consent was obtained from each individual before inclusion in the study. The study was approved by the Hospital’s Ethics Committee.
pQCT determinations
An XCT-2000 scanner (Stratec, Germany) was used to scan the entire right tibia of each individual. According to the manufacturer, the expected radiation dose involved a total body equivalent dose of 0.9 uSV per scan, and the cumulative dose for the whole study therefore was in the order of 20 uSv. The X-ray beam generated by the XCT-2000 scanner has a thickness of 2.5 mm, and the pixel edge size was set to 0.5 mm. Cross-sectional images were obtained at regular intervals equivalent to 5% of the tibia’s length. We have numbered the scans from S5 (5% site, next to the tibio-talar joint) to S95 (95% site, next to the knee joint). For technical reasons, the scan at S50 could not be obtained in any case. Thus, a total of 18 scans were obtained for the entire bone (Fig. 1). Analysis was done automatically, taking advantage of the ‘loop’ facility that comes with the integrated XCT software. In particular the following parameters were applied for all sectional images: contmode 2, peelmode 2, and cortmode 1. Threshold values for total and cortical bone were selected at 398.5 and 700.0 mg cm−3, respectively.
Fig. 1.

Serial pQCT scans obtained from one of the studied (male) legs, numbered S5 to S95 from the distal to the proximal end, as described in the text.
The following indicators were obtained from each scan, as allowed by the corresponding bone structure (Ferretti, 2000; Rittweger et al. 2000).
Bone ‘mass’ indicators
Cortical bone area: area of the defined cortical bone region of the tibial cross-section, in mm2.
Mineral content of cortical bone (Cortical BMC): amount of mineral present in the defined cortical bone area of the tibia cross-section, in mg mm−1 of slice thickness.
Mineral content of total bone (total BMC): total amount of mineral (cortical + trabecular) contained in the whole tibia cross-section, in mg mm−1 of slice thickness.
Mineral content of trabecular bone: The tomographic discrimination between ‘cortical’ and ‘trabecular’ bone obviously depends on the selected attenuation thresholds (Ferretti, 2000). Thus, the total amount of the ‘real’ trabecular BMC as determined by the standard threshold-derived or concentric-peeling procedures cannot be assessed accurately, as required for the proposed analyses. Furthermore, the structural stiffness and strength of the trabecular network: (i) increase proportionally to the cube and the square, respectively, of its apparent (Archimedean) density (Carter & Hayes, 1977), which is highly variable between sites; (ii) depend largely on the trabecular connectivity and directionality (which cannot be determined by pQCT); and (iii) cannot be analyzed separately in the combined cortical-trabecular structure (Andresen et al. 1998). These limitations do not impede the application of trabecular bone measurements to comparative diagnostic purposes (Dionyssiotis et al. 2007; Frotzler et al. 2008; Grampp et al. 1995; Heinonen et al. 2001; Muller et al. 2003; Schneider et al. 1991), but they preclude the application of any trabecular mass or density determination in the structural analysis approached in this study. Therefore, for the purpose of this study, the trabecular bone mass (trabecular BMC) was only analyzed as included into the total BMC determinations.
Diaphyseal design indicators
Periosteal perimeter: external perimeter of the tibia cross-section, assimilated to a circular figure (assessed automatically as ‘PeriC’), in mm.
Endocortical perimeter: internal perimeter of the cortical area, assimilated to a circular figure (assessed automatically as ‘EndoC’), in mm
Cortical thickness: average thickness of the circular crown formed by the centered PeriC and EndoC circumferences, in mm.
Circularity: Calculated as 2*SQRT (circularized area)/perimeter of the cross-section (Teague, 1980).
Second moments of inertia of the cortical area (cross-sectional moments of inertia, CSMIs): integrated sums of products of the area of every pixel in the defined cortical image by their squared perpendicular distance to some selected reference bone axes passing through the center of mass of the bone image, namely: the longitudinal axis (polar or torsion CSMI); the lateral-medial axis [anterior-posterior (A–P) bending CSMI]; and the anterior-posterior axis (lateral bending CSMI), in mm4. These measures capture the architectural efficiency of the cross-sectional design of the cortical shell to resist torsion, anterior-posterior bending, and lateral bending, respectively (Wainwright et al. 1976; Martin et al. 1998). The high degree of porosity of the less dense bone tissue and the directional adaptation of the trabecular networks to support compressive forces limited the CSMI calculations to the defined cortical bone areas.
Bone material ‘quality’ indicator
Volumetric mineral density of cortical bone (cortical vBMD) = cortical BMC/cortical area, in mg mm−3: This expresses the amount of mineral per unit of cortical bone volume including the pores (apparent volumetric density), and is known to vary linearly with the intrinsic stiffness (elastic modulus) of cortical bone tissue (Currey, 1979). This indicator was mathematically corrected for the error induced by the ‘partial volume effect’ determined by the presence of ‘cortical’ pixels, which are either counted by the device despite not being completely filled by ‘solid’ cortical bone, or disregarded despite not being completely free of bone mineral (Rittweger et al. 2004). This correction allowed determination of reliable cortical vBMD data in every image with a cortical thickness larger than twice the pixel edge length (in practical terms, from S10 to S90).
Statistical analyses
Statistical analyses were performed with the r-software (R-Development Core Team, 2008). For the serial study, means and SDs were calculated for each indicator and site studied, averaged by gender, and compared by one-way anova. Values for each slice scanned were also plotted against their corresponding bone sites. Adjusting polynomial equations for the regression curves describing the variation of the bone indicators along the whole bone in each group were calculated (least-squares method). These mathematical approaches were not intended to describe any biological relationship, but only to provide a suitable tool for calculation of the values of the studied variables for different bone sites from the data obtained at any single site, and for comparative purposes employing the Extra-sum of squares F-test as described below. Simple correlations were analyzed between some of the indicators calculated for the same site, and the differences between slopes and ordinates after a linear transformation of the data were tested by ancova, as needed.
Results
In general terms, the patterns of variation for each indicator studied in the serial scans along the bones showed no gender-related differences in shape. However, with the exception of the cortical vBMD, the values of every indicator studied were always higher for males than for females at every site (Extra-sum of squares F-test, P < 0.001, except for the periosteal perimeter). Interestingly, different behaviors and interrelationships were observed for each kind of indicator determined, as follows.
The total BMC decayed about 33% from S5 to S15. More proximally, the total BMC increased with an almost constant slope until S45, reaching again the original S5 value at S40, and maintaining statistically similar values from S50 to S80 (Fig. 2A). More proximally, the total BMC increased sharply up to the knee. In general terms, the dispersion of the total BMC data was proportional to their mean values at every site, maintaining a CV value close to 15.6% for males and 12.1% for females. Expression of the total BMC values as percentages of the minimum value per site for each individual (Fig. 2B) revealed that the curves were virtually identical for males and females (Extra-sum of squares F-test, F = 1.84, n.s.). The mathematical approach of the adjusting curve for both groups together showed that the theoretically minimum total BMC values for the whole bone would have been reached simultaneously at the S16 site. The minimal dispersion of total BMC values actually measured (CV = 8.9% for men and 8.5% for women) was reached at the C15 site.
The circularity of the cross-section (Fig. 2C), statistically similar for males and females (Extra-sum of squares F-test, F = 0.982, n.s.), varied inversely to the total BMC between S5 and S45. The adjusting equation for the whole sample revealed that the maximum circularity value would have been reached at the S16 site. The minimal dispersion of circularity values actually measured (CV = males, 0.63%; females, 0.83%) was reached at the S15 site.
The contribution of pixels with a vBMC lower than 700 mg cm−3 to the total BMC decreased rapidly (average 85%), going centripetally from S5 to S15 and from S85 to S95, and was negligible in the other sites. The cortical area and BMC were closely and linearly related to each other (r = 0.831; P < 0.001). They increased greatly from S5 to S45; remained virtually constant until S75, and fell dramatically more proximally. Figure 3A shows the transition of cortical BMC throughout the bone in males and females.
Accordingly, the cortical vBMD values were comparable for all measurement sites between S10 and S90 within each gender (anova, always P > 0.05; not shown); however, they were significantly higher in women than in men (general means ± SD: females, 1134 ± 16 mg cm−3; males, 1108 ± 20 mg cm−3; anova, P < 0.01; not shown).
The cortical thickness varied in parallel with cortical area and BMC between S5 and S45, but then decayed substantially until S95 (P < 0.001 between S45 and every other more distal site; Fig. 3B).
The periosteal perimeter decreased proximally from the heel down to a minimum level between S20 and S55 and then increased consistently up to reach maximum values close to the knee (Fig. 3C).
All the CSMIs showed minimal values between S10 and S25 (Fig. 4). More proximally, considerable increases were observed, occurring successively for the torsion CSMI from S25, for the A–P bending CSMI from S35, and for the lateral-bending CSMI from S45, up to the knee. Up to approximately S45, the CSMIs increased in direct proportion with the cortical area, thickness or BMC in both genders (r = 0.453 to 0.518, P < 0.05; not shown). However, from S50 to S80 there was an inverse relationship with these indicators, and a direct relationship with the periosteal perimeter (r = −0.641 to −0.663; P < 0.01; not shown).
A comparative analysis of Figs 3 and 4, and the comparison of the torsion CSMI/cortical BMC ratios obtained at every site (not shown), indicate that cortical bone contributed significantly to the CSMIs only from S25 to S55. More proximally, the CSMIs increased considerably almost completely independent of cortical mass. From S55 to S70 the CSMIs increased and cortical mass remained constant, whereas from S75 to S90 the CSMIs increased despite a substantial reduction in cortical mass.
A comparison between CSMIs (y) and the total or cortical BMC (x) at every studied site between S15 and S85, showed that there was always a common, positive, highly significant quadratic relationship for male and female data, with female values accumulated toward the lower-left side of the graphs and male data accumulated toward the upper-right region. Figure 5A shows this relationship between the torsion CSMI and total BMC as assessed for the S65 site in men and women together. However, separate analyses of male and female data at the same sites showed that there were always two different, significant and positive quadratic relationships with similar slopes but significantly higher ordinates for the former. Figure 5B shows these relationships as assessed for the same S65 site as in Fig. 5A.
Fig. 2.
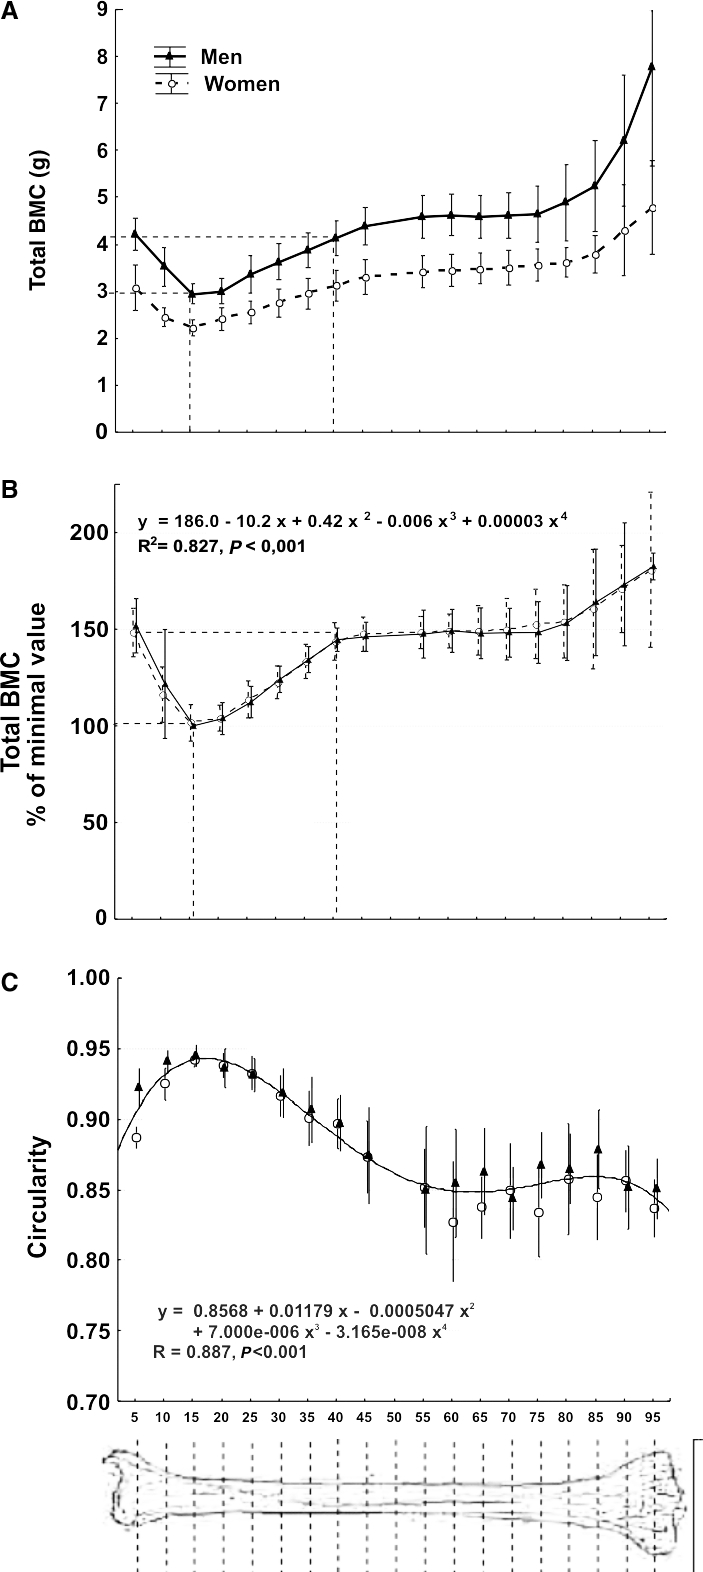
(A) Means ± SD of crude values of total mineral content (total BMC) of the whole set of tibial scans (numbered 5–95 as described in the text) of the male and female individuals studied. Dashed lines indicate the ToC reduction of about 33% at approximately S15 with respect to S5 and its recovery at approximately S40 as commented in the text. (B) Means ± SD of the total BMC values determined as in (A), expressed as percentages of the minimum value obtained [i.e. that corresponding to the S15 site in (A)]. No statistical difference was found between the determinations in men and women. Accordingly, a single, polynomial equation (shown in the graph) was calculated for the description of the theoretical evolution of the data for both genders. The adjusting curve is not shown. The maximum reduction in total BMC observed at S15 with respect to S5 and its recovery at approximately S40 are indicated as in (A). (C) Means ± SD’s of circularity values for the cross-sections calculated at each studied site. As male and female values did not differ statistically within sites throughout the bone, a single adjusting curve is shown for both genders.
Fig. 3.

Comparative changes of means ± SD of cortical mineral content (A), cortical thickness (B) and periosteal perimeter (C) of the whole set of tibial scans (numbered 5–95 as described in the text) of the male and female individuals studied.
Fig. 4.

Comparative changes of means ± SD of the moments of inertia for lateral bending CSMI (A), A–P bending CSMI (B) and torsion CSMI (C) of the tibia scans obtained between the S10 and 90 sites of the male and female individuals studied. Sketches on the right indicate the position of the reference axes considered for calculation of the corresponding CSMIs. Arrows indicate the sites at which the CSMI values begin to grow significantly in the proximal direction with respect to the virtually constant proximal values in each graph.
Fig. 5.

(A) Correlation between the mean values of torsion CSMI and total BMC measured at the S65 site in males and females, closely adjusted by a single exponential equation. (B) The same data as in (A) re-analyzed assuming the existence of independent exponential relationships for each gender. An ancova test of the linearized relationships showed that the corresponding curves, both significantly positive, did not differ in slope (F = 0.14, P = 0.717) but had significantly different intercepts (F = 4.56, P < 0.05).
Discussion
Serial scan analyses confirmed that the human tibia has a complex internal structure, and that its architectural design, and thus structural strength, varies profoundly along its length. The tibia has least bending and torsion strength (minimum CSMI values) between S5 and S40, in line with the idea of a structural adaptation to a high predominance of uniaxial compression in its distal part. It can be proposed that the maximum circularity and minimum diameters of the diaphyseal design and the minimum values of all the three CSMIs at the S15 site would further reflect a relatively poor adaptation to bending and torsion stresses up to that site (Martin et al. 1998). In fact, the smaller the torsion/bending influences on the customary strains induced by daily mechanical usage, the higher the circularity and the smaller the amount of mass required in the cross-section. It can be proposed that the amount of bone mass at approximately S15, distributed in an almost circular section with the minimum diameter all along the bone, and comprising a large predominance of highly efficient cortical bone, would be the closest to that needed to support a pure compression pattern along the whole tibia. In agreement with this interpretation, the measured S15 site also showed the smallest values of total BMC throughout the whole bone (Martin et al. 1998). This finding is congruent with simple observations and some experimental data which suggest that natural selection tends to minimize the mass of the bones maintaining appropriate safety factors for performing particular functions (Currey, 2003). This trend looks increasingly stringent in the proximal-distal direction of the long bones of the limbs, with some advantage for limb dynamics (Turner, 1991; Swartz et al. 1992; Currey, 2002; Dellanini et al. 2003). In the human lower limbs, any mass of bone will contribute to the limb moment of inertia according to the square of the distance from the hip (Currey, 2003). Importantly, also the variance of the total BMC values was minimal at S15. This suggests a minimal intercurrence of other adaptive biomechanical factors of variance compared with the uniaxial compression stress at that site.
The enhancement of bone mass from S15 proximally, with growing increases in the CSMIs from S25 to S45 onwards while the cortical vBMD remains virtually constant, further reveals the geometric adaptation of the diaphysis to progressively increasing bending and torsion stresses (Currey, 2003; Wehner et al. 2009) and also to the double compression pattern coming from the knee. The cross-sectional design shows a progressive adaptation to torsion, A–P bending and lateral bending in this sequential order toward the proximal end of the bone, as indicated by the comparative evolution of the corresponding CSMIs, regardless of the geometric shape of the cortical section. This changing pattern of tibial adaptation to mechanical stimulation should obviously be determined by the eccentric traction forces exerted by calf muscles at their corresponding insertion areas on the bone.
That complex structural adaptation required progressively increasing amounts of bone mass until S45, as revealed by the increases in total and cortical BMC and in cortical thickness up to that level. More proximally, however, total bone mass remains relatively stable, whereas bone diameters, which remain relatively constant at low values until S55, increase substantially as the cortex becomes progressively thinner and the CSMIs grow dramatically. Closer to the knee, cortical bone mass progressively decreases and trabecular mass increases, with a continuous increase in total bone mass.
In agreement with the proposed hypotheses of mechanical adaptation of the bone structure, the complex pattern of variation in design described along the tibia could be interpreted as follows:
Toward the tibia’s distal end, the bone cross-sections seem to be best adapted to a compressive stress pattern. Accordingly, the required amount of bone to resist compression, condensed as virtually only compact bone as the most effective possible resource, tends to adopt a circular shape (Wainwright et al. 1976) rather than adapting to produce a maximal CSMI. This trend is especially evident at S15. This apparent mechanical adaptation to a predominantly compressive pattern in the distal tibia may be associated with the relatively frequent incidence of torsion and bending fractures at this level of the leg, in relation to fatigue induction (Evans et al. 2008) or to the accidents that befall it. This evident ‘natural reduction’ in the regional safety factor of the tibia suggests that the strength of the bone is pitted against the need to make it as light as possible, particularly in the distal elements (Currey, 2003).
The structural arrangement of the mineralized mass in question from S15 down to S5 changes progressively from an almost purely cortical to a combined, trabecular/cortical pattern, with a progressive increase in total bone mass, about 50% in total. Assuming a relative constancy of the cross-sectional adaptation to uniaxial compression between S5 and S15, and taking into account that trabecular bone contributes to compression strength, this suggests that the mechanical efficiency of the mineralized mass present in the combined, trabecular/cortical structure close to the heel (S5) to resist uniaxial compression should be about two-thirds that of the almost pure cortical structure found at S15.
More proximally (from S35 upwards), the rapid increase in CSMI values suggests a progressive addition of torsion and anterior-posterior bending and then lateral bending stresses. Reports by others also show a trend of the tibia cross-section to reflect the changing pattern of bending and torsion stresses along the bone, and to ascribe the corresponding geometrical changes to mechanically induced regional shifts in the histomorphometrically assessed bone mineral apposition rate (Piziali et al. 1980; Schilling et al. 1992). Up to the bone midshaft, the biological cost of this necessary anatomical adaptation seems to be afforded chiefly by a substantial increase in bone mass, with relatively little variation in the periosteal perimeter and a large increase in cortical thickness. Incidentally, it was observed that the total BMC value at S5 for the combined cortical-trabecular structure seems to be reached again at about S40 for the pure cortical structure (Fig. 2A).
Proximal to the midshaft, the large increase in CSMIs was progressively achieved through an enlargement of bone diameters at the expense of cortical thickness, rather than by any further increase in bone mass. This should reflect the maximal influence of torsion and bending stresses throughout the bone shaft at that bone region.
Closer to the knee, despite the persisting cortical thinning, total bone mass increases again as a result of the large enhancement of bone diameters, and also due to the progressive change from the pure cortical shell to the less efficient, combined cortical-trabecular metaphyseal structure. This should reflect (i) a further anatomical adaptation of bone design and structure to a more complex compression pattern derived from the ability of the joint to support the whole body weight on each of the two tibial plates; and (ii) the mechanical requirement to disperse musculoskeletal forces via the joints (Rittweger, 2007), the latter being clad with cartilage that is known to have material properties inferior to bone (Yamada & Evans, 1970).
The employed methodology does not allow calculation of Young’s modulus of cortical bone. However, within normal conditions, the modulus correlates linearly with the degree of mineralization of the tissue (Currey, 1979), of which the cortical vBMD is a good correlate. The cortical vBMD was calculated in the study for every section, and it was also adjusted to neutralize the ‘partial-volume effect’, provided that the cortical thickness is not less than twice the pixel edge length (Rittweger et al. 2004). The adjusted cortical vBMD data reported in this study (all corresponding to sections with a cortical thickness over that critical limit) showed a reasonable constancy along the whole bone within each gender. Therefore, the scarce variation of the cortical vBMD throughout the bone simplifies the above mechanical analysis, which could be validly restricted to only the geometric changes in cross-sectional design (Martin et al. 1998) in all sections with an adequate cortical thickness, i.e. from S10 to S90.
The larger values obtained for every allometrically related indicator studied in men than in women correlate with the natural, size-related differences between genders (MacDonald et al. 2005; Nieves et al. 2005; Evans et al. 2008). The significantly higher levels of cortical vBMD (a descriptor of bone material ‘quality’, which shows no allometric dependence) found in the women was also an expected finding. Some pQCT and DEXA studies in normal women showed a higher bone mineral content per unit muscle mass in normal fertile women than in normal men of comparable ages (Ferretti et al. 1998; Capozza et al. 2004; Cure-Cure et al. 2005; Evans et al. 2008). It can be speculated whether this reflects a natural adaptation of female skeletons to favor the accumulation of mineral to be passed to the offspring, helped by the estrogen-induced inhibition of cortical and trabecular remodeling (Jarvinen et al. 2003).
Conversely, the large differences in male and female data distribution along the quadratic relationships between CSMIs and cortical BMC values (as measured between S15 and S85) show that men generally tend to distribute their cortical bone tissue per unit of available tissue mass more efficiently in architectural terms than women do. Recent evidence supports this interpretation (Duan et al. 2003; MacDonald et al. 2005; Nieves et al. 2005; Evans et al. 2008). However, the collected information does not allow us to establish whether the apparent architectural advantage of the male skeleton adaptation responds to a common mechanism for the species, as suggested by the analysis of the data from men and women together (Fig. 5A), or to a special characteristic of the male skeleton, as indicated by the separate analysis of the same relationship (Fig. 5B). The known fact that estrogens inhibit periosteal growth, whereas androgens favor periosteal growth and muscle strength development, points to a different physiological condition for each gender which would support the second alternative. Whatever the nature of this gender-related difference, it can be also speculated that it would reflect a selective adaptation of the (larger) male skeleton to favor the development of strong bones for fighting for food and mates (Currey, 2002). The mechanostat theory offers a reasonable background to extend these speculations to all vertebrate skeletons (Frost, 2003).
The above analyses offer many perspectives for the clinical application of the derived concepts and relationships. Three of these interesting potential applications could be the following:
The adjusting equations describing the values of every indicator along the whole tibia allow estimation of individual values of the indicators at any desired site as a function of a single determination obtained at any point of the bone, for men and women. In particular, the equation describing the behavior of the total BMC values all along the bone expressed as percentages of the minimal individual values observed in males and females together (Fig. 2B) allows estimation of any individual value of total BMC as a function of that obtained at the S15 site, avoiding the influence of any gender-related or allometric association. This could offer a comparative reference for diagnosing osteopenia following valid biomechanical criteria.
The relationships of about 1.5 : 1.0 found between total bone mass at S5 vs. S15, and about 1.0 : 1.0 found between the same variable measured at S5 vs. S40 (i.e. in sites where reasonable biomechanical arguments suggest, and data confirm, that the mineralized mass should show the minimal values and variance throughout the bone), could be proposed for evaluation of the trabecular/cortical bone proportionality in any studied individual. In particular, the close 1.5 : 1.0 ratio between the total BMC values measured at S5 and S15 sites reflect the proportionality between the mass status of trabecular bone (which is highly predominant in tibia structure at the S5 site) and cortical bone (which is highly predominant in the tomographic determinations at S15), both of them subjected to virtually the same stress pattern. As epiphyseal bone mass may be more sensitive than diaphyseal mass to remodeling-induced changes, the S5/S15 ratio of total BMC can detect changes in the trabecular mass as related to the cortical mass status in the same individual, avoiding comparisons with reference samples taken from different (younger) individuals, as imposed by current DEXA determinations of T-scores of areal BMD (Kanis et al. 1996; Bolotin, 2007). The potential reference value of the S5/S15 ratio of total BMC would be especially important if the 1.5 : 1.00 relationship referred to, is both close and constant. Some preliminary evidence from our laboratory (Capozza et al. 2007) supports the statistical arguments offered by this study on the basis of reasonable associations between compressive stress and bone mass. Both the S5/S15 and the S5/S40 ratios of total BMC were estimated in a large sample of healthy individuals (60 men aged 20–80 years and 120 pre-menopausal women aged 20–50 years) by measuring the total BMC at the standard, 4% site (i.e. close to S5 in this study) and correlating it with the same indicator determined at 14% (close to S15) and 38% (close to S40) sites. In agreement with our proposal, highly significant linear regressions, with slope values of 1.54 and 1.08, respectively (very close to 1.5 and 1.0 as predicted by the respective ratios of total BMC described in the present study) and very low residual values were obtained, regardless of the gender, age and anthropometric features of the (fertile) individuals studied. The expression of these relationships as graphs showing the confidence intervals for 1, 2, and 3 SDs of the data over and below the regression line can be used for a comparative evaluation of the trabecular bone status in other individuals for diagnostic purposes, employing the standard pQCT procedures, avoiding confusion from any reference to bone turnover evaluation as an associated variable (Parfitt, 2002; Rittweger et al. 2010). Validation of this procedure as an effective diagnostic tool for bone-weakening diseases will require further, specifically designed studies.
Similarly, reference curves of the relationships between the CSMIs and total BMC (‘distribution/mass’ curves) such as the ones described in this study can be obtained, eventually as separate charts for men and pre-menopausal women. These references can provide a comparative diagnosis of the ability of bone mechanostat to distribute the available bone tissue in bone diaphyses in men and women in different clinical conditions.
These and analogous evaluations based on the same type of indicators are presently beyond the scope of any densitometric measurement of the skeleton.
Limitations of the study
The small number of individuals and their relatively narrow age range conspire against the generalized use of the obtained data as a concrete reference for comparative diagnostic applications. Nevertheless, the statistical significance of the described differences and relationships offer reasonable support for the corresponding developments. Moreover, this study was not planned to provide such reference values, but rather to describe the coherent patterns of bone strength estimators along the human tibia.
The discussion offered by the authors as to the biomechanical meaningfulness and correlations of the studied indicators is obviously limited to the scope of the standard, noninvasive (pQCT) assessment of the skeletal condition.
Concluding remarks
In general terms, results confirm that the tibia anatomy is closely adapted to the mechanical requirements derived from the different stress patterns to which every bone region is subjected by body weight-bearing and customary mechanical usage of the bone.
Specifically, the evidence collected from the new analytical procedures applied and interpreted accordingly with that biomechanical approach, suggests that:
The analysis of the amount (total BMC) and distribution (CSMIs, circularity) of bone mass along the tibia allowed detection of sites at which the variance of some pQCT indicators was minimal, in coincidence with clear biomechanical relationships between bone structure and strength, regardless of the gender and anthropometric characteristics of the individual. This offers some suitable reference for comparative diagnosis of the skeletal status, including a separate diagnosis of the trabecular mass status, and supports the use of the standard sites (S4, S14, S38) established for clinical pQCT determinations.
The values of some of the studied pQCT indicators at different sites of the tibia can be predicted from single determinations thanks to specific, polynomial algorithms which describe their variation along the whole bone in men and women.
The evolution of the different pQCT-assessed CSMIs studied along the tibia shows that the adaptation of the cross-section to torsion and A–P and lateral bending begins to develop at different sites along the bone, regardless of the gender and anthropometric features of the individual.
The described differences of mechanical adaptation of the tibia cross-sectional design to different kinds of stress could be associated with a lower level of resistance to particular types of fracture for which the strength of the bone could not have been optimized as a response to the customary usage of the skeleton.
The architectural efficiency of the tibia cross-sectional design concerning different kinds of deforming forces can be described and tested in men and women by the relationships between pQCT indicators of the distribution and mass of the cortical tissue, with potential clinical applications.
Acknowledgments
This paper has been supported by grants from the Agencia Nacional de Promoción Científica y Tecnológica (ANPCyT, PICT’s Nos 05-11628 & 05-21679) and the Consejo Nacional de Investigaciones Científicas y Técnicas (CONICET, PIP No. 05-6499), Argentina. J.L.F., G.R.C. and R.F.C. are full-time Career Members of the Scientific Research Council, CONICET. S.F. is a full-time Career Member of the Research Council, Consejo de Investigaciones de la Universidad Nacional de Rosario (CIUNR), Argentina. P.R. holds a Fellowship of the ANPCyT (PICT Nr 05-21679).
Author contributions
R.F.C., S.F., G.R.C.: Data analysis and interpretation, general discussion & coordination. Both R.F.C. and S.F. deserve a first authorship in this paper because they shared their responsibility throughout the course of the study. P.M., P.R.: Patient recruitment, data acquisition and management, general discussion. H.S.: Contributions to concept and design. J.L.F., J.R.: Critical revision and approval of the article, general conduct of the study.
References
- Andresen R, Werner HJ, Schober HC. Contribution of the cortical shell of vertebrae to mechanical behaviour of the lumbar vertebrae with implications for predicting fracture risk. Br J Radiol. 1998;71:759–765. doi: 10.1259/bjr.71.847.9771387. [DOI] [PubMed] [Google Scholar]
- Ashe MC, Khan KM, Kontulainen SA, et al. Accuracy of pQCT for evaluating the aged human radius: an ashing, histomorphometry and failure load investigation. Osteoporos Int. 2006;17:1241–1251. doi: 10.1007/s00198-006-0110-5. [DOI] [PubMed] [Google Scholar]
- Augat P, Reeb H, Claes LE. Prediction of fracture load at different skeletal sites by geometric properties of the cortical shell. J Bone Miner Res. 1996;11:1356–1363. doi: 10.1002/jbmr.5650110921. [DOI] [PubMed] [Google Scholar]
- Bolotin HH. DXA in vivo BMD methodology: an erroneous and misleading research and clinical gauge of bone mineral status, bone fragility, and bone remodeling. Bone. 2007;41:138–154. doi: 10.1016/j.bone.2007.02.022. [DOI] [PubMed] [Google Scholar]
- Braun MJ, Meta MD, Schneider P, et al. Clinical evaluation of a high-resolution new peripheral quantitative computerized tomography (pQCT) scanner for the bone densitometry at the lower limbs. Phys Med Biol. 1998;43:2279–2294. doi: 10.1088/0031-9155/43/8/020. [DOI] [PubMed] [Google Scholar]
- Burr DB, Robling AG, Turner CH. Effects of biomechanical stress on bones in animals. Bone. 2002;30:781–786. doi: 10.1016/s8756-3282(02)00707-x. [DOI] [PubMed] [Google Scholar]
- Capozza RF, Cointry GR, Cure-Ramírez R, et al. A DXA study of muscle-bone relationships in the whole body and limbs of 2,512 normal men and pre- and post-menopausal women. Bone. 2004;35:283–295. doi: 10.1016/j.bone.2004.03.010. [DOI] [PubMed] [Google Scholar]
- Capozza RF, Cointry GR, Feldman S, et al. Trabecular bone mass evaluation as related to cortical mass in the human leg. A pQCT study (Abstract) J Bone Miner Res. 2007;22(S1):S421. [Google Scholar]
- Carter DR, Hayes WC. The compressive behavior of bone as a two-phase porous structure. J Bone Joint Surg Am. 1977;59:954–962. [PubMed] [Google Scholar]
- Cooper DM, Ahamed Y, MacDonald HM, et al. Characterising cortical density in the mid tibia: intra-individual variation in adolescent girls and boys. Br J Sports Med. 2008;42:690–695. doi: 10.1136/bjsm.2008.049528. [DOI] [PubMed] [Google Scholar]
- Cure-Cure C, Capozza RF, Cointry GR, et al. Reference charts for the relationships between DXA-assessed bone mineral content and lean mass in 3,063 normal men and pre- and post-menopausal women. Osteoporos Int. 2005;16:2095–2106. doi: 10.1007/s00198-005-2007-0. [DOI] [PubMed] [Google Scholar]
- Currey JD. Mechanical properties of bones with greatly differing functions. J Biomech. 1979;12:313–319. doi: 10.1016/0021-9290(79)90073-3. [DOI] [PubMed] [Google Scholar]
- Currey JD. Bones: Structure and Mechanics. Princeton: Princeton University Press; 2002. [Google Scholar]
- Currey JD. How well are bones designed to resist fracture? J Bone Miner Res. 2003;18:591–598. doi: 10.1359/jbmr.2003.18.4.591. [DOI] [PubMed] [Google Scholar]
- Dellanini L, Hawkins D, Martin RB, et al. An investigation of the interactions between lower-limb bone morphology, limb inertial properties and limb dynamics. J Biomech. 2003;36:913–919. doi: 10.1016/s0021-9290(03)00076-9. [DOI] [PubMed] [Google Scholar]
- Dionyssiotis Y, Trovas G, Galanos A, et al. Bone loss and mechanical properties of tibia in spinal cord injured men. J Musculoskelet Neuronal Interact. 2007;7:62–68. [PubMed] [Google Scholar]
- Duan Y, Beck TJ, Wang XF, et al. Structural and biomechanical basis of sexual dimorphism in femoral neck fragility has its origins in growth and aging. J Bone Miner Res. 2003;18:1766–1774. doi: 10.1359/jbmr.2003.18.10.1766. [DOI] [PubMed] [Google Scholar]
- Evans RK, Negus C, Antczak AJ, et al. Sex differences of bone strength in new recruits: beyond bone density. Med Sci Sports Exerc. 2008;40:645–653. doi: 10.1249/MSS.0b013e3181893cb7. [DOI] [PubMed] [Google Scholar]
- Ferretti JL. Chapter 26: Peripheral quantitative computed tomography for evaluating structural and mechanical properties of small bone. In: An YH, Draughn RA, editors. Mechanical Testing of Bone and the Bone-Implant Interface. Boca Raton, FL: CRC Press; 2000. pp. 385–406. [Google Scholar]
- Ferretti JL, Capozza RF, Mondelo N, et al. Interrelationships between densitometrical, geometric and mechanical properties of rat femurs. Inferences concerning mechanical regulation of bone modeling. J Bone Miner Res. 1993;8:1389–1396. doi: 10.1002/jbmr.5650081113. [DOI] [PubMed] [Google Scholar]
- Ferretti JL, Capozza RF, Cointry GR, et al. Gender-related differences in the relationships between densitometric values of whole-body mineral content and lean mass in humans between 2 and 87 years of age. Bone. 1998;22:683–690. doi: 10.1016/s8756-3282(98)00046-5. [DOI] [PubMed] [Google Scholar]
- Frost HM. The mechanostat: a proposed pathogenetic mechanism of osteoporoses and the bone mass effects of mechanical and non-mechanical agents. Bone Miner. 1987;2:73–85. [PubMed] [Google Scholar]
- Frost HM. The Utah Paradigm of Skeletal Physiology. Athens: ISMNI; 2003. [Google Scholar]
- Frost HM, Ferretti JL, Jee WSS. Perspectives: some roles of mechanical usage, muscle strength and the mechanostat in skeletal physiology, disease and research. Calcif Tissue Int. 1997;62:1–7. doi: 10.1007/s002239900384. [DOI] [PubMed] [Google Scholar]
- Frotzler A, Berger M, Knecht H, et al. Bone steady-state is established at reduced bone strength after spinal cord injury: a longitudinal study using peripheral quantitative computed tomography (pQCT) Bone. 2008;43:549–555. doi: 10.1016/j.bone.2008.05.006. [DOI] [PubMed] [Google Scholar]
- Galilei G. Discorsi e dimostrazioni matematiche intorno a due nuove scienze. Madison: Wisconsin University Press; 1668. [Google Scholar]
- Goodship AE. Mechanical stimulus to bone. Ann Rheum Dis. 1992;51:4–6. doi: 10.1136/ard.51.1.4. [DOI] [PMC free article] [PubMed] [Google Scholar]
- Grampp S, Lang P, Jergas M, et al. Assessment of the skeletal status by peripheral quantitative computed tomography of the forearm: short-term in vivo and comparison to dual X-ray absorptiometry. J Bone Miner Res. 1995;10:1566–1576. doi: 10.1002/jbmr.5650101019. [DOI] [PubMed] [Google Scholar]
- Groll O, Lochmüller EM, Bachmeier M, et al. Precision and intersite correlation of bone densitometry at the radius, tibia and femur with peripheral quantitative CT. Skeletal Radiol. 1999;28:696–702. doi: 10.1007/s002560050576. [DOI] [PubMed] [Google Scholar]
- Günther M, Blickhan R. Joint stiffness of the ankle and the knee in running. J Biomech. 2002;35:1459–1474. doi: 10.1016/s0021-9290(02)00183-5. [DOI] [PubMed] [Google Scholar]
- Guo XE. Mechanical properties of cortical bone and cancellous bone tissue. In: Cowin SC, editor. Bone Mechanics Handbook. 2nd edn. Boca Raton, FL: CRC Press; 2001. [Google Scholar]
- Hall MC. The Architecture of Bone. Springfield, IL: Charles C Thomas; 1966. [Google Scholar]
- Happasalo H, Kontulainen S, Sievänen H, et al. Exercise-induced bone gain is due to enlargement in bone size without change in volumetric bone density: a peripheral quantitative computed tomography study of the upper arms of male tennis players. Bone. 2000;27:351–357. doi: 10.1016/s8756-3282(00)00331-8. [DOI] [PubMed] [Google Scholar]
- Heinonen A, Sievänen H, Kyröläinen H, et al. Mineral mass, size, and estimated mechanical strength of triple jumpers’ lower limb. Bone. 2001;29:279–285. doi: 10.1016/s8756-3282(01)00574-9. [DOI] [PubMed] [Google Scholar]
- Jarvinen TLN, Kannus P, Sievänen H. Estrogen and bone – a reproductive and locomotive perspective. J Bone Miner Res. 2003;18:1921–1931. doi: 10.1359/jbmr.2003.18.11.1921. [DOI] [PubMed] [Google Scholar]
- Kanis JA, Devogelaer JP, Gennari C. Practical guide for the use of bone mineral measurements in the assessment of treatment of osteoporosis: a proposition paper of the European Foundation for Osteoporosis and Bone Disease. Osteoporos Int. 1996;6:256–262. doi: 10.1007/BF01622743. [DOI] [PubMed] [Google Scholar]
- Kontulainen S, Sievänen H, Kannus P, et al. Effect of long-term impact-loading on mass, size, and estimated strength of humerus and radius of female racquet-sports players: a peripheral quantitative computed tomography study between young and old starters and controls. J Bone Miner Res. 2003;18:352–359. doi: 10.1359/jbmr.2003.18.2.352. [DOI] [PubMed] [Google Scholar]
- Kontulainen SA, MacDonald HM, McKay HA. Change in cortical bone density and its distribution differ between boys and girls during puberty. J Clin Endocrinol Metab. 2006;91:2555–2562. doi: 10.1210/jc.2006-0136. [DOI] [PubMed] [Google Scholar]
- Kontulainen SA, Johnston JD, Liu D, et al. Strength indices from pQCT imaging predict up to 85% of variance in bone failure properties at tibial epiphysis and diaphysis. J Musculoskelet Neuronal Interact. 2008;8:401–409. [PubMed] [Google Scholar]
- Lai YM, Qin L, Hung VWY, et al. Regional differences in cortical bone mineral density in the weight-bearing long bone shaft. A pQCT study. Bone. 2005;36:465–471. doi: 10.1016/j.bone.2004.11.005. [DOI] [PubMed] [Google Scholar]
- Liu D, Manske SL, Kontulainen SA, et al. Tibial geometry is associated with failure load ex-vivo: a MRI, pQCT and DXA study. Osteoporos Int. 2007;18:991–997. doi: 10.1007/s00198-007-0325-0. [DOI] [PubMed] [Google Scholar]
- MacDonald HM, Kontulainen SA, Mackelvie-O’Brien KJ, et al. Maturity- and sex-related changes in tibial bone geometry, strength and bone-muscle strength indices during growth: a 20-month pQCT study. Bone. 2005;36:1003–1011. doi: 10.1016/j.bone.2004.12.007. [DOI] [PubMed] [Google Scholar]
- MacDonald HM, Cooper DM, McKay HA. Anterior-posterior bending strength at the tibial shaft increases with physical activity in boys: evidence for non-uniform geometric adaptation. Osteoporos Int. 2009;20:61–70. doi: 10.1007/s00198-008-0636-9. [DOI] [PubMed] [Google Scholar]
- Martin RB, Burr DB, Sharkey NA. Skeletal Tissue Mechanics. New York: Springer; 1998. [Google Scholar]
- Mikkola TM, Sipilä S, Rantanen T, et al. Muscle cross-sectional area and structural bone strength share genetic and environmental effects in older women. J Bone Miner Res. 2009;24:338–345. doi: 10.1359/jbmr.081008. [DOI] [PubMed] [Google Scholar]
- Miller GJ, Purkey WW. The geometric properties of paired human tibiae. J Biomech. 1980;13:1–8. doi: 10.1016/0021-9290(80)90002-0. [DOI] [PubMed] [Google Scholar]
- Muller ME, Webber CE, Bouxsein ML. Predicting the failure load of the distal radius. Osteoporos Int. 2003;14:345–352. doi: 10.1007/s00198-003-1380-9. [DOI] [PubMed] [Google Scholar]
- Nieves JW, Formica C, Ruffing J, et al. Males have larger skeletal size and bone mass than females, despite comparable body size. J Bone Miner Res. 2005;20:29–35. doi: 10.1359/JBMR.041005. [DOI] [PubMed] [Google Scholar]
- Nikander R, Sievänen H, Uusi-rasi K, et al. Loading modalities and bone structures at nonweight-bearing upper extremity and weight-bearing lower extremity: a pQCT study of adult female athletes. Bone. 2006;39:886–894. doi: 10.1016/j.bone.2006.04.005. [DOI] [PubMed] [Google Scholar]
- Özkaya N, Nordin M. Fundamentals of Biomechanics. New York: Springer; 1998. [Google Scholar]
- Pang MYC, Ashe MC, Eng JJ. Tibial bone geometry in chronic stroke patients: influence of sex, cardiovascular health, and muscle mass. J Bone Miner Res. 2008;23:1023–1030. doi: 10.1359/jbmr.080224. [DOI] [PMC free article] [PubMed] [Google Scholar]
- Parfitt AM. Misconceptions (2): Turnover is always higher in cancellous than in cortical bone. Bone. 2002;30:807–809. doi: 10.1016/s8756-3282(02)00735-4. [DOI] [PubMed] [Google Scholar]
- Piziali RL, Hight TK, Nagel DA. Geometric properties of human leg bone. J Biomech. 1980;13:881–885. doi: 10.1016/0021-9290(80)90176-1. [DOI] [PubMed] [Google Scholar]
- Rantalainen T, Heinonen A, Komi PV, et al. Neuromuscular performance and bone structural characteristics in young healthy men and women. Eur J Appl Physiol. 2008;102:215–222. doi: 10.1007/s00421-007-0575-8. [DOI] [PubMed] [Google Scholar]
- R-Development Core Team . R: A Language and Environment for Statistical Computing. Vienna: R Foundation for Statistical Computing; 2008. [Google Scholar]
- Rittweger J. Physiological targets of artificial gravity: adaptive processes in bone. In: Clement G, Burkey A, editors. Artificial Gravity. Berlin: Springer; 2007. pp. 191–231. [Google Scholar]
- Rittweger J, Beller G, Ehrig J, et al. Bone-muscle strength indices for the human lower leg. Bone. 2000;27:319–326. doi: 10.1016/s8756-3282(00)00327-6. [DOI] [PubMed] [Google Scholar]
- Rittweger J, Michaelis I, Giehl M, et al. Adjusting for the partial volume effect in cortical bone analysis of pQCT images. J Musculoskelet Neuronal Interact. 2004;4:436–441. [PubMed] [Google Scholar]
- Rittweger J, Gerrits K, Altenburg T, et al. Bone adaptation to altered loading after spinal cord injury: a study of bone and muscle strength. J Musculoskelet Neuronal Interact. 2006;6:269–276. [PubMed] [Google Scholar]
- Rittweger J, Simunic B, Bilancio G, et al. Bone loss in the lower leg during 35 days of bed rest is predominantly from the cortical compartment. Bone. 2010;46:137–147. doi: 10.1016/j.bone.2009.01.001. [DOI] [PubMed] [Google Scholar]
- Rubin CT, Lanyon LE. Dynamic strain similarity in vertebrates; an alternative to allometric limb bone scaling. J Theor Biol. 1984;107:321. doi: 10.1016/s0022-5193(84)80031-4. [DOI] [PubMed] [Google Scholar]
- Rubin CT, Lanyon LE. Kappa Delta Award paper. Osteoregulatory nature of mechanical stimuli: function as a determinant for adaptive remodeling in bone. J Orthop Res. 1987;5:300–310. doi: 10.1002/jor.1100050217. [DOI] [PubMed] [Google Scholar]
- Russo CR, Lauretani F, Bandinelli S, et al. Aging bone in men and women: beyond changes in bone mineral density. Osteoporos Int. 2003;14:531–538. doi: 10.1007/s00198-002-1322-y. [DOI] [PubMed] [Google Scholar]
- Schilling T, Mueller M, Minne HW, et al. Mineral apposition rate in rat cortical bone: physiologic differences in different sites of the same tibia. J Bone Miner Res. 1992;7(Suppl 2):S429–S432. doi: 10.1002/jbmr.5650071412. [DOI] [PubMed] [Google Scholar]
- Schneider P, Reiners C, Cointry GR, et al. Bone quality parameters of the distal radius as assessed by pQCT in normal and fractured women. Osteoporos Int. 1991;12:639–646. doi: 10.1007/s001980170063. [DOI] [PubMed] [Google Scholar]
- Swartz SM, Bennett MB, Carrier DR. Wing bone stresses in free flying bats and the evolution of skeletal design for flight. Nature. 1992;359:726–729. doi: 10.1038/359726a0. [DOI] [PubMed] [Google Scholar]
- Teague MR. Image analysis via the general theory of moments. J Opt Soc Am. 1980;70:920–930. [Google Scholar]
- Tommasini SM, Nasser P, Schaffler MB, et al. Relationship between bone morphology and bone quality in male tibias: implications for stress fracture risk. J Bone Miner Res. 2005;20:1372–1380. doi: 10.1359/JBMR.050326. [DOI] [PubMed] [Google Scholar]
- Tortora GJ, Derrickson BH. Principles of Anatomy and Physiology. 11th edn. Hoboken, NJ: Wiley; 2006. [Google Scholar]
- Turner CH. Homeostatic control of bone structure – an application of feedback theory. Bone. 1991;12:203–207. doi: 10.1016/8756-3282(91)90043-i. [DOI] [PubMed] [Google Scholar]
- Uusi-Rasi K, Sievänen H, Kannus P, et al. Influence of weight reduction on muscle performance and bone mass, structure and metabolism in obese premenopausal women. J Musculoskelet Neuronal Interact. 2009;9:72–80. [PubMed] [Google Scholar]
- Wainwright SA, Biggs WD, Currey JD, et al. Mechanical Design in Organisms. London: Edward Arnold; 1976. [Google Scholar]
- Wehner T, Claes L, Simon U. Internal loads in the human tibia during gait. Clin Biomech (Bristol, Avon) 2009;24:299–302. doi: 10.1016/j.clinbiomech.2008.12.007. [DOI] [PubMed] [Google Scholar]
- Wolff J. Das Gesetz der Transformation der Knochen. Berlin: Hirschwald; 1892. [Google Scholar]
- Yamada H, Evans FG. Strength of Biological Materials. Baltimore: Williams & Wilkins; 1970. [Google Scholar]