

Abstract
Sensory evaluation of food involves endogenous opioid mechanisms. Bulimics typically limit their food choices to low fat “safe foods” and intermittently lose control and binge on high fat “risk foods”. The aim of this study was to determine whether the oral sensory effects of a fat versus a non-fat milk product (i.e., traditional versus non-fat half-and-half) resulted in different subjective and hormonal responses in bulimic women (n=10) compared with healthy women (n=11). Naltrexone (50 mg PO) or placebo was administered 1 h before, and blood sampling began 30 min prior to and 29 min after, a 3 min portion controlled modified sham-feeding trial. Following an overnight fast, three morning trials (Fat, Naltrexone; Fat, Placebo; and Non-Fat, Placebo) were administered in a random double-blind fashion separated by at least 3 days. Overall, there were no differences between Fat and Non-Fat trials. Hunger ratings (p<0.001) and pancreatic polypeptide levels (p<0.05) were higher for bulimics at baseline. Bulimics also had overall higher ratings for nausea (P<0.05), fatty taste (P<0.01), and fear of swallowing (P<0.005). Bulimics had ∼40% higher total ghrelin levels at all time points (P<0.001). Hormones and glucose levels were not altered by the modified sham-feeding paradigm. Naltrexone, however, resulted in an overall increase in blood glucose and decrease in ghrelin levels in both groups (P<0.05, for both). These data suggest bulimic women have different orosensory responses that are not influenced by opioid receptor antagonism, evident in hormonal responses, or dependent on the fat content of a similarly textured liquid.
Keywords: Eating disorders, modified sham-feeding, opiates, insulin, taste, hedonics, bulimia
Introduction
Bulimia nervosa (BN) is an eating disorder characterized by repeated bouts of compulsive binge eating and inappropriate compensatory behaviors, such as fasting, excessive exercise, or self-induced vomiting [1]. Binge eating episodes are usually distinguished by a sense of a loss of control with the overconsumption of calorie-dense “risk” foods (i.e., high fat/high carbohydrate) in a relatively short amount of time [2]. Typically, the predominant macronutrient of binge foods is fat, while non-binge foods are limited to low-calorie/low-fat choices [3-5]. Data has implied not only that a food preference shift may be involved in the avoidance of calorie–rich (i.e., high fat) foods, but also that such a shift may be a state-related consequence of bulimic behaviors [6, 7]. Thus, a sensory or perceptive alteration in the evaluation of food likely contributes to the eating patterns in BN.
The orosensory stimulation of fat has been traditionally thought of as being a function of texture and viscosity, but accumulating data indicates that there is specific taste representation for dietary fat [8-10]. The purpose of this experiment was to determine whether the oral sensory responses from a fat liquid versus a non-fat liquid were different in subjects with BN compared with healthy controls.
Differences in the evaluative processes of food are likely to be mediated by endogenous opioids, known to be involved in the positive feelings and emotions associated with eating [11]. Opioid antagonists, such as naltrexone and naloxone, have been shown to selectively reduce both the intake of and hedonic ratings for highly palatable foods [11-13]. Endogenous opioids also have been implicated in eating disorders [14]. Circulating levels of beta-endorphin and gustatory cortex mu-opioid receptor availability have been reported to be correlated with bulimic eating pathology [15, 16]. It is possible that abnormalities in the perceptions and hedonic ratings of sweet –fat foods in BN result from alterations in the orosensory phase of eating and the endogenous opioid system. In this study we used a single dose of oral naltrexone (50 mg), a dose sufficient to produce blockade of central mu-opioid receptors [17], to test the hypothesis that differences in subjective ratings between bulimics and controls are influenced by opioid mechanisms.
For this study, the subjective ratings and oral sensory response to the liquid stimuli were assessed by using a modified sham-feeding preparation. Similar sham-feeding paradigms have been used to evaluate a number of aspects related to eating pathologies [18-20]. For instance, modified sham-feeding has been used to assess the positive feedback response produced by food [21], evaluate the phobic cognitions in eating disordered populations [19], and measure hormones involved in the preparatory process or “cephalic phase” of eating [22-24]. In this particular study, the hormonal responses to the liquid stimuli were examined by measuring glucose, insulin, ghrelin and pancreatic polypeptide. All of which have been shown to be in elevated during the cephalic phase of eating solid foods [22, 25, 26]. This is the first study to measure this profile of hormones in response to a modified sham-feeding preparation in women with BN compared with healthy women. Such comparisons can provide a basis for studying the hormonal state-dependent changes in BN.
Subjects and Methods
Subjects
Participants were women between 18-42 years of age. A total of 11 women meeting DSM-IV criteria for bulimia nervosa binge/purge subtype were recruited from the inpatient Johns Hopkins University Eating Disorders Program (n= 4) or by local advertisement (n=7). One outpatient was non-compliant with the fasting request on one trial and the sipping and spitting procedure on the retrial, she was removed from the study and her data were not used in the analyses. The data used in this study, therefore, were from 10 women with bulimia nervosa. Most bulimics were not taking prescription medications. Two inpatients were actively taking selective serotonin transporter inhibitors (SSRI) during the study. Participants enrolled in the inpatient program began testing in the first three days of treatment and testing was done in addition to receiving standard clinical care. Although all outpatients were offered treatment during the initial visit by our research staff, none were actively enrolled in a treatment program at the start of the study. The control group consisted of 11 women without an eating disorder recruited from local environs. One control subject was taking an oral contraceptive; all others were drug-free. Menstrual cycle histories were not assessed in any of the subjects. Controls, however, were matched on age, height, weight, and education and all subjects were screened by a two-page questionnaire, which included the SCOFF [27]. The SCOFF is a four question screening instrument for eating disorders. The SCOFF has good negative predictive value for less than 2 positive responses [28]. The SCOFF questions are “Do you make yourself Sick because you feel uncomfortably full? Do you worry you have lost Control over how much you eat? Have you recently lost more than One stone in a 3 month period? Do you believe yourself to be Fat when others say you are too thin? Would you say that Food dominates your life?”. Answering to yes to two SCOFF questions, suggested a person might have an eating disorder [27]. Potential subjects were excluded if they were pregnant or breast feeding, allergic to opiates, had a metabolic disease (e.g., diabetes mellitus), abused alcohol or recreational drugs or were not willing to fast overnight (> 12 h). Participants met with a research staff member following written informed consent procedures and prior to the first testing day. Potential subjects were told they were participating in a study to determine the differences in taste preference and hormone responses between women with and without BN. During the initial interview height and weight were measured, all subjects completed the Eating Attitudes Test (EAT-26) questionnaire [29] and were instructed in and practiced the modified sham-feeding procedure with water. The EAT-26 is a 26-item widely used self report questionnaire used to screen for eating disorders. It has good reliability and validity[30]. A cut-off score of 20 is generally accepted as differentiating individuals at higher risk of having an eating disorder [29]. All control subjects had EAT scores below 20. Bulimic subjects were also asked to fill out an additional two-page questionnaire addressing the frequency and severity of their binge eating and use of inappropriate compensatory behaviors over the past 8-weeks. The frequencies of bulimic behaviors were categorically assessed by having the subjects check one of the following; “Never”, “Once a month or less”, “Several times a month”, “Once a week”, “Once a day”, or “More than once a day”. Severity of binge eating in the past 8-weeks was evaluated by asking them to rate the caloric content of a typical binge by the following categories; “less than 500”, “500-1000”, “1000-1500”, “1500-2000” or “more than 2000 calories”. All procedures and consent forms were approved by the Johns Hopkins University School of Medicine Institutional Review Board.
Pre-Test procedures
On the day prior to testing subjects received a reminder email or a phone call instructing them to abstain from eating or drinking (except water) after 2000 h that evening. All subjects arrived at the Johns Hopkins University outpatient General Clinical Research Center (GCRC) at 0830 h on the following day for testing. Overnight fasting status was verified by blood glucose sampling using a fingerstick and a handheld glucometer (Freestyle, Abbott Laboratories) and a urine pregnancy test was performed. Subjects were excluded from the study if their blood glucose was >100 mg/dL or if their pregnancy test was positive. Three testing sessions were conducted at least 3 days apart with all sessions being completed within an 8 to 14 day time span.
Blood sampling and medication
Following the blood glucose and pregnancy test, an indwelling heplock catheter was placed in the cephalic vein and the test dose of oral medication, either placebo or naltrexone (50 mg) was administered by the GCRC nursing staff before 0900h (i.e., 1 h before the modified sham-feeding). The naltrexone dose used has been shown to produce plasma levels that completely saturate brain opiate receptors for up to 4 hr [17]. Subjects were told they would receive a medication that may or may not reduce palatable food intake, but were not informed as to whether they received placebo or naltrexone at each testing session. The person administering the test session was also blinded to whether the subject was receiving placebo or naltrexone. Following an acclimatization period of resting quietly for 30 min, three baseline blood samples were taken at 0930 h, 0945 h, and 0959 h. Each blood collection involved withdrawal of 1 ml of blood, which was discarded, and subsequent collection of 4 ml of blood into EDTA containing vacutainer tubes on ice. Beginning immediately following the sham-feeding, 10 blood samples were taken over a 29 min period. Samples were drawn every 2 min for 14 min and then every 5 min for 15 min.
Modified sham-feeding procedure
The taste stimulus was either traditional (FAT; 30 ml, 3 g of fat, 1g of carbohydrates, 40 Kcal) or fat-free (NON-FAT; 30 ml, 0 g of fat, 3 g of carbohydrates, 20 Kcal) half and half (generously donated by Land O' Lake) at room temperature. To mask any subtle taste differences between the half and half solutions and to increase palatability, 1.16 g of Swiss Miss Fat-Free cocoa (0 g of Fat, 0.75 g carbohydrates, 3.57 Kcal) was added to each 30 ml of half and half. The modified sham procedure began at 1000 h for each test session and consisted of subjects “sipping and spitting” 30 ml aliquots of either the fat or non-fat containing liquid in 9 opaque plastic cups over 3 min (total= 270 ml). Research staff instructed the subjects “to sip” the entire aliquot and to “hold it in your mouth and concentrate on the flavor, but not to swallow”. After a period of 20 s, the subjects were directed to “spit and take the next cup”. The expectorated volume was collected by funnel into an opaque container and measured to confirm that subjects did not swallow the liquid. Subjects were not informed of the two different solutions being tested and, as with the naltrexone, the fat and non-fat half and half administration was double blinded. In order to minimize subject attrition and to ensure that all trials were completed within 14 days a non-fat, naltrexone arm was not conducted. Since we recruited our bulimic cohort from both inpatient treatment and the community, all testing was performed within 2 weeks to avoid confounding the results with potential state-related endocrine changes in treated inpatients resulting from normalization of eating patterns and abstinence from bulimic behaviors.
Visual Analog Scales
Subjects rated their “Hunger” and “Nausea” levels using a visual analog scale immediately prior to, and 4 min, 14 min, and 29 min after the modified sham-feeding session. At the 4 min time point, subjects rated both taste properties (i.e., fatty taste and pleasantness) and fear of swallowing. The scale was a 100 mm horizontal line preceded by, for example, “How hungry are you right now?” and anchored on the left by “Not at all” and on the right by “Extremely”. Subjects indicated their responses with a vertical mark on the 100 mm horizontal line for each question. Similar methods were used to assess the “Fatty Taste”, where subjects were asked to focus on the richness or creaminess of taste. For “Good Taste”, they were asked “how good was the taste?” and for “Fear of Swallowing”, they were asked “how afraid they were to swallow the solutions?”. They were also asked the level of “Nausea” or how “nauseated they felt?”.
Plasma hormones and blood parameters
Plasma samples were processed and handled according to manufacture guidelines for commercially available radioimmunoassays. The samples were run in duplicate and were processed for insulin (Millipore, sensitivity; 2μU/ml; intra-assay variation ∼3%, inter-assay variation ∼5%), total ghrelin (Millipore, sensitivity: 100 pg/ml; intra-assay variation ∼6%, inter-assay variation ∼12%) and pancreatic polypeptide (Alpco diagnostic; sensitivity 3 pmol/L; intra-assay variation ∼3%, inter-assay variation ∼4%) levels. Plasma glucose levels were measured with a Beckman glucose analyzer (sensitivity; 1 mg/dL intra-assay variation ∼2%, inter-assay variation ∼3%). To control for variability for all assays, each batch contained plasma matched by trial and time points from both bulimic and control subjects. Glucose and insulin levels were measured in all samples, while ghrelin and pancreatic polypeptide levels were measured at 4, 14, and 29 min post sham-feeding. The 6 min sample was also measured for pancreatic polypeptide, because pancreatic polypeptide has been shown to reach maximal levels 4-6 min following a stimulus [25]. Plasma obtained from one control subject was only enough for three assays, so the pancreatic polypeptide for the control data set is from a sample size of 10.
Statistical analysis
Subject characteristics (age, BMI, lifetime highest BMI, EAT score) were analyzed by independent t-tests. Because the non-fat half-and-half was not presented with naltrexone (i.e., non-fat, naltrexone), the two independent variables were paired and analyzed as trials (i.e., fat, placebo; non-fat, placebo; and fat, naltrexone). Visual analog scale data for “Hunger” and “Nausea” were analyzed by two-way repeated measures ANOVA, while “Fatty Taste”, “Good Taste” and “Fear of Swallowing” were analyzed with a one-way repeated measure ANOVA. An analysis of covariance (ANCOVA) was used to determine whether baseline hunger values influence any other subjective ratings. Two-way repeated measures ANOVAs were used to determine the change in blood glucose and hormone values. The between grouping factor was condition (BN vs. Controls) and the repeated measures were trials (Fat, Placebo; Non-fat, Placebo; and Fat, Naltrexone) and time of sampling (baseline, 4 min, 14 min, etc.). Oneway ANOVAs with repeated measures were used to determine differences between baseline blood values and areas under the curve (AUC) for each hormone values. Post-hoc comparisons were made when appropriate with Neuman-Keuls tests. Correlation coefficients and t-test of slope = 0 were used to determine the relationship between subjective ratings and between subjective ratings and hormone values. All statistical analyses were performed with Statistica 6.0 software (StatSoft Inc.) and significance was set at α = 0.05.
Results
Table 1 illustrates the characteristics of the bulimic and control subjects. There were no differences in age, BMI (kg/m2), or lifetime highest BMI. Bulimics had significantly higher EAT-26 score (t = -6.8, p<0.0001). All bulimics were of the purging subtype and engaged in vomiting at the same frequency as bingeing (i.e., ≥ several times a week) over the past 8-weeks. The frequencies of other behaviors are also illustrated in Table 2. The caloric content of a typical binge eating episode over the past 8-weeks for BN subjects was as the follows; 1 reported 500-1000 Kcal, 1 subject reported 1000-1500 Kcal, 2 subjects reported 1500-2000 Kcal and 6 subjects had typical binges greater than 2000 Kcal. The duration of illness ranged from 3 to 10 years mean (SD) 7.4 ± 4.4 years for overall bulimic populations. Stratifying the data based on recruitment population revealed inpatients had a longer duration of illness 9.8± 5.4 years, compared with the outpatients 6.2± 3.5 years.
Table 1.
Subject Characteristics
| Bulimia nervosa (n=10) |
Controls (n=11) |
|
|---|---|---|
| Age | 23.8 ± 4.6 | 24.8 ± 6.45 |
| Body Mass Index (BMI; kg/m2) | 21.9 ± 1.8 | 23.1 ± 2.68 |
| Lifetime Highest BMI | 24.7 ± 0.92 | 24.6 ± 4.94 |
| Eating Attitudes Test (26-item) | 36.2 ± 15.9* | 2.8 ± 3.6 |
Values shown are means ± standard deviation
p<0.001
Table 2.
Frequency of eating behaviors in women with BN during the past 8 weeks
| Never | Once a month | Several times a month | Once a week | Several times a week | Once a day | More than once a day | |
|---|---|---|---|---|---|---|---|
| Binge Eating | - | - | - | - | 5 | 2 | 3 |
| Vomiting | - | - | - | - | 5 | 2 | 3 |
| Laxative Use | 4 | 2 | 1 | - | 3 | - | - |
| Diet Pills | 8 | - | - | 1 | - | 1 | - |
| Enemas | 8 | 1 | 1 | - | - | - | - |
| Exercise to Control Weight | 4 | - | 1 | 2 | 2 | - | 1 |
| Skipping Meals | - | - | 1 | 1 | 5 | 2 | 1 |
| Restricting Food Portions | - | - | - | - | 5 | 2 | 3 |
| Restricting Food Choices to Low Fat/Calorie Items | - | - | - | - | 3 | 3 | 4 |
| Chewing and Spitting Food | 5 | - | 2 | - | 2 | 1 | - |
As shown in Figure 1A, there was a time effect for hunger ratings [F(3, 57)=5.04, P<0.005] and a condition × time interaction [F(3, 57)=3.75, p<0.05]. Post-hoc testing revealed bulimics had higher hunger baseline scores compared with their rating at 4, 14, and 29 min after the modified sham-feeding session (p<0.01 for all). Bulimics also had overall higher nausea ratings [F(1, 17)=5.21, P<0.05], see Figure 1B. When baseline hunger rating was a covariate, bulimics still demonstrated higher nausea ratings [F(1,246) =6.43, p<0.05)].
Figure 1. Subjective ratings (mean ± SEM) of hunger and nausea before and after the modified sham-feeding session at all three trials.
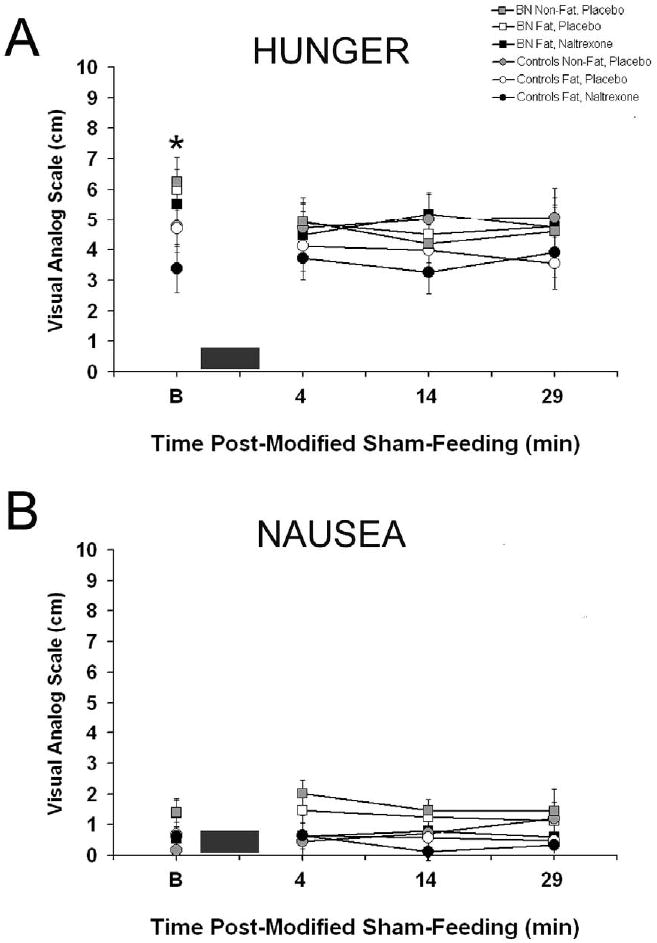
A: Bulimic subjects had overall higher hunger ratings and higher baseline values as indicated by * (p< 0.05). B: Bulimics also had overall higher nausea ratings, but there was no trial, time or interaction effects. In both figures, the black box represents the 3 min modified sham-feeding session.
The subjective ratings of the food stimulus after the sip and spit procedure also demonstrated that bulimics had overall higher fatty taste subjective ratings [F(1, 19)=10.51, P<0.005] and were more fearful of swallowing [F(1, 19)=8.34, P<0.01], Figure 2. Bulimics still have significantly higher values when baseline hunger was a covariate for both subjective responses, Fatty Taste [F(1,60) =13.02, p<0.001] and Fear of Swallowing [F (1,60)=15.31, p<0.001)]. Fatty taste and fear of swallowing ratings were correlated (R=0.29, p<0.05).
Figure 2. Subjective ratings (mean ± SEM) of fatty taste and fear of swallowing 4 min after the modified sham-feeding session at all three trials.
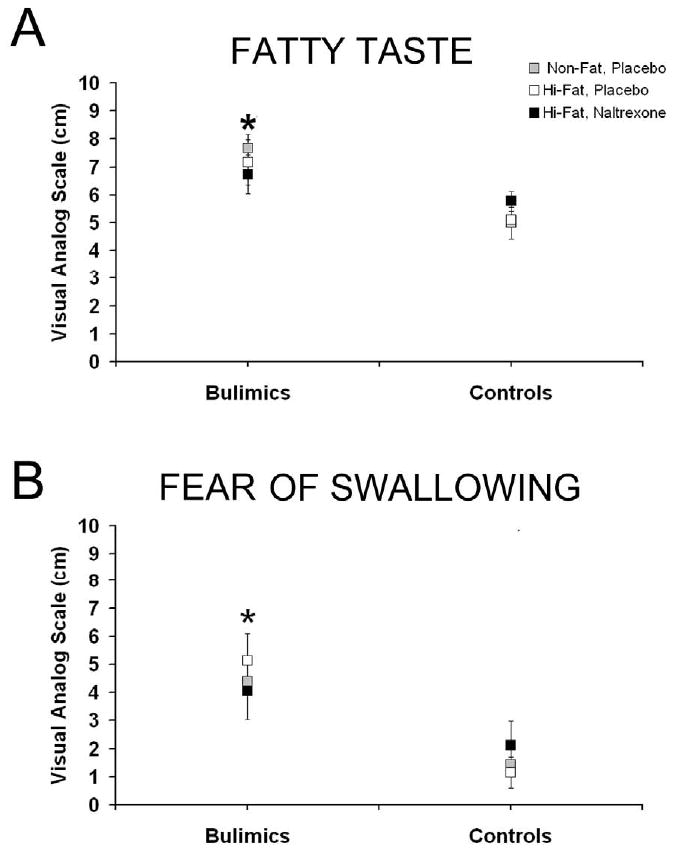
A: Bulimic subjects had overall higher fatty taste ratings, as indicated by * (p< 0.05). B: Bulimics were also more fearful of swallowing the solutions as indicated by * (p< 0.05).
Baseline values for plasma glucose, insulin, total ghrelin, and pancreatic polypeptide are listed in table 3. The baseline glucose levels were higher in Fat, naltrexone trials, but this difference only approached significance [F(2, 38)=3.18, p=0.052]. For the two-way repeated measures ANOVA for individual time points there was an overall trial effect [F(2, 38)=4.13, P<0.05] and a time effect [F(10, 190)=2.31, P=<0.05]. There were no significant differences between bulimics and controls. Post-hoc testing revealed overall blood glucose was higher in the Fat, naltrexone trials compared with other placebo trials (p<0.05). No differences were revealed at any specific time point or from baseline values. In the AUC for glucose, there was also a significant elevation in the naltrexone trials (p<0.05), see Figure 3. The glucose AUC for non-fat, placebo; high-fat, placebo; and high-fat, naltrexone trials for the bulimics were: 2360 ± 89, 2380 ± 49, and 2465 ± 81 mg/dl per 29 min compared with controls values of: 2455 ± 36, 2435 ± 36, and 2555 ± 36 mg/dl per 29 min, respectively. For insulin levels, the two-way repeated measures ANOVA for individual time points demonstrated an overall time effect [F(10, 190)=2.3, P<0.05]. Post-hoc testing revealed a difference between 6 min and 19 min (p<0.05), but did not reveal any difference between post-modified sham-feed insulin and baseline values. There was a trend for bulimics to have lower insulin values, see Figure 4.
Table 3.
Overnight fasted (>12 h) baseline hormone values before the modified sham-feeding trials.
| Glucose (mg/dL) | Insulin (μU/ml) | Ghrelin (total) (pg/ml) | Pancreatic Polypeptide (pmol/L) | |||
|---|---|---|---|---|---|---|
| Bulimics (Baseline) | ||||||
| Non-Fat, Placebo | 80 ± 3 | 7.7 ± 1 | 884 ± 67 | 16.8 ± 1 | ||
| Fat, Placebo | 80 ± 2 | 8.8 ± 1 | 878 ± 82* | 17.5 ± 2 | * | |
| Fat, Naltrexone | 85 ± 4 | 8.3 ± 1 | 733 ± 75*# | 17.8 ± 2 | ||
| Controls (Baseline) | ||||||
| Non-Fat, Placebo | 85 ± 1 | 8.7 ± 1 | 525 ± 40 | 13.8 ± 1 | ||
| Fat, Placebo | 84 ± 1 | 8.7 ± 1 | 484 ± 35 | 13.0 ± 1 | ||
| Fat, Naltrexone | 88 ± 2 | 9.5 ± 1 | 470 ± 44 # | 13.3 ±1 |
Values ± SEM, naltrexone(50 mg PO) was adminstered 30 min before first baseline blood sampling
p<0.05 significantly different from control group
p<0.05 overall significantly different from placebo trials
Figure 3. Blood glucose (mean ± SEM) levels before and after the modified sham-feeding session and glucose (mg/dL) area under the curve at all three trials.
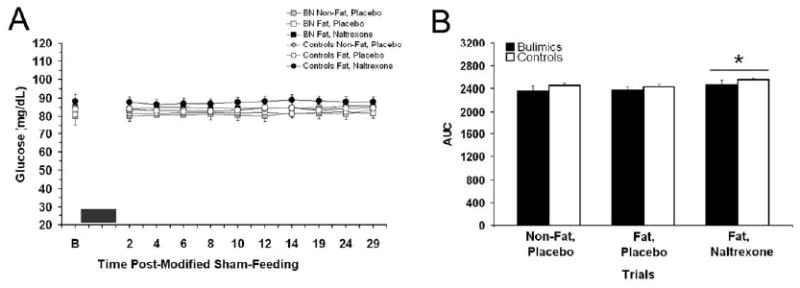
A: There was an overall effect for glucose levels to be higher at the fat, naltrexone trials. The black box represents the 3 min modified sham-feeding session. B: Blood glucose AUC was significantly higher at the Fat, naltrexone trials compared with the other two placebo trials, as indicated by * (p<0.05).
Figure 4. Plasma insulin (mean ± SEM) levels before and after the modified sham-feeding session and insulin (μU/mL) area under the curve at all three trials.
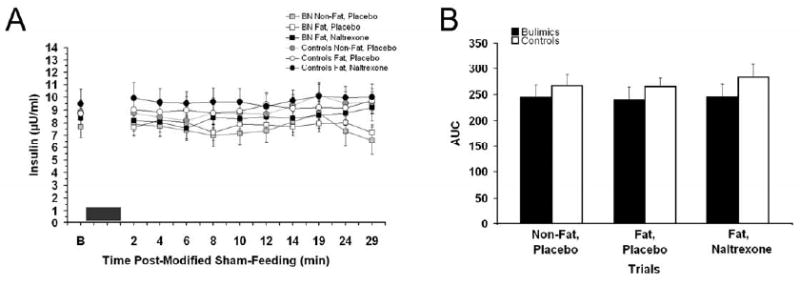
A: There was an overall effect for time effect for insulin, but no values were significantly different from baseline levels. The black box represents the 3 min modified sham-feeding session. B: Insulin AUC was not significantly different between trials.
Baseline total ghrelin levels were approximately 2-fold higher in the bulimics compared with controls [F(1, 19)=21.0, P<0.005] and there was an overall trial effect [F(2, 38)=5.4, P<0.01] with reductions in the ghrelin levels with naltrexone treatment (p<0.05), see Table 3. Data from bulimics and controls reveal a correlation between baseline total ghrelin levels and baseline hunger ratings that approached significance (R=0.25, p=0.05). Within group correlations were not significant. Ghrelin levels were elevated throughout the sham-feeding session in the bulimics [F(1, 19)=25.4, P<0.0001] with similar elevation present in the AUC analysis [F(1, 19)=23.1, p<0.001]. Post-hoc testing revealed that bulimics had significantly greater levels than controls at all time points (p<0.001) and bulimics had greater AUC at all trials (p<0.05). In addition, there was an overall trial difference [F(2, 38)=4.4, P<0.05] with naltrexone treatment reducing total ghrelin levels (p<0.05). The AUC for total ghrelin was also different for trials [F(2, 38)=4.4, P<0.05], with a significant reduction in the naltrexone condition, see Figure 5. The total ghrelin AUC for non-fat, placebo; high-fat, placebo; and high-fat, naltrexone trials for the bulimics were: 26517 ± 2455, 24875 ± 2918, and 22818 ± 1650 pg/ml per 29 min compared with controls values of: 14411 ± 1138, 14704 ± 775, and 12845 ± 1125 pg/ml per 29 min, respectively.
Figure 5. Plasma ghrelin (total; mean ± SEM) levels before and after the modified sham-feeding session and insulin (pg/mL) area under the curve at all three trials.
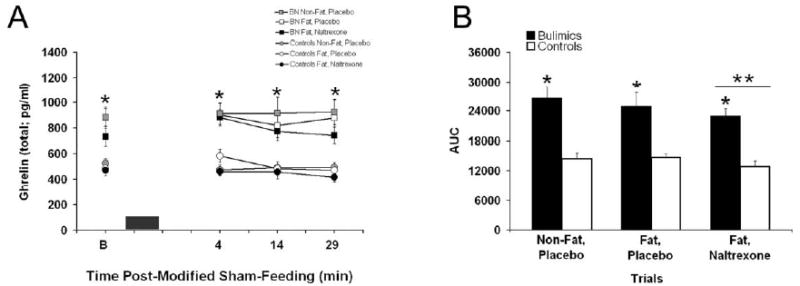
A: Bulimics had higher ghrelin levels at all time points as indicated by * (p<0.05). The black box represents the 3 min modified sham-feeding session. B: Plasma ghrelin AUC was significantly higher in bulimics compared with controls (*, p<0.05) and ghrelin levels were also significantly reduced in the naltrexone trials (**, p<0.05).
Baseline values for pancreatic polypeptide were higher for bulimics [F(1, 18)=5.2, p<0.05]. Data from bulimics and controls revealed a significant correlation between baseline pancreatic polypeptide levels and baseline hunger levels (R=0.28, p<0.05). No within group correlations were significant. There were no significant differences in the individual time points for pancreatic polypeptide values between conditions across trials and sampling times, or their interactions, following the modified sham-feeding (Data not shown).
Discussion
The purpose of this study was to examine the oral sensory and cephalic response to fat and non-fat containing liquids in purging bulimics. This was done by using a portion controlled modified sham-feeding of two similarly textured liquids that differed in their fat and calorie content. Although we did not observe any differences in the subjective ratings or hormonal responses between the two liquids, we did observe differences between bulimics and controls.
For the subjective ratings, bulimics compared with controls had higher hunger ratings at baseline. Hunger ratings between the two groups were not different after the modified sham-feeding session, suggesting that orosensory stimulation by both liquids was sufficient to reduce hunger ratings in bulimics. Reduction in hunger following orosensory stimulation may modulate the drive for chewing and spitting behaviors often seen in eating disorder patients [31, 32]. In this study 50% (n=5) of the bulimic group endorsed chewing and spitting at least several times a month. Compared with controls, bulimics also consistently rated the liquids fattier tasting, regardless of the fat content of the liquid (0% fat versus 10.5% fat). This finding is consistent with results from Sunday and Halmi [7], who found that bulimics have higher fattiness ratings for a variety of unsweetened dairy products. Although in contrast to other labs [6, 7], we did not find any differences in the pleasantness (i.e., hedonic) rating between bulimics and controls. It is worth noting, however, that the subjective ratings in this study were assessed at one fatness and sweetness concentration rather than over a range of concentrations as done by others [6, 7]. To address “phobic” cognitions regarding the tasted solutions, we also asked the subjects to rate “how fearful” they were of “swallowing the solutions?”. Bulimics endorsed fear of swallowing more than controls and this fear response across subjects was positively correlated with fatty taste. In a study by Eiber and colleagues [19] comparing hedonic ratings of varying sucrose solutions with different post-ingestive consequences (i.e., spit vs. swallowed) in eating disorder populations, fear of swallowing or the “drive for thinness” subscore on an inventory of eating disorder psychopathology (e.g. EDI) accounted for the differences in hedonic ratings between the spit and swallowed conditions. Fear of swallowing in that study, however, was only assessed in the swallowed condition. Our findings additionally suggest that orosensory stimulation and perceived fattiness of a tastant, similar to other cues regarding eating or weight gain [33], contribute to higher fear ratings in BN compared to control subjects.
Bulimics displayed baseline hormonal differences after an overnight fast (>12 h) compared with controls and had significantly elevated baseline ghrelin and pancreatic polypeptide. Pancreatic polypeptide is a 36 amino acid peptide released from the pancreas in response to meal-related stimulus [34]. Since its meal-related pancreatic polypeptide secretion is dependent on an intact vago-vagal reflex [35], pancreatic polypeptide can be viewed a marker for vagal efferent activity [36]. Our finding of increased fasting pancreatic polypeptide levels differs from that of two other studies with bulimics that reported no difference in pancreatic polypeptide levels between bulimics and controls following an overnight fast (12 hr) [37, 38]. These studies differed, however, from our study in the duration of treatment prior to test, inclusionary criteria of subjects, and severity of bulimic behaviors.
We also observed almost two-fold higher fasting ghrelin level in the BN group. Unlike with pancreatic polypeptide, these ghrelin levels remained elevated in the bulimics throughout the study session. Ghrelin is a 28 amino acid appetite-stimulating gastric peptide [39]. Endogenous ghrelin levels are highest immediately before a meal and exogenous administered ghrelin increases food intake and hunger ratings [40]. Interestingly, baseline pancreatic polypeptide levels were significantly correlated with hunger, while the correlation between baseline ghrelin levels and hunger only approached significance. A meta-analysis of gut peptides in eating disorders examined the results from 8 studies, 7 of which demonstrated elevated fasting ghrelin levels in individuals with either anorexia nervosa or BN compared with controls [41]. In a recent study by Monteleone and colleagues [26] the ghrelin response to chewing and spitting a 1220 kcal lunch meal was examined in 6 binge/vomiting bulimics. Despite no differences in baseline, bulimics compared with controls did have elevated ghrelin levels 30, 90, and 120 min following the sham-feeding session [26]. In contrast, we did not observe differences from baseline ghrelin levels or in the bulimics following the modified sham-feeding of liquids. A few differences in the study design may account for the dissimilarity. First, baseline samples in the Monteleone and colleagues study were drawn a few hours after a standard breakfast (200 Kcal) rather than after an overnight fast. Because ghrelin levels are reduced following a meal [39, 40], the standard breakfast could have stabilized ghrelin to similar levels in both groups. Second, chewing and spitting requires mastication of the food stimulus, which may involve greater orosensory stimulation compared with just sipping and spitting a liquid, although this assertion has yet to be systematically tested. Previous comparisons between liquids and solid foods have reported that while chewing and spitting of a solid food, such as apple pie, increased plasma insulin levels, whereas the sipping and spiting of sweet tasting solutions did not [23]. Taken together with the findings from the Monteleone and colleagues study, ghrelin level appears to be involved in BN, although the specific role of this gastric peptide in the maintenance of bulimics behaviors requires further investigation.
In this study we also found that acute naltrexone administration resulted in changes in levels of some plasma parameters, but had no significant effect on subjective ratings. Compared to placebo, naltrexone resulted in an overall increase in blood glucose levels. Long-term treatment with naltrexone (≥5 weeks; 50 mg) has been reported to improved blood glucose clinical populations with impaired glucose homeostasis [42, 43]. The mechanism of naltrexone's glucoregulatory actions is thought to be mediated, in part, by blockade of endogenous opioid action on the pancreatic islet cells [44, 45]. Acute effects of naltrexone on glucose and insulin levels have not been examined in clinical populations, however, single doses of naltrexone has been shown to increase blood glucose levels during stress in mice [46]. Naltrexone, in this case, increased blood glucose levels, but had no effect on insulin, in both obese and lean mice following a restraint stress. In a follow-up experiment to determine if this effect was mediated through increased sympathetic outflow, naltrexone blocked epinephrine-induced insulin secretions resulting in higher blood glucose levels. More investigation is needed to determine the mechanisms of action of opioid blockade mediated alterations in blood glucose and the physiological relevance of this effect. We additionally observed decreases in plasma ghrelin levels with naltrexone administration compared with placebo. While ghrelin has been shown to modulate pain by opioid-dependent mechanisms [47], our finding that acute naltrexone reduces ghrelin is novel. Ghrelin levels, unlike blood glucose values, were significantly different between groups at baseline, suggesting that ghrelin changes were not secondary to the elevation in blood glucose and could signify separate opioid-mediated hormonal regulation.
Several factors limit the clinical interpretations of this study. First, the ability to detect significant differences was likely diminished by the complexity of the study design and the relatively small sample size. Second, the interpretation of the lack of cephalic hormonal response could have been avoided by using a food stimulus known to initiate a cephalic response [23]. Third, improved assessment and control for some potentially influential factors in the subject population, such as the time since the last binge purge episode in the bulimics, anxiety, or level of dietary restraint, would have been helpful. Nonetheless, the findings from this study strengthen the claim that BN is accompanied by altered orosensory perceptions [6, 7], particularly concerning fat taste, and hormonal alterations [41] that are likely involved in maintaining bulimic eating behaviors. The hormonal findings suggest that elevations in pancreatic polypeptide and total ghrelin levels may represent physiological markers for active BN.
Acknowledgments
The authors would also like to thank Dr. Andrea Weiss and Mr. Matthew H. Kemm for facilitating the double blinded study design and Mr. Brian A. Mitchell and Ms. Michelle T. Chuang for their technical assistance. This study was funded in part by Johns Hopkins University General Clinical Research Center and by NIH grants DK19302 and DK078484.
Footnotes
Publisher's Disclaimer: This is a PDF file of an unedited manuscript that has been accepted for publication. As a service to our customers we are providing this early version of the manuscript. The manuscript will undergo copyediting, typesetting, and review of the resulting proof before it is published in its final citable form. Please note that during the production process errors may be discovered which could affect the content, and all legal disclaimers that apply to the journal pertain.
References
- 1.American Psychiatric Association. Diagnostic and statistical manual of mental disorders: DSM-IV. 4th. Washington, DC: American Psychiatric Association; 1994. American Psychiatric Association. Task Force on DSM-IV; p. xxvii.p. 886. [Google Scholar]
- 2.Hetherington MM. Cues to overeat: psychological factors influencing overconsumption. Proc Nutr Soc. 2007;66(1):113–23. doi: 10.1017/S0029665107005344. [DOI] [PubMed] [Google Scholar]
- 3.Hetherington MM, Rolls BJ. Dysfunctional eating in the eating disorders. Psychiatr Clin North Am. 2001;24(2):235–48. doi: 10.1016/s0193-953x(05)70220-3. [DOI] [PubMed] [Google Scholar]
- 4.Kales EF. Macronutrient analysis of binge eating in bulimia. Physiol Behav. 1990;48(6):837–40. doi: 10.1016/0031-9384(90)90236-w. [DOI] [PubMed] [Google Scholar]
- 5.Hetherington MM, Altemus M, Nelson ML, Bernat AS, Gold PW. Eating behavior in bulimia nervosa: multiple meal analyses. Am J Clin Nutr. 1994;60(6):864–73. doi: 10.1093/ajcn/60.6.864. [DOI] [PubMed] [Google Scholar]
- 6.Drewnowski A, Bellisle F, Aimez P, Remy B. Taste and bulimia. Physiol Behav. 1987;41(6):621–6. doi: 10.1016/0031-9384(87)90320-9. [DOI] [PubMed] [Google Scholar]
- 7.Sunday SR, Halmi KA. Taste perceptions and hedonics in eating disorders. Physiol Behav. 1990;48(5):587–94. doi: 10.1016/0031-9384(90)90196-b. [DOI] [PubMed] [Google Scholar]
- 8.Mattes RD. The taste of fat elevates postprandial triacylglycerol. Physiol Behav. 2001;74(3):343–8. doi: 10.1016/s0031-9384(01)00578-9. [DOI] [PubMed] [Google Scholar]
- 9.Mattes RD. Fat taste and lipid metabolism in humans. Physiol Behav. 2005;86(5):691–7. doi: 10.1016/j.physbeh.2005.08.058. [DOI] [PubMed] [Google Scholar]
- 10.De Araujo IE, Rolls ET. Representation in the human brain of food texture and oral fat. J Neurosci. 2004;24(12):3086–93. doi: 10.1523/JNEUROSCI.0130-04.2004. [DOI] [PMC free article] [PubMed] [Google Scholar]
- 11.Yeomans MR, Gray RW. Opioid peptides and the control of human ingestive behaviour. Neurosci Biobehav Rev. 2002;26(6):713–28. doi: 10.1016/s0149-7634(02)00041-6. [DOI] [PubMed] [Google Scholar]
- 12.Drewnowski A, Krahn DD, Demitrack MA, Nairn K, Gosnell BA. Naloxone, an opiate blocker, reduces the consumption of sweet high-fat foods in obese and lean female binge eaters. Am J Clin Nutr. 1995;61(6):1206–12. doi: 10.1093/ajcn/61.6.1206. [DOI] [PubMed] [Google Scholar]
- 13.Fantino M, Hosotte J, Apfelbaum M. An opioid antagonist, naltrexone, reduces preference for sucrose in humans. Am J Physiol. 1986;251(1 Pt 2):R91–6. doi: 10.1152/ajpregu.1986.251.1.R91. [DOI] [PubMed] [Google Scholar]
- 14.Bailer UF, Kaye WH. A review of neuropeptide and neuroendocrine dysregulation in anorexia and bulimia nervosa. Curr Drug Targets CNS Neurol Disord. 2003;2(1):53–9. doi: 10.2174/1568007033338689. [DOI] [PubMed] [Google Scholar]
- 15.Bencherif B, Guarda AS, Colantuoni C, Ravert HT, Dannals RF, Frost JJ. Regional mu-opioid receptor binding in insular cortex is decreased in bulimia nervosa and correlates inversely with fasting behavior. J Nucl Med. 2005;46(8):1349–51. [PubMed] [Google Scholar]
- 16.Waller DA, Kiser RS, Hardy BW, Fuchs I, Feigenbaum LP, Uauy R. Eating behavior and plasma beta-endorphin in bulimia. Am J Clin Nutr. 1986;44(1):20–3. doi: 10.1093/ajcn/44.1.20. [DOI] [PubMed] [Google Scholar]
- 17.Lee MC, Wagner HN, Jr, Tanada S, Frost JJ, Bice AN, Dannals RF. Duration of occupancy of opiate receptors by naltrexone. J Nucl Med. 1988;29(7):1207–11. [PubMed] [Google Scholar]
- 18.Drewnowski A, Shrager EE, Lipsky C, Stellar E, Greenwood MR. Sugar and fat: sensory and hedonic evaluation of liquid and solid foods. Physiol Behav. 1989;45(1):177–83. doi: 10.1016/0031-9384(89)90182-0. [DOI] [PubMed] [Google Scholar]
- 19.Eiber R, Berlin I, de Brettes B, Foulon C, Guelfi JD. Hedonic response to sucrose solutions and the fear of weight gain in patients with eating disorders. Psychiatry Res. 2002;113(12):173–80. doi: 10.1016/s0165-1781(02)00232-9. [DOI] [PubMed] [Google Scholar]
- 20.Klein DA, Schebendach JE, Brown AJ, Smith GP, Walsh BT. Modified sham feeding of sweet solutions in women with and without bulimia nervosa. Physiol Behav. 2009;96(1):44–50. doi: 10.1016/j.physbeh.2008.08.008. [DOI] [PMC free article] [PubMed] [Google Scholar]
- 21.Klein DA, Schebendach JS, Devlin MJ, Smith GP, Walsh BT. Intake, sweetness and liking during modified sham feeding of sucrose solutions. Physiol Behav. 2006;87(3):602–6. doi: 10.1016/j.physbeh.2005.12.009. [DOI] [PubMed] [Google Scholar]
- 22.Teff K. Nutritional implications of the cephalic-phase reflexes: endocrine responses. Appetite. 2000;34(2):206–13. doi: 10.1006/appe.1999.0282. [DOI] [PubMed] [Google Scholar]
- 23.Teff KL, Devine J, Engelman K. Sweet taste: effect on cephalic phase insulin release in men. Physiol Behav. 1995;57(6):1089–95. doi: 10.1016/0031-9384(94)00373-d. [DOI] [PubMed] [Google Scholar]
- 24.Teff KL, Levin BE, Engelman K. Oral sensory stimulation in men: effects on insulin, C-peptide, and catecholamines. Am J Physiol. 1993;265(6 Pt 2):R1223–30. doi: 10.1152/ajpregu.1993.265.6.R1223. [DOI] [PubMed] [Google Scholar]
- 25.Crystal SR, Teff KL. Tasting fat: cephalic phase hormonal responses and food intake in restrained and unrestrained eaters. Physiol Behav. 2006;89(2):213–20. doi: 10.1016/j.physbeh.2006.06.013. [DOI] [PubMed] [Google Scholar]
- 26.Monteleone P, Serritella C, Scognamiglio P, Maj M. Enhanced ghrelin secretion in the cephalic phase of food ingestion in women with bulimia nervosa. Psychoneuroendocrinology. 2009 doi: 10.1016/j.psyneuen.2009.07.001. [DOI] [PubMed] [Google Scholar]
- 27.Morgan JF, Reid F, Lacey JH. The SCOFF questionnaire: assessment of a new screening tool for eating disorders. Bmj. 1999;319(7223):1467–8. doi: 10.1136/bmj.319.7223.1467. [DOI] [PMC free article] [PubMed] [Google Scholar]
- 28.Cotton MA, Ball C, Robinson P. Four simple questions can help screen for eating disorders. J Gen Intern Med. 2003;18(1):53–6. doi: 10.1046/j.1525-1497.2003.20374.x. [DOI] [PMC free article] [PubMed] [Google Scholar]
- 29.Mintz LB, O'Halloran MS. The Eating Attitudes Test: validation with DSM-IV eating disorder criteria. J Pers Assess. 2000;74(3):489–503. doi: 10.1207/S15327752JPA7403_11. [DOI] [PubMed] [Google Scholar]
- 30.Garner DM, Olmsted MP, Bohr Y, Garfinkel PE. The eating attitudes test: psychometric features and clinical correlates. Psychol Med. 1982;12(4):871–8. doi: 10.1017/s0033291700049163. [DOI] [PubMed] [Google Scholar]
- 31.Guarda AS, Coughlin JW, Cummings M, Marinilli A, Haug N, Boucher M, Heinberg LJ. Chewing and spitting in eating disorders and its relationship to binge eating. Eat Behav. 2004;5(3):231–9. doi: 10.1016/j.eatbeh.2004.01.001. [DOI] [PubMed] [Google Scholar]
- 32.Kovacs D, Mahon J, Palmer RL. Chewing and spitting out food among eating-disordered patients. Int J Eat Disord. 2002;32(1):112–5. doi: 10.1002/eat.10073. [DOI] [PubMed] [Google Scholar]
- 33.Mauler BI, Hamm AO, Weike AI, Tuschen-Caffier B. Affect regulation and food intake in bulimia nervosa: emotional responding to food cues after deprivation and subsequent eating. J Abnorm Psychol. 2006;115(3):567–79. doi: 10.1037/0021-843X.115.3.567. [DOI] [PubMed] [Google Scholar]
- 34.Kojima S, Ueno N, Asakawa A, Sagiyama K, Naruo T, Mizuno S, Inui A. A role for pancreatic polypeptide in feeding and body weight regulation. Peptides. 2007;28(2):459–63. doi: 10.1016/j.peptides.2006.09.024. [DOI] [PubMed] [Google Scholar]
- 35.Taylor IL, Impicciatore M, Carter DC, Walsh JH. Effect of atropine and vagotomy on pancreatic polypeptide response to a meal in dogs. Am J Physiol. 1978;235(4):E443–7. doi: 10.1152/ajpendo.1978.235.4.E443. [DOI] [PubMed] [Google Scholar]
- 36.Taylor IL, Feldman M, Richardson CT, Walsh JH. Gastric and cephalic stimulation of human pancreatic polypeptide release. Gastroenterology. 1978;75(3):432–7. [PubMed] [Google Scholar]
- 37.Casper RC, Pandy GN, Jaspan JB, Rubenstein AH. Hormone and metabolite plasma levels after oral glucose in bulimia and healthy controls. Biol Psychiatry. 1988;24(6):663–74. doi: 10.1016/0006-3223(88)90140-0. [DOI] [PubMed] [Google Scholar]
- 38.Fujimoto S, Inui A, Kiyota N, Seki W, Koide K, Takamiya S, Uemoto M, Nakajima Y, Baba S, Kasuga M. Increased cholecystokinin and pancreatic polypeptide responses to a fat-rich meal in patients with restrictive but not bulimic anorexia nervosa. Biol Psychiatry. 1997;41(10):1068–70. doi: 10.1016/S0006-3223(97)00044-9. [DOI] [PubMed] [Google Scholar]
- 39.Moran TH. Gut peptides in the control of food intake. Int J Obes (Lond) 2009;33 1:S7–10. doi: 10.1038/ijo.2009.9. [DOI] [PubMed] [Google Scholar]
- 40.Druce MR, Wren AM, Park AJ, Milton JE, Patterson M, Frost G, Ghatei MA, Small C, Bloom SR. Ghrelin increases food intake in obese as well as lean subjects. Int J Obes (Lond) 2005;29(9):1130–6. doi: 10.1038/sj.ijo.0803001. [DOI] [PubMed] [Google Scholar]
- 41.Prince AC, Brooks SJ, Stahl D, Treasure J. Systematic review and meta-analysis of the baseline concentrations and physiologic responses of gut hormones to food in eating disorders. Am J Clin Nutr. 2009;89(3):755–65. doi: 10.3945/ajcn.2008.27056. [DOI] [PubMed] [Google Scholar]
- 42.Guido M, Romualdi D, Lanzone A. Role of opioid antagonists in the treatment of women with glucoregulation abnormalities. Curr Pharm Des. 2006;12(8):1001–12. doi: 10.2174/138161206776055895. [DOI] [PubMed] [Google Scholar]
- 43.Cucinelli F, Soranna L, Perri C, Barini A, Cento RM, Mancuso S, Lanzone A. Use of naltrexone in postmenopausal women with exaggerated insulin secretion: a pilot study. Fertil Steril. 2004;81(4):1047–54. doi: 10.1016/j.fertnstert.2003.05.036. [DOI] [PubMed] [Google Scholar]
- 44.Larsson LI. Innervation of the pancreas by substance P, enkephalin, vasoactive intestinal polypeptide and gastrin/CCK immunoractive nerves. J Histochem Cytochem. 1979;27(9):1283–4. doi: 10.1177/27.9.479572. [DOI] [PubMed] [Google Scholar]
- 45.Linari G, Agostini S, Broccardo M, Petrella C, Improta G. Regulation of pancreatic secretion in vitro by nociceptin/orphanin FQ and opioid receptors: a comparative study. Pharmacol Res. 2006;54(5):356–60. doi: 10.1016/j.phrs.2006.07.007. [DOI] [PubMed] [Google Scholar]
- 46.McCubbin JA, Surwit RS, Kuhn CM, Cochrane C, Feinglos MN. Naltrexone potentiates glycemic responses during stress and epinephrine challenge in genetically obese mice. Psychosom Med. 1989;51(4):441–8. doi: 10.1097/00006842-198907000-00007. [DOI] [PubMed] [Google Scholar]
- 47.Sibilia V, Lattuada N, Rapetti D, Pagani F, Vincenza D, Bulgarelli I, Locatelli V, Guidobono F, Netti C. Ghrelin inhibits inflammatory pain in rats: involvement of the opioid system. Neuropharmacology. 2006;51(3):497–505. doi: 10.1016/j.neuropharm.2006.04.009. [DOI] [PubMed] [Google Scholar]