

Abstract
Antigen-specific T-cell tolerance plays a critical role in tumor escape. Recent studies implicated myeloid-derived suppressor cells (MDSC) in the induction of CD8+ T-cell tolerance in tumor-bearing hosts. However, the mechanism of this phenomenon remained unclear. We have found that incubation of antigen-specific CD8+ T cells, with peptide-loaded MDSC, did not induce signaling downstream of TCR. However, it prevented subsequent signaling from peptide-loaded dendritic cells. Using double TCR transgenic CD8+ T cells, we have demonstrated that MDSC induced tolerance to only the peptide, which was presented by MDSC. T-cell response to the peptide specific to the other TCR was not affected. Incubation of MDSC with antigen-specific CD8+ T cells caused nitration of the molecules on the surface of CD8+ T cells, localized to the site of physical interaction between MDSC and T cells, which involves preferentially only TCR specific for the peptide presented by MDSC. After incubation with MDSC, only nitrotyrosine (NT) positive CD8+ T cells demonstrated profound non-responsiveness to the specific peptide; whereas NT negative CD8+ T cells responded normally to that stimulation. MDSC caused dissociation between TCR and CD3ζ molecules, disrupting TCR complexes on T cells. Thus, these data describe a novel mechanism of antigen specific CD8+ T cell tolerance in cancer.
Introduction
Antigen-specific T-cell tolerance was identified in recent years as one of the major mechanisms of tumor escape to immune destruction (1-3). Antigen-specific nature of tumor non-responsiveness explains the fact that tumor-bearing hosts are not capable of maintaining tumor-specific immune responses while still responding to other immune stimuli (4-6). T-cell tolerance in cancer has been shown to be mediated by host antigen presenting cells (APC) (7, 8) although the nature of these APC remained unclear. Recent studies have provided evidence that myeloid-derived suppressor cells (MDSC) may represent the major population of APC responsible for induction of antigen-specific CD8+ T-cell tolerance in cancer (rev. in (9)).
MDSC are the group of myeloid cells comprised of hematopoietic progenitor cells (HPC) and precursors of macrophages, DC, and granulocytes. These cells are part of normal hematopoiesis but dramatically expanded and activated in many types of cancer in mice and men. In mice MDSC share common phenotypic markers Gr-1+CD11b+ although in recent years several other markers have been suggested to describe specific subsets of these cells (9). Most importantly, MDSC also share a common trait - high potential to suppress T-cell responses. The potential mechanisms by which MDSC can contribute to T-cell non-responsiveness in cancer are starting to emerge. There is now sufficient evidence demonstrating the ability of MDSC to induce antigen-specific CD8+ T cells tolerance in cancer (10, 11). MDSC can pick up antigens, migrate to peripheral lymphoid organs, process and present these antigens to T cells (5, 12, 13). Arginase, nitric oxide (NO), and reactive oxygen species (ROS) were all implicated in MDSC mediated T-cell suppression (9). However, the molecular mechanism of CD8+ T-cell tolerance induced by MDSC remained unclear. In the present study we tried to address this question.
Materials and Methods
Mice and reagents
All mouse experiments were approved by University of South Florida Institutional Animal Care and Use Committee. Female C57BL/6 mice (6-8 weeks of age) were obtained from the National Cancer Institute. OT-1 TCR-transgenic mice (C57Bl/6–Tg(TCRαTCRβ)1100mjb) were purchased from Jackson Laboratories. Double TCR transgenic mice were described elsewhere (14). To establish tumors, C57BL/6 mice were injected s.c. with 5×10⁵ EL-4 or MC38 cells. A2L2 and 66.3 tumors were established by injecting s.c 5×10⁵ cells in Balb/C mice.
OVA-derived (H-2Kb, SIINFEKL), LCMV specific KAVYNFATC, rNEUp66 (TYVPANASL) and control H-2Kb (RAHYNIVTF) peptides were obtained from American Peptide Company. IFA and LPS were purchased from Sigma Chemical Co. All antibodies used for flow cytometry were obtained from BD Pharmingen except anti-NT (Millipore USA Inc.) and anti- pZAP-70 (Ebioscience).
Cell isolation and generation
MDSC were isolated from spleens of tumor-bearing mice using biotinylated anti-Gr-1 antibody and MiniMACS columns (Miltenyi Biotec GmbH). More than 95% of Gr-1+ cells were also CD11b+. T lymphocytes were isolated from spleens using T-cell enrichment columns (R&D Systems). DCs were generated from murine bone marrow using GM-CSF (Invitrogen) and IL-4 (R&D Systems) as described before (15). DCs were activated on day 6 of culture by overnight incubation with LPS (100 ng/ml) and enriched by centrifugation over Nycoprep A gradient (Accurate Chemicals). DCs were loaded with 10 μg/ml of control or specific peptide by 2hr incubation at 37° C.
Adoptive cell transfer and immunization
4-5 ×10⁶ of purified T cells from OT-1 TCR or double TCR transgenic mice were injected intravenously (i.v.) into naive C57BL/6 recipient mice. Two-three days later these mice were injected i.v. with 4-5 × 10⁶ MDSC and within an hour immunized subcutaneously with 100 μg of specific peptides in IFA. Ten days later cells from LN were re-stimulated with specific or control peptides and analyzed.
To produce Neu-specific T cells BALB/c mice were primed with 100 μg of plasmid pEC1–170neu, which is previously described (39), followed immediately by electroporation of the injected area (95V, four pulses of 65 ms with re-poling) using an Electro Square Porator device (BTX, model TX830; San Diego, CA). Two weeks later, 100 μg of synthetic peptide rNEUp66 (TYVPANASL) was injected intravenously in combination with 50 μg of anti-CD40 mAb (clone; FGK45) and 50 μg of Poly-IC (Hiltonol™), which was kindly provided by Dr. Andres Salazar (Oncovir, Inc. Washington, DC). Eight days later from the last immunization, mice were euthanized and used for further experiments. Mice demonstrated more than 40 % of rNEUp66-specific CD8 T cell responses by tetramer staining analysis.
B3Z assay
B3Z is a lacZ-inducible CD8+ T cell hybridoma expressing TCR specific for OVA257-264 (SIINFEKL), presented on the murine H2Kb MHC class I molecule. LPS matured DC or MDSC from H-2Kb mice were loaded with SIINFEKL or control peptide (10μg/ml) for 90 min and then cultured with B3Z for 3 hr at 37°C in a 5% CO2/air atmosphere. After that time cells were washed and β-Galactosidase activity was detected in live cells by using fluorescein di-b-D-galactopyranoside and propidium iodide (PI) according to the manufacturers protocol (Invitrogen)
Functional assays
The number of IFN-γ producing cells in response to stimulation to the specific or control peptides (10 μg/ml) was evaluated in ELISPOT assay performed as described earlier (11). Each well contained 2 × 10⁵ LN cells. The number of spots was counted in triplicates and calculated using an automatic ELISPOT counter (Cellular Technology, Ltd). Cell proliferation induced by antigen specific or anti-CD3 (0.5 μg/ml) and anti-CD28 (5 μg/ml) antibodies stimulation was evaluated using 3H-thymidine incorporation as described previously.
Intracellular calcium concentration
5 × 10⁶ OT-1 T cells were suspended in 2% FBS-RPMI and stained with 3 μg/ml of Fluo-4, 5μg/ml of fura-red for 30 min at 37°C. Later cells were washed twice with RPMI and 1.5×10⁶ cells were re-suspended in 1 ml of serum free RPMI and warmed at 37°C before use. These cells were co cultured with LPS activated DCs or MDSC from H-2Kb mice loaded with SIINFEKL and checked for intracellular calcium concentration plotted as the FL1 (Fluo-4)/FL3 (fura red) ratio over time.
Confocal microscopy
Splenocytes from DT mice were cultured with specific peptide in the presence of MDSC (at 3:1 ratio) on a poly-d-lysine coated glass bottom culture dish (MatTek Corp.). The cells were labeled with anti- Vα2 TCR APC anti-Vβ 8.1 TCR Alexa555 and anti-nitrotyrosine Alexa 488. Cells were viewed with a DMI6000 inverted Leica TCS AOBS SP5 tandem scanning confocal microscope with a 40× /1.30NA oil immersion objective. Tunable 488 Argon and 546 and 633 laser lines were applied to excite the samples using AOBS line switching to minimize crosstalk between fluorochromes. Images and Z-stacks were produced with three cooled photomultiplier detectors and the LAS AF version 1.5.1.889 software suite.
Fluorescence resonance energy transfer (FRET) assay
Splenocytes from OT-1 mice were cultured for 48 hr with specific peptide with or without MDSC (at 3:1 ratio) on a poly-d-lysine coated glass bottom culture dish (MatTek, Corp.). For TCR-CD8 FRET cells were labeled with TCR Valpha2 APC and anti-CD8-PE and for TCR-CD3 FRET or TCR Valpha2 APC and anti-CD3-PE. After 30 min of incubation at 4°C, cells were washed and fluorescence resonance energy transfer-sensitized emission analysis was performed using a DMI6000 inverted Leica TCS AOBS SP5 tandem scanning confocal microscope and the LAS AF version 1.5.1.889 software suite. The FRET efficiency was calculated according to method 3 EA(i) = B/A (EA is the apparent FRET efficiency. A and B correspond to the intensities of the 2 signals (donor, FRET)
Measuring subunit ratios within the TCR/CD3 complex via IP-FCM
T cells were purified from 48 hr cultures that had OT-1 splenocytes alone or splenocytes with OVA-pulsed MDSC, followed by analysis by IP-FCM as described (16). Briefly, T cells were lysed in 1% Digitonin isotonic lysis buffer, and post-nuclear lysates were incubated with IP mAbs specific for either CD3ζ (mAb H146) or Vβ5 (mAb MR9-4) to immunoprecipitate native TCR/CD3 complexes. Captured complexes were probed in parallel with PE-conjugated non-specific Hamster Ig, or mAbs specfic for CD3ζ (mAb 6B10), TCRβ (H57) or Vα2 (B20.1). Geometric MFI was used to estimate the relative subunit quantities in the captured complexes as described in the text and in previous work (16).
Flow cytometry
Flow cytometry data were acquired using a FACSCalibur flow cytometer and analyzed with Flowjo software vers 8.8.6. For intracellular staining, cells were labeled with anti-CD8 and anti-Vα2 antibodies, fixed and permeabilized according to the manufacturer's protocol (BD Pharmingen).
Statistical analysis
Most of the data were analyzed using two-tailed Mann-Whitney test. Where warranted two-tailed unpaired t-test was used. P values <0.05 were considered statistically significant. All statistical analyses were performed using GraphPad PRISM 5 software (GraphPad Software, Inc. La Jolla, CA).
Results
Signaling in CD8+ T cells exposed to MDSC
To investigate the mechanism of MDSC induced CD8+ T-cell tolerance we initially used the experimental system described previously (5, 11). T cells were isolated from transgenic OT-1 mice expressing TCR specific for OVA-derived peptide SIINFEKL (OT1) and transferred into naïve C57BL/6 recipients. Two days later MDSC isolated from EL-4 tumor-bearing mice were injected and mice were immunized with OT1 peptide in IFA (Fig. 1A). LN cells were collected 10 days after T-cell transfer and re-stimulated with control or specific peptides. CD8+ T-cell response was evaluated in IFN-γ ELISPOT assay. This experimental system allows for evaluation of the direct effect of MDSC on CD8+ T cells in tumor-free mice by avoiding confounding influence of the presence of tumor on T cell function. Previous studies have determined that MDSC were undetectable in tumor-free mice 5 days after adoptive transfer (11, 18). Thus, re-stimulation of LN cells in this model was performed in the absence MDSC. In contrast to LN cells from control mice that demonstrated potent responses to the specific peptide, LN cells from mice that received MDSC were not able to respond to the peptide (Fig. 1B). To assess the effect of MDSC on the presence of antigen-specific CD8+ T cells we used staining with SIINFEKL/Kb pentamers (Fig. 1C). In control mice the proportion of pentamer positive CD8+ T cells increased dramatically after immunization, whereas in mice that received MDSC it was much lower and quickly returned to the level observed in non-immunized mice (Fig. 1D). Although MDSC administration did not affect the total number of CD8+ T cells, it reduced the total number of pentamer-positive CD8+ T cells (Fig. 1E). To investigate the mechanism of the decreased accumulation of antigen-specific CD8+ T cells OT-1 T cells were labeled with CFSE prior to transfer in to the recipients. Proliferation of antigen-specific CD8+ T cells was evaluated three days after immunization. Antigen-specific T cells in control mice actively proliferated (Fig. 1F). The proportion of pentamer-positive CD8+ T cells in MDSC treated mice was substantially lower than in control mice. However, pentamer positive CD8+ T cells demonstrated similar level of proliferation to that in control mice. This may suggest that decreased accumulation of antigen-specific CD8+ T cells could be caused by decreased ability of these cells to bind antigen and expand during initial phase of antigenic stimulation rather than non-specific inhibition of T-cell proliferation (Fig. 1F).
Figure 1. CD8+ T-cell tolerance caused by MDSC.
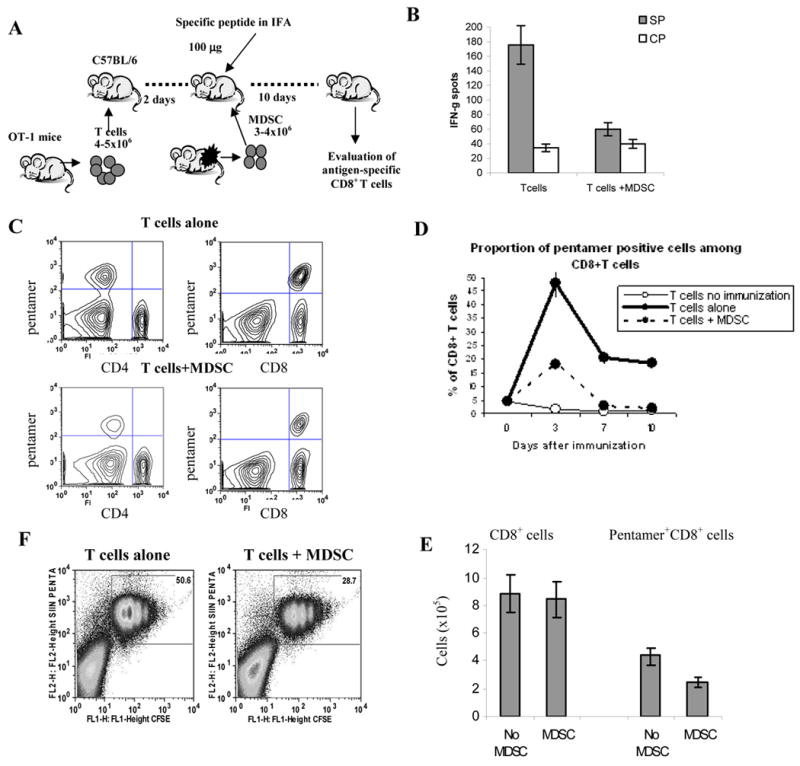
A. Experimental protocol of MDSC-induced CD8+ T-cell tolerance. T cells isolated from OT-1 mice were transferred i.v. into naïve C57BL/6 mice. Two days later these mice were intravenously injected either with PBS (T cells alone group) or 3-4×10⁶ MDSC from EL-4 tumor-bearing (T cells + MDSC group) and at the same time were immunized s.c. with 100 μg of specific peptide SIINFEKL in IFA. Ten days later LN cells were collected or in some mice, re-immunized with specific peptide. The antigen specific CD8+ T cells from the LN were later evaluated. B. Mice were treated as described above. LN cells were collected and were restimulated in the presence of specific (S.P.) or control (C.P.) peptides. Number of IFN-γ producing cells was scored in ELISPOT assay. Results presented as Average±SD. Six experiments with the same results were performed. C. Typical example of staining with SIINFEKL pentamer. The experiment was performed as described in Fig. 1A. On day 3, after MDSC transfer and immunization with specific peptide, lymph node cells were collected and stained with anti-CD8 antibody conjugated with APC and SIINFEKL pentamer conjugated with PE. As a control of specific binding, CD4+ T cells were evaluated. D. LN cells isolated from mice after adoptive transfer of OT-1 T cells were labeled with anti-CD8 and anti- H-2Kb – SIINFEKL/Kb pentamer. Results presented as proportion of pentamer positive cells among CD8+ cells. Each time point includes 3 mice. E. Absolute number of CD8+ T cells and CD8+pentamer+ T cells was evaluated 3 days after immunization. Total number of cells per lymph node is shown. F. OT-1 T cells (5×10⁶) were labeled with 20μM CFSE and then adoptively transferred into naïve recipient mice. A day later these mice were injected with MDSC cells (5×10⁶) from EL-4 tumor-bearing mice and immunized s.c. with OT1 peptide. LNs were isolated 3 days later, stained with anti-CD8, and anti- H-2Kb - SIINFEKL pentamer and analyzed by flow cytometry.
Next we asked whether MDSC affected TCR signaling in CD8+ T cells. We used H2Kb T-cell hybridoma (B3Z) that has been engineered to express OT-1 specific TCR linked to beta-galactosidase (19). MDSC and DCs (derived from bone marrow and used as positive control) were loaded with OT1 peptide and then cultured with B3Z cells. DCs caused dramatic activation of TCR mediated signaling, whereas MDSC failed to stimulate the B3Z cells (Fig. 2A,B). When MDSC were incubated with T cells together with DCs it resulted in significant reduction in the response (Fig. 2B). Similar results were obtained during the analysis of calcium mobilization in OT-1 T cells (Fig. 2C). However, calcium ionophore ionomycin caused substantial Ca2+ mobilization in T cells even in the presence of MDSC (Fig. 2D).
Figure 2. MDSC don't induce TCR signaling in CD8+ T cells.
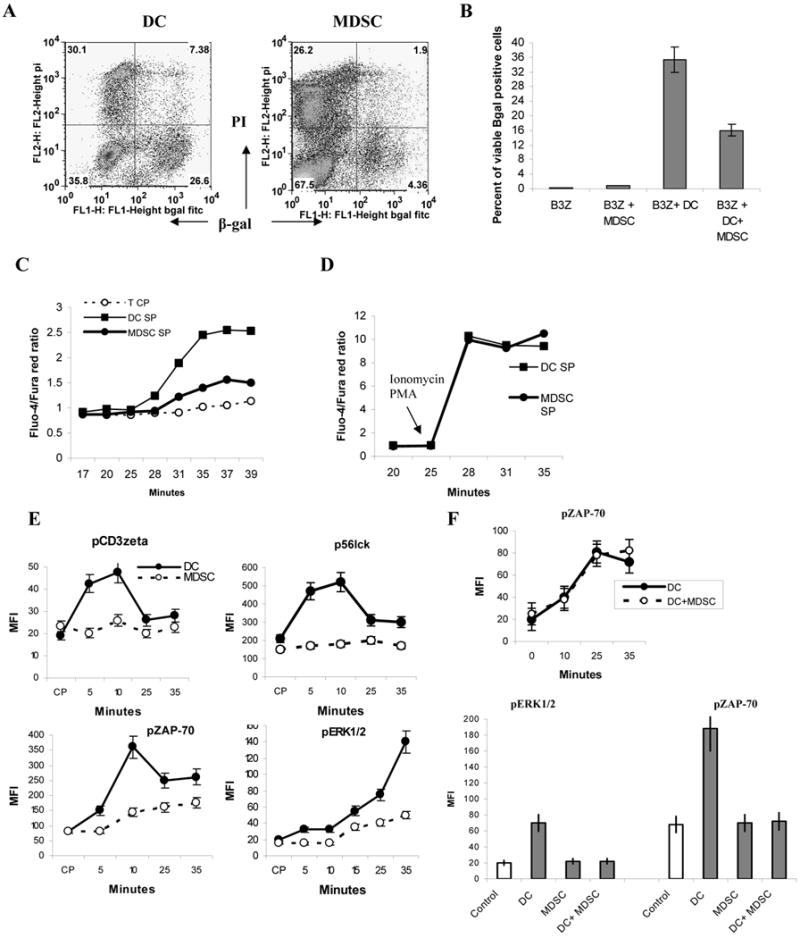
A,B. B3Z T-cell hybridoma was cultured with mature bone marrow derived DCs or MDSCs loaded with OT1 peptide. A. Typical example of β-galactosidase activity measured in live (propidium iodide negative) cells by using fluorescein di-β-D-galactopyranoside (lower right quadrant). B. Cumulative results of three performed experiments. C,D. Calcium influx in T cell incubated with MDSC and DCs. C. OT-1 T cells were incubated with OT1 peptide loaded DCs or MDSCs and labeled with two calcium sensitive dyes fluo-4 or Fura-red. Ca2+ influx was measured as a ratio of fluorescence emitted by the two dyes – Fluo-4/Fura-red. D. Ca2+ influx after the addition of ionomycin. E. OT1 specific CD8+ T cells were cultured with peptide-loaded DCs or MDSC or both. Cells were stained with antibodies against CD8+ T cells, pCD3ζ, p56lck, pZAP-70 and pERK1/2 and their expression measured in CD8+ T cells at different time points by flow cytometry. F. Peptide loaded DCs and MDSC were mixed together at 1:1 ratio and incubated with OT-1 T cells. The level of pZAP70 was evaluated either immediately (top panel) or after 3 hr of incubation.
To more specifically evaluate potential effect of MDSC on TCR signaling in CD8+ T cells peptide-loaded DCs and MDSC were cultured with OT-1 T cells and several tyrosine kinases and adaptor molecules associated with TCR signaling were evaluated by flow cytometry. DCs induced substantial increase in the levels of pCD3ζ, p56lck, pZAP-70 as well as pERK1/2 (Fig. 2E). In contrast MDSC did not up-regulate any of these molecules (Fig. 2E). The addition of MDSC to DCs did not affect the activation of T cells as was evaluated by the level of pZAP70 (Fig. 2F top panel). However, if DC and MDSC were cultured together with T cells for 3 hr this resulted in a substantial reduction in the levels of pERK1/2 and pZAP-70 (Fig.2F bottom panel).
MDSC induce dissociation of TCR complex
One of the important mechanisms regulating T-cell responses to peptide/MHC class I complexes is the integrity of the TCR complex. To investigate the effect of MDSC on the integrity of the TCR complex, splenocytes from OT-1 mice were cultured for 48 hr with specific peptide in the presence or absence of MDSC. MDSC did not cause substantial decrease in the expression of TCRVβ, Vβ5 or Vα2 on the surface of T cells (Fig. 3A). We studied the subunit composition of the TCR/CD3 complex using a recently developed method of immunoprecipitation of multiprotein complexes detected by flow cytometry (IP-FCM) (16), which allows subunit interaction analysis in primary T cells that are only available in limited quantities. First, we found no evidence of MDSC-mediated selective loss of CD3ζ chain in T cells, because similar quantities of CD3ζ could be immunoprecipitated and detected regardless of the presence or absence of MDSC (Fig. 3B). However, TCRβ:CD3ζ complexes from T cells cultured with MDSC displayed only 50-74% of the levels found in complexes isolated from T cells that were cultured alone (Fig. 3B,C). This decrease in subunit interaction was detected to a similar extent regardless of which subunit was immunoprecipitated and which was probed. Similarly, the TCRα:CD3ζ interaction from MDSC co-cultured T cells was 29% of the level measured in complexes from T cells cultured without MDSC (Fig. 3B, C). Thus, incubation of T cells with MDSC induced a decrease in CD3ζ association with both TCR α and β subunits, even though the total quantity of all 3 subunits was unaffected.
Figure 3. Disruption of association between CD3ζ and TCR.

OT-1 transgenic splenocytes were cultured with MDSC from EL-4 tumor-bearing C57BL/6 mice for 48 hr in the presence of the OT1 peptide (10μg/ml). 48hr later T-cells were isolated and analyzed. A. Cell surface FACS staining of T cells labeled with anti TCR-β anti-Vα2 mAbs or anti-Vβ5 mAb. B. Post-nuclear lysates of purified T cells from cultures containing either T cells alone or T cells with MDSC were subjected to IP-FCM. Native TCR/CD3 complexes were immunoprecipitated with mAbs specific for either CD3ζ (mAb H146) or Vβ5 (mAb MR9-4), and captured complexes were probed in parallel with PE-conjugated non-specific Hamster Ig, or mAbs specific for Thy1.2, CD3ζ (mAb 6B10), TCRβ (mAb H57), or Vα2 (mAb B20.1). Histogram fluorescence and the geometric MFIs displayed reflect the relative quantity of subunits in the complexes. Two experiments with the same results were performed. C. The relative CD3ζ content in the complexes was determined by dividing TCR β or α probe geometric MFI by that of ζ. Three experiments with the same results were performed. D. FRET assay. MDSC and OT-1 splenocytes were cultured for 48 hr with specific peptide and then stained with anti-CD8-PE or anti-CD3-PE antibodies (electron donor) and anti-TCRVα2-APC (electron acceptor). Cells were analyzed by confocal microscopy for FRET sensitized emission (FRET-SE) as described in Methods. FRET-SE was calculated in 10-16 regions with high intensity of fluorescence on different T cells and Mean ± SD are shown.
To assess physical interaction between CD8 and TCR we used FRET assay, which allows for a measurement of distance-dependent interaction between the electronic excited states of two dye molecules in which excitation is transferred from a donor molecule to an acceptor molecule without emission of a photon. Splenocytes from OT-1 mice were cultured with MDSC in the presence of specificm peptide for 48 hr. After that time cells were stained with anti-CD8 or anti-CD3 antibody conjugated with PE (electron donor) and anti-TCRVα2 conjugated with APC (electron acceptor). Cells were analyzed by confocal microscopy for FRET sensitized emission (FRET- SE). MDSC significantly reduced the level of FRET between CD8 and TCR as well as between CD3 and TCR (Fig. 3D), which was indicative of reduced physical interaction between these molecules.
CD8+T-cell tolerance is specific to only the epitope presented by the MDSC
To further investigate the mechanism of MDSC mediated CD8+ T cell tolerance, we used C57BL/6 double TCR (DT) transgenic CD8+ T cells that co-express the TCR for OT1 and the TCR for the LCMV gp33 derived epitope KAVYNFATC (gp33) on the same cell (14). MDSC were isolated from EL-4 tumor-bearing mice and cultured with splenocytes from DT mice in the presence of OT1 peptide. In control, splenocytes were cultured with OT1 peptide without MDSC. After 48 hr incubation, T cells were purified and mixed with splenocytes from naïve C57BL/6 mice and stimulated with either control, OT1, or gp33 peptides. The number of IFN-γ producing cells was evaluated in ELISPOT assay. Consistent with previous observations (5) MDSC induced CD8+ T cells non-responsiveness to the specific peptide (OT1) (Fig. 4A). However, the response of CD8+ T cells to gp33 peptide, which was not present during the initial culture with MDSC was not affected (Fig. 4A). We then reversed the experiment and cultured MDSC and splenocytes from DT transgenic mice with gp33-derived peptide followed by T-cell isolation and stimulation with three peptides described above. Under these experimental conditions, the CD8+ T cells retained their response to OT1 peptide but showed an inhibited response to the gp33 peptide (Fig. 4B).
Figure 4. MDSC induces tolerance to only one specific TCR in T cell expressing dual TCR.

A,B. Splenocytes were isolated from DT mice and cultured with MDSC isolated from EL-4 tumor-bearing mice at 1:4 ratio in the presence of 10μg/ml OT1 (A) or gp33 peptides (B). As control, splenocytes were cultured with specific peptide without MDSC. After 48 hr incubation T cells were purified and mixed at 1:5 ratio with splenocytes from naïve C57BL/6 mice and stimulated with either control, OT1 or gp33 peptides. The number of IFN-γ producing cells was evaluated in quadruplicates in an ELISPOT assay. Each experiment was performed three times. * - statistically significant (p<0.05) differences between control CD8+ T cells and T cells incubated with MDSC. C. T cells were isolated from DT mice and were transferred into naïve C57BL/6 recipients. MDSC isolated from tumor-bearing mice were injected two days later and mice were immunized once with OT1 peptide at day 2 and a second time 6 days later with 100 μg OT1 or gp33 peptide in IFA. Control mice received no MDSC and were immunized on day 2 and 6 days later with OT1 or gp33 peptide. Seven days after the second immunization response of LN cells to restimulation with control (CP), OT-1 or gp33 peptides was evaluated in an ELISPOT assay. Each group included three mice. * - statistically significant (p<0.05) differences between cells stimulated with control and specific peptides. D. DT cells were cultured with or without MDSC from EL-4 tumor-bearing in the presence of the 10μg/ml OT1 peptide. After 48hr splenocytes were washed, rested in serum-free medium for 90 min and then incubated with DCs loaded with OT1 or gp33 peptides. Cells were labeled with anti-CD8, anti-pZAP-70 and p56lck and their expression evaluated using flow cytometry in triplicates. Mean ± SD are shown. * - statistically significant (p<0.05) differences between control T cells and T cells incubated with MDSC. E. Mice were implanted s.c. with 2×10⁵ EG7 or EL-4 tumor. Fifteen days later when tumor reach 1 cm in diameter mice were injected i.v. with 5×10⁶ DT T cells. Seven days after injection LN cells were isolated stimulated with control, OT1, or gp33 peptides and response was evaluated in 3[H]-thymidine assay. Mean ± SD are shown. * - statistically significant difference between cells stimulated with OT1 and gp33 peptides.
To test these findings in vivo, T cells were isolated from DT mice and transferred into naïve recipients. Two days later MDSC isolated from tumor-bearing mice were injected and mice were immunized with either OT1 or gp33 peptide in IFA. Mice were boosted with peptides 6 days later and the response of LN cells to stimulation with these peptides was evaluated in ELISPOT assay 7 days after second immunization. Since MDSC were undetectable in spleens or LN 5 days after adoptive transfer into tumor-free recipients second immunization was performed in the absence of these cells. Control mice immunized with OT1 peptide demonstrated a potent response to this peptide and a weak response to gp33 peptide. Control mice immunized with gp33 peptide showed potent responses to gp33 peptide and lower response to OT1 peptide (Fig. 4C). MDSC transfer prior to first immunization with OT1 abrogated CD8+ T cell response to the specific (OT1) peptide. In striking contrast, CD8+ DT T cells from the mice that were immunized first time with OT1 peptide in the presence of MDSC and then re-immunized with gp33 peptide (after the MDSC were gone) demonstrated potent response to gp33 peptide, whereas the response to OT1 peptide remained suppressed (Fig. 4C). Taken together these data indicates that MDSC induce CD8+ T-cell tolerance involving only the TCR specific to the peptide presented by MDSC. The ability of the same cells to respond to stimulation with the peptide that was not presented by MDSC was not affected.
To evaluate the effect of MDSC on TCR signaling in DT CD8+ T cells, splenocytes from these mice were cultured for 48 hr with or without MDSC in the presence of OT1 peptide. After that time splenocytes were washed rested in serum-free medium for 90 min and then incubated with DCs loaded with SIINFEKL or gp33 peptides. The levels of pZAP-70 and p56lck were evaluated in the CD8+ T cells by intracellular staining using flow cytometry. Pre-incubation of T cells with MDSC dramatically reduced the ability of CD8+ T cells to up-regulate pZAP-70 and p56lck in response to DCs loaded with OT1 peptide. In contrast, response of T cells to gp33 peptide which was not present in culture with MDSC was not affected (Fig. 4D).
We then tested the effect of tumor associated antigens on DT T cells. Mice were implanted with EG7 tumor (EL-4 tumor cells expressing OVA) or EL-4 tumors as control. Fifteen days later when tumor reach 1 cm in diameter mice were injected i.v. with 5×10⁶ DT T cells. Seven days after injection LN cells were isolated stimulated with OT1 or gp33 peptides and response was evaluated in proliferation assay. LN cells from EL-4 tumor-bearing mice showed potent response to both OT1 and gp33 peptide (Fig.4E). LN cells from EG7 tumor-bearing demonstrated similar response to gp33 peptide. In contrast, the response to OT1 peptide was significantly inhibited (Fig. 4E). These data were consistent with the results obtained from experiments with MDSC and demonstrated that in tumor-bearing mice immune suppression in peripheral lymphoid organs was specific for the antigen presented on tumor cells.
We investigated whether antigen-specific CD8+ T-cell tolerance can be observed in another model of tumor-bearing mice without use of adoptive transfer of MDSC and transgenic T cells. A2L2 cells were made from parental mammary carcinoma 66.3 cells by transfection of a rat NEU expressing vector (20). When tumors reached 1 cm in diameter (∼2 weeks after tumor inoculation), the mice were injected i.v. with 4×10⁶ T cells isolated from BALB/c mice that were immunized with a synthetic peptide representing an H2-Kd restricted rat NEU CD8 T cell epitope (21). Tetramer analysis of the spleen cells from the vaccinated mice demonstrated that ∼40% of CD8+ T cells expressed TCR specific for rat NEU-derived peptide (Fig 5A). Seven days after the adoptive transfer of the CD8 T cells into the tumor bearing mice, the LN cells were isolated and stimulated in vitro with the relevant rat NEU-derived or control peptides. CD8+ T cells responses were evaluated using IFN-γ ELISPOT and proliferation assays. In the absence of T-cell transfer LN cells from neither A2L2 nor 66.3 tumor-bearing mice responded to stimulation with the specific peptide. Antigen-specific T cells retained significant peptide-specific response after adoptive transfer to 66.3 (rat NEU-negative) tumor-bearing mice, whereas no response was detected in T cells after transfer to A2L2 (rat NEU-positive) tumor-bearing mice (Fig. 5B, C). At the same time, T-cells from 66.3 and A2L2 tumor-bearing mice showed a similar level of response to stimulation with CD3/CD28 antibodies (Fig. 5D) indicating that the observed differences in antigen-specific responses between these tumor-bearing mice were not due to the differences in the global T-cell suppression.
Figure 5. CD8+ T cell tolerance is specific for tumor-associated antigens.
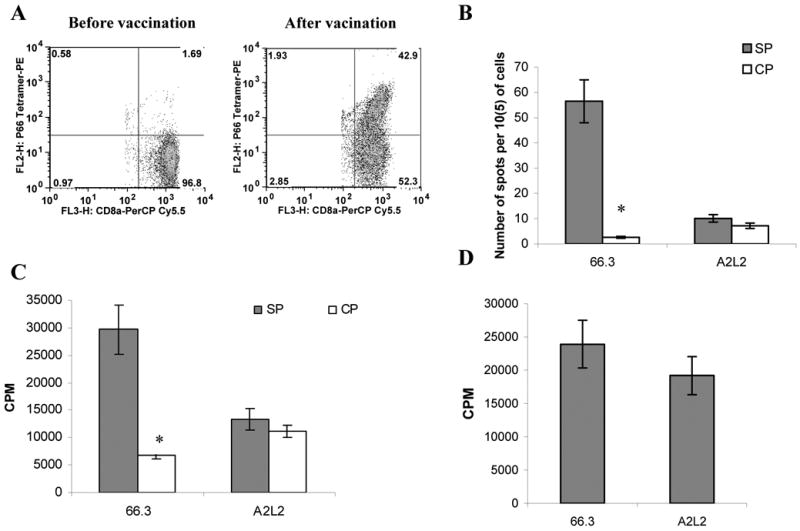
A. Antigen-specific CD8+ T cells after immunization with rNeu-derived peptide. BALB/c mice were primed with 100 μg of plasmid pEC1–170neu, followed immediately by electroporation of the injected area. Two weeks later, 100μg of synthetic peptide rNEUp66 was injected intravenously in combination with 50 μg of anti-CD40 mAb and 50 μg of Poly IC. Eight days after the last immunization, spleens were harvested and labeled with NEUp66-specific tetramer and anti-CD8 antibody and were evaluated by flow cytometry. CD8+ T cells were gated. B-C. Mice were injected with 2 × 10⁵ 66.3 and A2L2 cells. 10 days later mice were injected i.v. with 5×10⁶ rNEU specific T cells isolated from immunized mice. Seven days later the lymph node cells were restimulated with rNEUp66 peptide (SP) or control peptide (CP). IFN-γ production was evaluated in ELISPOT assay (B) and proliferation by 3[H]-thymidine uptake (C). LN cells were restimulated with specific (SP) or control (CP) peptides (B, C) or CD3/CD28 antibodies (D). T-cell proliferation was measured by 3[H]-thymidine uptake. Results presented as Mean±SD from four mice. * - statistically significant (p<0.05) differences between the groups.
Mechanism of T cell tolerance induced by MDSC
How can MDSC induce tolerance in DT CD8+ T cells to only one TCR? We have previously demonstrated that nitration of TCR complex by MDSC could be one of the major factors of CD8+ T cell tolerance (5). We asked whether this mechanism can explain the specificity of T-cell tolerance. To study this mechanism in DT mice we used three-color confocal microscopy. The OT1 specific Vα2 TCR was stained with APC conjugated antibody (magenta), gp33 specific Vβ 8.1 TCR with antibody conjugated with Alexa 555 (red) and nitrotyrosine (NT) with antibody conjugated with Alexa 488 (green) (Fig. 6A). Stimulation of T cells with DC loaded with OT1 peptide resulted in polarization of Vα2 TCR (arrows), whereas Vβ8.1 TCR remained largely intact. Under these conditions, no positive NT staining was evident (Fig. 6B). On the other hand, incubation of DT T cells with MDSC and OT1 peptide resulted in preferential polarization of Vα2 TCR with positive NT staining observed only at the site of polarization (Fig. 6C). To investigate whether similar effect could be observed with MDSC that process tumor-associated antigen, MDSC were isolated from EG-7 tumor-bearing mice and incubated for 48 hr with DT T cells. Cells were labeled with anti-NT and either anti-Vα2 antibody that recognize TCR specific for OVA-derived epitope that is present in EG-7 tumor cells or with anti-Vβ 8.1 antibody that recognize TCR specific for LCMV-derived peptide not present in tumor. Incubation of DT T cells with MDSC from EG-7 mice resulted in polarization of Vα2 TCR and NT staining was co-localized with TCR molecules (Fig. 6D). In contrast, polarization of Vβ 8.1 TCR was not observed and NT was not co-localized with this TCR (green NT staining together with red staining of Vβ 8.1) (Fig. 6E).
Figure 6. MDSC causes nitration of the surface molecules on CD8+ T cells.
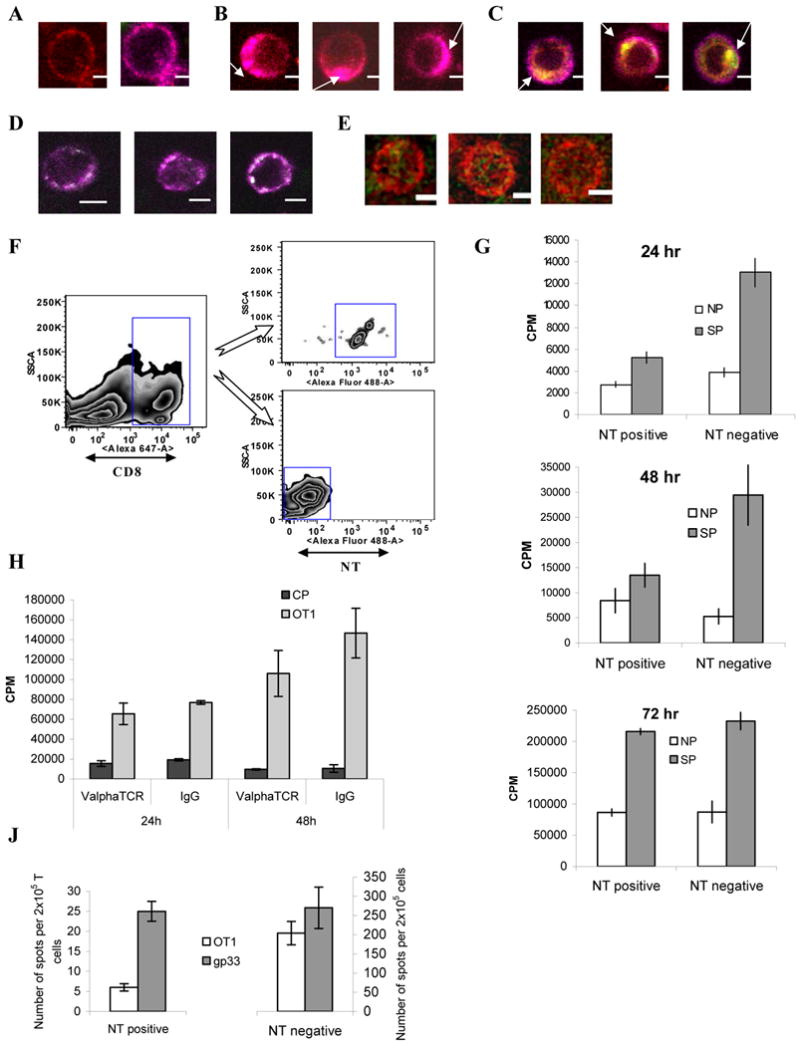
A-E. DT T cells were isolated and labeled with OT-1 specific APC conjugated anti-Vα2 TCR antibody (magenta), gp33 specific Alexa 555-conjugated anti-Vβ 8.1 TCR antibody (red) and Alexa 488-conjugated anti-nitrotyrosine (NT) antibody (green). A. Typical staining of double transgenic CD8+ T cells is shown (left – gp33 TCR, right OT-1 TCR). B Double transgenic T cells were stimulated with DC loaded with OT-1 peptide. Arrow denotes polarization of Vα2 TCR. C. Double transgenic T cells were incubated with MDSC and OT-1 peptide. Arrows represent regions of positive NT staining and site of Vα2 TCR polarization. Bar = 5 μm. D, E. Double transgenic T cells were incubated for 48 hr with MDSC isolated from EG-7 tumor-bearing mice and then stained with APC conjugated anti-Vα2 TCR antibody (magenta) and Alexa 488-conjugated anti-nitrotyrosine (NT) antibody (green) (D) or PE-Cy5 conjugated anti-Vβ 8.1 TCR antibody (red) and Alexa 488-conjugated anti-nitrotyrosine (NT) antibody (green). Bar = 5 μm. E. Typical example of cell sorting gates of NT positive CD8+ T cells. MDSC from EL-4 tumor-bearing mice were cultured for 48 hr with splenocytes from OT-1 transgenic mice in the presence of the SIINFEKL (10μg/ml). 48 hr later, cells were stained with DAPI, anti-CD8 Alexa 647 and anti-nitrotyrosine Alexa 488 and sorted by flow cytometry. F. MDSC from EL-4 tumor-bearing mice were cultured for 48 hr with splenocytes from OT-1 transgenic mice in the presence of the OT1 peptide (10μg/ml). 48 hrs later cells were sorted and added at 1:5 ratio to naïve C57BL/6 splenocytes and cultured for 24, 48, or 72 hr prior to stimulation for 3 days with specific OT-1 peptide (SP) in a 3[H]-thymidine incorporation assay. 2ng/ml of IL-2 was added to the 48 and 72 hr cultures. Each experiment was performed in triplicate and repeated twice. Mean ± SD are shown. H. MDSC from EL-4 tumor-bearing mice were cultured for 48 hr with splenocytes from OT-1 transgenic mice in the presence of the SIINFEKL (10μg/ml). 48 hr later, cells were stained with DAPI, anti-CD8 Alexa 647, anti-Vα2 APC and CD8+Vα2+ cells were sorted. In control, cells were stained with DAPI, anti-CD8 and isotype control IgG and all CD8+ T cells were sorted. Cells were then cultured with naïve splenocytes at 1:10 ratio with 2ng/ml IL-2. These cells were rested for 24 h or 48h and then stimulated with control or specific (SIINFEKL) peptide and evaluated in triplicates in 3[H]-thymidine incorporation proliferation assay. J. Double transgenic T cells were incubated with MDSC for 48 hr in the presence of SIINFEKL peptide. CD8+ NT+ or NT- cells were sorted as described above, mixed with naïve splenocytes and stimulated with either OT1 or gp33 peptides. The number of IFN-γ producing cells was evaluated in quadruplicates in ELISPOT assay.
If nitration was indeed responsible for MDSC induced T-cell tolerance, then the response to the specific peptide should be affected only in NT positive CD8+ T cells after incubation with MDSC. To test this hypothesis MDSC from EL-4 tumor-bearing C57BL/6 mice were cultured for 48 hr with splenocytes from OT-1 transgenic mice in the presence of the specific peptide. After that time CD8+T cells were sorted based on the expression of NT (NT+ and NT- CD8+ T cells, Fig. 6F). Sorted cells were then added at 1:5 ratio to naïve C57BL/6 splenocytes and cultured for 24, 48, or 72 hr prior to stimulation with specific OT1 peptide. NT- CD8+ T cells showed strong antigen-specific response, whereas NT+CD8+ T cells did not respond to stimulation with specific peptide (Fig. 6G). This effect was observed after 24 hr and 48 hr of incubation. However, after 72-hr incubation antigen-specific response of NT- cells was undistinguishable from that of NT+ cells (Fig. 6G). Thus, MDSC induced T-cell tolerance was associated exclusively with the cells that demonstrated nitration of surface molecules. Three day culture in vitro was sufficient to restore CD8+ T cell function.
These data indicate that nytrosylation of the surface molecules on T cells played a direct role in MDSC-induced T-cell non-responsiveness. Our data presented in Figure 4 showed that CD8+T-cell tolerance was specific only to the epitope presented by the MDSC. We asked whether NT positive T cells that were tolerized with MDSC loaded with the peptide specific for one TCR were able to respond to the peptide specific for the other TCR. To address this question DT TCR T cells were cultured with MDSC isolated from EL-4 tumor-bearing mice for 48 hr in the presence of OT1 peptide. After that time NT positive and negative CD8+ T cells were sorted, mixed with naïve splenocytes and stimulated with either OT1 or gp33 peptides. Response was evaluated in IFNγ ELISPOT assay. No difference in the response of NT negative cells to both these peptides was seen. In contrast NT positive CD8+ T cells had substantially higher response to gp33 peptide than to OT1 peptide (Fig. 6J). This confirmed antigen specificity of MDSC induced T cells tolerance associated with nytrosylation of surface molecules.
Discussion
MDSC were recently identified as a major factor involved in immune suppression associated with cancer, infectious diseases, sepsis, and trauma (9). However, the mechanism of this phenomenon remains poorly understood. The question is how CD8+ T cells exposed to MDSC in vitro and in vivo can retain response to non-specific stimuli (5, 11). Molecular events leading to activation of antigen-specific T cells are well described. TCR ligation of peptide/MHC complex results in phosphorylation of immunoreceptor tyrosine-based activation motifs (ITAMs) in CD3 polypeptides through the Src kinases lck and fyn. The phosphorylated ITAMs recruit ZAP-70, which leads to its phosphorylation. ZAP-70 phosphorylates linker for activation of T cells (LAT), which in turn via several different pathways induce Ca2+ influx and activation of Ras with subsequent trigger of mitogen-activated protein kinase (MAPK) cascade that include activating c-Jun N-terminal kinase, ERK, and p38 MAPKs (22, 23). This pathway could be negatively regulated via regulatory tyrosine kinases and phosphatases (24). One of the possible mechanisms of negative regulation of T-cell activation was suggested by Ron Germain's group, which demonstrated that a constant feature of TCR occupancy by peptide/MHC regardless of their affinity to TCR is activation of Lck-dependent phosphorylation of inhibitory SHP-1 phosphatase (25). In addition, low-affinity TCR epitopes promote an association of phospho-SHP-1 with the TCR and that binding causes the loss of phospho-ζ chain, which may lead to its down-regulation. High affinity epitopes can overcome this feedback inhibition by activation of ERK that phosporylates Lck and abrogates the binding of phospho-SHP-1. Our previous data suggested that MDSC by modifying TCR could convert a high affinity interaction with peptide/MHC complexes to a low affinity interaction (5). Therefore we hypothesized that similar mechanism of T-cell tolerance could be employed during MDSC-T-cell interaction.
Our experiments, however, argue that negative signaling is not responsible for MDSC mediated CD8+ T-cell tolerance. MDSC loaded with specific peptide although did not trigger TCR signaling in CD8+ T cells prevented signaling in response to activation of T cells with peptide-loaded DCs. However, MDSC suppressed T-cell response only to the peptide that was presented by these cells, whereas these T cells retained potent response to the peptide specific for the other TCR. We previously have demonstrated that MDSC caused tyrosine nitration of TCR and CD8 molecules on T cells by releasing peroxynitrite (5). Interaction of MDSC and CD8+T cells in the presence of specific peptide results in polarization of TCR and formation of synapse where apparently MDSC caused nitration of the surface protein on T cells. The critical role of this process for T-cell non-responsiveness was confirmed by the fact that only NT positive CD8+ T cells failed to respond to subsequent stimulation with specific peptide. In contrast, polarization of TCR not specific for the peptide was much less pronounced. Therefore their exposure to peroxynitrite released by MDSC could be much lower than of antigen-specific TCR. This may explain why CD8+ T cells retained the ability to respond to the peptide not presented by MDSC. Nitration of surface molecules on T cells was not permanent and probably limited by the turnover of the molecules. In our experiments 3-day culture in vitro in absence of MDSC was sufficient to completely recover the response of CD8+ T cells to the specific peptide.
Conformational changes in TCR-CD3 complex play a critical role in T-cell signaling (26, 27). Our data suggest that MDSC alter integrity of the TCR-CD3 complex in CD8+ T cells as well as physical interaction between CD8 and TCR. Dissociation between TCR and CD3ζ would invariably prevent TCR mediated signaling. Moreover, these T cells would be unable to respond to antigen presented by APC. Only when new TCR and CD3 molecules are synthesized this effect could be reversed. This defect is attributed to only TCR involved in the interaction with the peptide presented by MDSC therefore other TCR-CD3 complexes on the same cell remained relatively intact and could provide signaling in response to stimulation with APC loaded with appropriate peptide. This mechanism can explain the inability of immune system to generate tumor-specific CD8+ T cells even in the environment rich in tumor associated antigens. Instability of TCR-CD3 complexes caused by MDSC represents a novel mechanism of T-cell tolerance in cancer. However, it has been recently implicated in CD8+ T-cell tolerance caused by persistence of self antigen (28). Encounter with peripheral self-antigen rendered T cells tolerant to self, but these cells responded normally to the virus-specific TCR. Tolerant TCR complexes were structurally less stable than functional complexes and selectively exhibited proximal signaling defects (28). Thus, alterations in the stability of TCR complexes may represent a general mechanism of T-cell tolerance observed in different pathological and physiological conditions. However, it may not be applicable to the inhibition of the effector cytotoxic T cells in tumor site. Recent study has demonstrated that lack of lytic function of tumor-infiltrating lymphocytes was caused by tumor cells rather than MDSC. CD3ζ phosphorylation in these T cells was preserved but LAT and ZAP-70 were not activated. Those signaling defects were transient and involved SHP-1 (4). Thus, defects in TCR signaling in T cells may depend on whether T cells were tolerized in peripheral lymphoid organs or in tumor site.
Our data presents a possibility to resolve conflicting results concerning the extent to which tumors induce CD3ζ dysfunction as a mechanism of T cell inhibition. The CD3ζ was proposed to be a major target of tumor-mediated T cell inhibition (29, 30). The central thesis has been that tumor cells and/or tumor-associated myeloid cells induce selective degradation of CD3ζ (31-33). Although many reports corroborate these observations, some notable studies have presented contradictory data. Two groups argued that CD3ζ degradation may not take place in situ, but can occur upon lysing T cells in the presence of contaminating myeloid cells (34, 35). Others have argued that CD3ζ can undergo oxidative stress-dependent post-translational modifications that, rather than cause its degradation, can alter the epitopes required for detection by common antibodies (36). It was shown that CD3ζ downregulation is not induced by some tumors, and that inhibition of T cell function can occur despite normal CD3ζ levels (37). Furthermore, inhibited TCR/CD3 signaling has been shown to occur early in T cell responses, although CD3ζ downregulation may only be detectable after many days of in vivo tumor growth and high tumor burden (37, 38). In our system, we demonstrate an MDSC-induced disruption of TCR:CD3ζ interactions, without accompanying alteration in CD3ζ protein levels. Furthermore, this effect was detectable in T cells two days post-MDSC exposure, placing it relatively early in the T cell response kinetic. We propose that by subjecting CD3ζ, TCR, and CD8 to nitrosylation and possibly other covalent modifications (36), MDSC induce early TCR:CD3ζ dissociation, which inhibits antigen-specific T cell responsiveness. Furthermore, it is conceivable that such covalent modifications could ultimately lead to the degradation of separated CD3ζ, consistent with previously reported observations. According to this model, TCR:CD3ζ dissociation would occur early upon MDSC encounter; however, subsequent degradation of unincorporated CD3ζ might represent a consequence, rather than the cause of the crucial inhibitory step.
Acknowledgments
We thank Dr. Blankenstein for providing double transgenic mice and Dr. Schoenberger, for the gift of B3Z cells that were originally made by Dr. Shastri.
Footnotes
This work has been supported in part by the Analytic Microscopy and Flow Cytometry Core Facility at the H. Lee Moffitt Cancer Center. This work was supported by NIH grant CA 84488 to DIG.
References
- 1.Willimsky G, Blankenstein T. The adaptive immune response to sporadic cancer. Immunol Rev. 2007;220:102–112. doi: 10.1111/j.1600-065X.2007.00578.x. [DOI] [PubMed] [Google Scholar]
- 2.Wang RF. Immune suppression by tumor-specific CD4+ regulatory T-cells in cancer. Semin Cancer Biol. 2006;16:73–79. doi: 10.1016/j.semcancer.2005.07.009. [DOI] [PubMed] [Google Scholar]
- 3.Frey AB, Monu N. Signaling defects in anti-tumor T cells. Immunol Rev. 2008;222:192–205. doi: 10.1111/j.1600-065X.2008.00606.x. [DOI] [PMC free article] [PubMed] [Google Scholar]
- 4.Monu N, Frey AB. Suppression of proximal T cell receptor signaling and lytic function in CD8+ tumor-infiltrating T cells. Cancer Res. 2007;67:11447–11454. doi: 10.1158/0008-5472.CAN-07-1441. [DOI] [PMC free article] [PubMed] [Google Scholar]
- 5.Nagaraj S, Gupta K, Pisarev V, Kinarsky L, Sherman S, Kang L, Herber D, Schneck J, Gabrilovich D. Altered recognition of antigen is a novel mechanism of CD8+ T cell tolerance in cancer. Nat Med. 2007;13:828–835. doi: 10.1038/nm1609. [DOI] [PMC free article] [PubMed] [Google Scholar]
- 6.Mirza N, Fishman M, Fricke I, Dunn M, Neuger A, Frost T, Lush R, Antonia S, Gabrilovich D. All-trans-retinoic acid improves differentiation of myeloid cells and immune response in cancer patients. Cancer Res. 2006;66:9299–9307. doi: 10.1158/0008-5472.CAN-06-1690. [DOI] [PMC free article] [PubMed] [Google Scholar]
- 7.Huang AY, Golumbek P, Ahmadzadeh M, Jaffee E, Pardoll D, Levitsky H. Role of bone marrow-derived cells in presenting MHC class I-restricted tumor antigens. Science. 1994;264:961–965. doi: 10.1126/science.7513904. [DOI] [PubMed] [Google Scholar]
- 8.Sotomayor EM, Borrello I, Rattis FM, Cuenca AG, Abrams J, Staveley-O'Carroll K, Levitsky HI. Cross-presentation of tumor antigens by bone marrow-derived antigen-presenting cells is the dominant mechanism in the induction of T-cell tolerance during B-cell lymphoma progression. Blood. 2001;98:1070–1077. doi: 10.1182/blood.v98.4.1070. [DOI] [PubMed] [Google Scholar]
- 9.Gabrilovich DI, Nagaraj S. Myeloid-derived suppressor cells as regulators of the immune system. Nat Rev Immunol. 2009;9:162–174. doi: 10.1038/nri2506. [DOI] [PMC free article] [PubMed] [Google Scholar]
- 10.Gabrilovich DI, Velders M, Sotomayor E, Kast WM. Mechanism of immune dysfunction in cancer mediated by immature Gr-1+ myeloid cells. J Immunol. 2001;166:5398–5406. doi: 10.4049/jimmunol.166.9.5398. [DOI] [PubMed] [Google Scholar]
- 11.Kusmartsev S, Nagaraj S, Gabrilovich DI. Tumor-associated CD8+ T cell tolerance induced by bone marrow-derived immature myeloid cells. J Immunol. 2005;175:4583–4592. doi: 10.4049/jimmunol.175.7.4583. [DOI] [PMC free article] [PubMed] [Google Scholar]
- 12.Movahedi K, Guilliams M, Van den Bossche J, Van den Bergh R, Gysemans C, Beschin A, De Baetselier P, Van Ginderachter JA. Identification of discrete tumor-induced myeloid-derived suppressor cell subpopulations with distinct T-cell suppressive activity. Blood. 2008;111:4233–4244. doi: 10.1182/blood-2007-07-099226. [DOI] [PubMed] [Google Scholar]
- 13.Kusmartsev S, Nefedova Y, Yoder D, Gabrilovich DI. Antigen-specific inhibition of CD8+ T cell response by immature myeloid cells in cancer is mediated by reactive oxygen species. J Immunol. 2004;172:989–999. doi: 10.4049/jimmunol.172.2.989. [DOI] [PubMed] [Google Scholar]
- 14.Gladow M, Uckert W, Blankenstein T. Dual T cell receptor T cells with two defined specificities mediate tumor suppression via both receptors. Eur J Immunol. 2004;34:1882–1891. doi: 10.1002/eji.200425041. [DOI] [PubMed] [Google Scholar]
- 15.Nagaraj S, Pisarev V, Kinarsky L, Sherman S, Muro-Cacho C, Altieri DC, Gabrilovich DI. Dendritic cell-based full-length survivin vaccine in treatment of experimental tumors. J Immunother. 2007;30:169–179. doi: 10.1097/01.cji.0000211329.83890.ba. [DOI] [PubMed] [Google Scholar]
- 16.Schrum AG, Gil D, Dopfer EP, Wiest DL, Turka LA, Schamel WW, Palmer E. High-sensitivity detection and quantitative analysis of native protein-protein interactions and multiprotein complexes by flow cytometry. Sci STKE. 2007;2007:pl2. doi: 10.1126/stke.3892007pl2. [DOI] [PMC free article] [PubMed] [Google Scholar]
- 17.Cho HI, Niu G, Bradley N, Celis E. Optimized DNA vaccines to specifically induce therapeutic CD8 T cell responses against autochthonous breast tumors. Cancer Immunol Immunother. 2008;57:1695–1703. doi: 10.1007/s00262-008-0465-x. [DOI] [PMC free article] [PubMed] [Google Scholar]
- 18.Kusmartsev S, Gabrilovich DI. Inhibition of myeloid cell differentiation in cancer: The role of reactive oxygen species. J Leukoc Biol. 2003;74:186–196. doi: 10.1189/jlb.0103010. [DOI] [PubMed] [Google Scholar]
- 19.Sanderson S, Shastri N. LacZ inducible, antigen/MHC-specific T cell hybrids. Int Immunol. 1994;6:369–376. doi: 10.1093/intimm/6.3.369. [DOI] [PubMed] [Google Scholar]
- 20.Lachman LB, Rao XM, Kremer RH, Ozpolat B, Kiriakova G, Price JE. DNA vaccination against neu reduces breast cancer incidence and metastasis in mice. Cancer Gene Ther. 2001;8:259–268. doi: 10.1038/sj.cgt.7700300. [DOI] [PubMed] [Google Scholar]
- 21.Nava-Parada P, Forni G, Knutson KL, Pease LR, Celis E. Peptide vaccine given with a Toll-like receptor agonist is effective for the treatment and prevention of spontaneous breast tumors. Cancer Res. 2007;67:1326–1334. doi: 10.1158/0008-5472.CAN-06-3290. [DOI] [PMC free article] [PubMed] [Google Scholar]
- 22.Borde M, Barrington RA, Heissmeyer V, Carroll MC, Rao A. Transcriptional basis of lymphocyte tolerance. Immunol Rev. 2006;210:105–119. doi: 10.1111/j.0105-2896.2006.00370.x. [DOI] [PubMed] [Google Scholar]
- 23.Alarcon B, Gil D, Delgado P, Schamel WW. Initiation of TCR signaling: regulation within CD3 dimers. Immunol Rev. 2003;191:38–46. doi: 10.1034/j.1600-065x.2003.00017.x. [DOI] [PubMed] [Google Scholar]
- 24.Mustelin T, Vang T, Bottini N. Protein tyrosine phosphatases and the immune response. Nat Rev Immunol. 2005;5:43–57. doi: 10.1038/nri1530. [DOI] [PubMed] [Google Scholar]
- 25.Stefanova I, Hemmer B, Vergelli M, Martin R, Biddison WE, Germain RN. TCR ligand discrimination is enforced by competing ERK positive and SHP-1 negative feedback pathways. Nat Immunol. 2003;4:248–254. doi: 10.1038/ni895. [DOI] [PubMed] [Google Scholar]
- 26.Minguet S, Swamy M, Alarcon B, Luescher IF, Schamel WW. Full activation of the T cell receptor requires both clustering and conformational changes at CD3. Immunity. 2007;26:43–54. doi: 10.1016/j.immuni.2006.10.019. [DOI] [PubMed] [Google Scholar]
- 27.Gil D, Schrum AG, Alarcon B, Palmer E. T cell receptor engagement by peptide-MHC ligands induces a conformational change in the CD3 complex of thymocytes. J Exp Med. 2005;201:517–522. doi: 10.1084/jem.20042036. [DOI] [PMC free article] [PubMed] [Google Scholar]
- 28.Teague RM, Greenberg PD, Fowler C, Huang MZ, Tan X, Morimoto J, Dossett ML, Huseby ES, Ohlen C. Peripheral CD8+ T cell tolerance to self-proteins is regulated proximally at the T cell receptor. Immunity. 2008;28:662–674. doi: 10.1016/j.immuni.2008.03.012. [DOI] [PMC free article] [PubMed] [Google Scholar]
- 29.Mizoguchi H, O'Shea JJ, Longo DL, Loeffler CM, McVicar DW, Ochoa AC. Alterations in signal transduction molecules in T lymphocytes from tumor-bearing mice. Science. 1992;258:1795–1798. doi: 10.1126/science.1465616. [DOI] [PubMed] [Google Scholar]
- 30.Baniyash M. TCR zeta-chain downregulation: curtailing an excessive inflammatory immune response. Nat Rev Immunol. 2004;4:675–687. doi: 10.1038/nri1434. [DOI] [PubMed] [Google Scholar]
- 31.Aoe T, Okamoto Y, Saito T. Activated macrophages induce structural abnormalities of the T cell receptor-CD3 complex. J Exp Med. 1995;181:1881–1886. doi: 10.1084/jem.181.5.1881. [DOI] [PMC free article] [PubMed] [Google Scholar]
- 32.Otsuji M, Kimura Y, Aoe T, Okamoto Y, Saito T. Oxidative stress by tumor-derived macrophages suppresses the expression of CD3 zeta chain of T-cell receptor complex and antigen-specific T-cell responses. Proc Natl Acad Sci USA. 1996;93:13119–13124. doi: 10.1073/pnas.93.23.13119. [DOI] [PMC free article] [PubMed] [Google Scholar]
- 33.Ezernitchi AV, Vaknin I, Cohen-Daniel L, Levy O, Manaster E, Halabi A, Pikarsky E, Shapira L, Baniyash M. TCR zeta down-regulation under chronic inflammation is mediated by myeloid suppressor cells differentially distributed between various lymphatic organs. J Immunol. 2006;177:4763–4772. doi: 10.4049/jimmunol.177.7.4763. [DOI] [PubMed] [Google Scholar]
- 34.Franco JL, Ghosh P, Wiltrout RH, Carter CR, Zea AH, Momozaki N, Ochoa AC, Longo DL, Sayers TJ, Komschlies KL. Partial degradation of T-cell signal transduction molecules by contaminating granulocytes during protein extraction of splenic T cells from tumor-bearing mice. Cancer Res. 1995;55:3840–3846. [PubMed] [Google Scholar]
- 35.Noda S, Nagata-Narumiya T, Kosugi A, Narumiya S, Ra C, Fujiwara H, Hamaoka T. Do structural changes of T cell receptor complex occur in tumor-bearing state? Jpn J Cancer Res. 1995;86:383–394. doi: 10.1111/j.1349-7006.1995.tb03068.x. [DOI] [PMC free article] [PubMed] [Google Scholar]
- 36.Cemerski S, van Meerwijk JP, Romagnoli P. Oxidative-stress-induced T lymphocyte hyporesponsiveness is caused by structural modification rather than proteasomal degradation of crucial TCR signaling molecules. Eur J Immunol. 2003;33:2178–2185. doi: 10.1002/eji.200323898. [DOI] [PubMed] [Google Scholar]
- 37.Levey DL, Srivastava PK. T cells from late tumor-bearing mice express normal levels of p56lck, p59fyn, ZAP-70, and CD3 zeta despite suppressed cytolytic activity. J Exp Med. 1995;182:1029–1036. doi: 10.1084/jem.182.4.1029. [DOI] [PMC free article] [PubMed] [Google Scholar]
- 38.Correa MR, Ochoa AC, Ghosh P, Mizoguchi H, Harvey L, Longo DL. Sequential development of structural and functional alterations in T cells from tumor-bearing mice. J Immunol. 1997;158:5292–5296. [PubMed] [Google Scholar]