

Abstract
Is conscious perception of emotional face expression related to enhanced cortical responses? Electroencephalographic data (112 channels) were recorded in 15 normal adults during the presentation of cue stimuli with neutral, happy or sad schematic faces (duration: “threshold time” inducing about 50% of correct recognitions), masking stimuli (2 s), and go stimuli with happy or sad schematic faces (0.5 s). The subjects clicked left (right) mouse button in response to go stimuli with happy (sad) faces. After the response, they said “seen” or “not seen” with reference to previous cue stimulus. Electroencephalographic data formed visual event‐related potentials (ERPs). Cortical sources of ERPs were estimated by LORETA software. Reaction time to go stimuli was generally shorter during “seen” than “not seen” trials, possibly due to covert attention and awareness. The cue stimuli evoked four ERP components (posterior N100, N170, P200, and P300), which had similar peak latency in the “not seen” and “seen” ERPs. Only N170 amplitude showed differences in amplitude in the “seen” versus “not seen” ERPs. Compared to the “not seen” ERPs, the “seen” ones showed prefrontal, premotor, and posterior parietal sources of N170 higher in amplitude with the sad cue stimuli and lower in amplitude with the neutral and happy cue stimuli. These results suggest that nonconscious and conscious processing of schematic emotional facial expressions shares a similar temporal evolution of cortical activity, and conscious processing induces an early enhancement of bilateral cortical activity for the schematic sad facial expressions (N170). Hum Brain Mapp, 2010. © 2010 Wiley‐Liss, Inc.
Keywords: face recognition, emotion, subliminal stimuli, awareness, visual cortex, visual evoked potentials (VEPs), electroencephalography (EEG), LORETA
INTRODUCTION
Primary consciousness is an early process by which a conscious perceptive image of a sensory stimulus emerges by cortical activity, as opposed to parallel nonconscious, automatic processing of the same stimulus. Here we define “visual primary consciousness” as a process underlying immediate subject's self‐report about an adequate visual stimulation. In line with Pinker's [1997] theoretical view, self‐report implies subjective phenomenal experience and the ability to report it at short term (“access to information”). It does not imply attributes of “secondary” consciousness that link external stimulus with episodes of own life and ethical implication of the experience. Of special interest is the physiological mechanism underlying primary consciousness of facial emotional expressions, which are a biologically salient stimulus [Batty and Taylor, 2003]. This is especially true for facial expression of negative emotions such as angry or sadness, important cues to orient social and affective communications [Izard, 1978].
In previous studies, the neural correlates of face processing have been evaluated at a millisecond‐scale time resolution by measuring scalp event‐related potentials (ERPs). It has been reported that negative ERPs peaking around 200 ms poststimulus were related to face processing [N170/N250; Bentin et al., 2002; Schweinberger and Burton, 2003] and were modulated by conscious perception of emotional valence of both schematic and photographic facial expressions [Balconi and Lucchiari, 2005; Krombholz et al., 2007; Mikhailova and Bogomolova, 1999; Sokolov and Boucsein, 2000]. These early ERP peaks were followed by a negative ERP component peaking around 400 ms poststimulus, which was modulated by conscious processing of the emotional valence of facial stimuli [N4; Halgren and Marinkovic, 1995; Kiefer and Spitzer, 2000]. This result agrees with the fact that N4 is supposed to reflect the postperceptual and conscious integration of meaning and context in working memory [Kiefer and Spitzer, 2000].
The mentioned results show important aspects of temporal synchronization of cortical neurons in response to emotional facial expressions. However, low spatial resolution of standard electroencephalographic (EEG) techniques have not allowed a fine topographical evaluation of the cortical responses associated to primary consciousness of emotional facial expressions. In this respect, a promising approach has used high‐resolution spatial sampling of scalp potentials (>100 channels) and estimation of cortical ERP sources for the study of primary consciousness of visuospatial stimuli [Babiloni et al., 2006a, 2009]. It has been shown that primary consciousness of passively presented visuospatial stimuli was related to shorter reaction time and enhanced cortical sources of P300‐like potentials in extrastriate occipital and posterior parietal areas [Babiloni et al., 2006a]. Furthermore, primary consciousness was affected by interfering effects of repetitive transcranial magnetic stimulation of right or left posterior parietal areas [Babiloni et al., 2007]. When some operations were mentally performed on these visuospatial stimuli, primary consciousness has been related to enhanced cortical sources of P300‐like potentials in dorsolateral prefrontal areas [Babiloni et al., 2009]. Keeping in mind these considerations and data, the present ERP study tested the hypothesis that the mentioned high‐resolution EEG approach is able to unveil the timing and topography of cortical activity related to the primary consciousness of emotional facial expressions. To this aim, high‐resolution EEG data were recorded during the presentation of cue stimuli with schematic neutral, happy, or sad facial expression (i.e. emoticons) by a procedure inducing about 50% of consciously perceived emotional expressions. Cortical sources of visual ERPs were compared for the consciously and nonconsciously perceived emotional expressions. According to previous evidence using this high‐resolution EEG approach to emotionally neutral visual stimuli [Babiloni et al., 2006a, 2009], the conscious perception of the emotional facial expressions was expected to be associated to faster reaction time to the target stimuli and to enhanced cortical sources of the ERPs.
MATERIALS AND METHODS
Subjects
Experiments were performed in 15 healthy adult volunteers [six males; mean age of 25.7 years ± 1.4 standard error (SE)]. They were right‐handed, as revealed by Edinburgh Inventory (81% ± 9.4 SE) and had no previous psychiatric or neurological history. Their sight was normal or corrected to normal. All experiments were undertaken with the understanding and written consent of each participant, according to Code of Ethics of the World Medical Association (1997) and the standards established by the Author's Institutional Review Board. The present study was approved by local ethical committee.
Experimental Task
The subjects were seated in a comfortable reclining armchair, placed in a dimly lit, sound‐damped, and electrically shielded room. They kept their forearms resting on the armchairs, with the right index finger resting between two buttons of a mouse, connected to a computer monitor. The monitor of the computer was placed in front of them at a distance of about 100 cm.
For each subject, a preliminary procedure ascertained the individual threshold time (ms) of the cue stimulus. The cue stimulus was a schematic face, namely a simple white emoticon on a black background, which appeared at the center of the screen (diameter of about 5° of visual angle, as schematically reported in the first line of Fig. 1). The emoticon had one of three face expressions: neutral, happy, or sad as a function of the line depicting the mouth (namely, horizontal line for neutral, up‐right curvature for happy, downright curvature for sad). Each emoticon was preceded and followed by a white masking visual stimulus. A preliminary procedure ascertained the capability of the subjects to recognize the schematic facial expressions of the cue stimuli, namely the emoticons (i.e., neutral, sad, and happy). Specifically, the subjects were presented the cue stimuli (schematic faces) before the beginning of the experimental task. All of them knew well the schematic faces (frequent use as “emoticons” into email correspondence) and experienced no difficulty in recognizing them at different presentation times from individual threshold time to 200 ms. This preliminary procedure was carried out to exclude that eventual ERP differences among the schematic emotional facial expressions were merely due to the novelty or difficulty in interpreting a schematic “sad” versus “happy” facial expressions.
Figure 1.
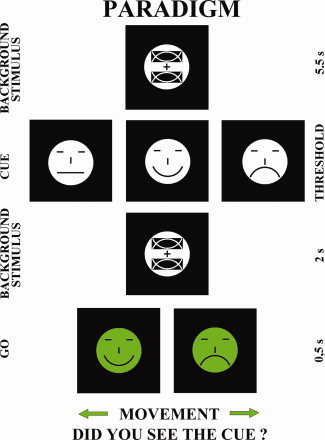
Any possible pictures for each stimulus in a typical trial. The sequence of cue stimuli and subsequent target stimuli in the second phase of the experimental procedure. The sequence of the visual stimuli was as follows: (i) background stimulus lasting 5.5 s; (ii) cue stimulus “emotional emoticon” (33% for each kind of emotion) appearing at the center of the monitor for the threshold time; (iii) background stimulus lasting about 2 s; (iv) go (target) stimulus lasting 0.5 s. The go stimulus was a green “emoticon” with happy or sad as face expression (50% of probability), which appeared at the center of the monitor. The subjects had to press the left mouse button if the target stimulus had happy face expression, whereas they had to press the right mouse button if the target stimulus had sad face expression. [Color figure can be viewed in the online issue, which is available at wileyonlinelibrary.com.]
The main experimental procedure was as follows. The first phase aimed at determining the threshold time of the cue stimulus (i.e. emoticon), defined as the time duration needed to induce about 50% of conscious perception of its face expression. In this phase, the duration of the cue stimulus randomly varied trial‐by‐trial within the following values: 20, 40, 60, 80, 100, 120, 140, 160 ms (10 trials for each duration value, in total 80 trials). This procedure was repeated seven times. The threshold time to be used during the EEG recordings was defined as the duration of the cue stimulus determining about 50% of correct stimulus detections within a series of 10 trials, in the majority of the seven repetitions of the procedure. In this preliminary procedure, the subjects had to use the left or right bottom of the mouse to index if the face expression was sad or happy, respectively. This allowed confirming that they not only consciously perceived the emoticon but also detected its facial expression. Just before the EEG recording, this threshold time was systematically varied up and down (10 ms) for some preliminary trials, to verify the stability of that time based on subject's self‐report. Subject‐by‐subject, the mean threshold time of the cue stimulus was 64.6 ms (±9.1 SE). It is worth noticing that the global correctness of the procedure for the determination of that threshold time was supported by the post‐hoc verification. Indeed, the recognition of the cue stimuli during the EEG recordings was on average 53.1% (±2.5% SE) across subjects.
The second phase of the experimental procedure aimed at recording EEG data related to both consciously perceived emotional face expression of cue stimuli (“seen trials”) and missed emotional face expression of cue stimuli (“not seen trials”). Figure 1 illustrates the sequence of cue stimuli and subsequent target stimuli in the second phase of the experimental procedure. The sequence of the visual stimuli was as follows: (i) background stimulus lasting 5.5 s; (ii) cue stimulus “emotional emoticon” (33% for each kind of emotion) appearing at the center of the monitor for the threshold time; (iii) masking stimulus lasting about 2 s; (iv) go (target) stimulus lasting 0.5 s. The go stimulus was a green “emoticon” with happy or sad as face expression (50% of probability), which appeared at the center of the monitor. The subjects had to press the left mouse button if the target stimulus had happy facial expression, whereas they had to press the right mouse button if the target stimulus had sad facial expression. The computer receiving the mouse inputs registered the corresponding reaction time and the side of the button pressed. Immediately after the hand motor response, the subjects had to say “seen” if they had detected the emotional facial expression of the cue stimulus (“seen trial”) or “not seen” if they had missed it (“not seen trial”; i.e. they saw the face, but could not recognize the facial expression). After the experiment, subjects denied the use of mental verbal codes for the cue stimuli during the foreperiod between the cue and target stimuli. Verbal self‐report was registered by a microphone connected to the mentioned computer as well as by the manual note of an experimenter. The experimenter controlled even that subjects watched the computer monitor during the task.
Two methodological remarks should be emphasized. Firstly, the same time and physical features (emotional facial expression, shape, luminance, etc.) characterized cue stimuli consciously perceived (“seen trials”) and those not consciously perceived (“not seen trials”). Therefore, these features cannot explain the reason why some cue stimuli were “seen” and others were consciously “not seen”. Secondly, the paradigm included go stimuli to test the control hypothesis that reaction time to these stimuli was faster with the “seen” than “not seen” trials, as an effect of the covert attention and awareness [Babiloni et al., 2006a].
EEG Recordings
During the experimental task, EEG data were recorded (EB‐Neuro, Be‐plus; bandpass: 0.1–100 Hz, sampling rate: 256 Hz; electrode reference: Fcz electrode; ground: Fpz electrode) from a cap with 112 electrodes placed according to an augmented 10–20 system. Electrode impedance was kept lower than 5 kOhm. A spatial digitalization of the electrodes was made for each subject by a magnetic digitizer (Polhemus fasttrack), which allowed confirming the comparable position of homologous scalp electrodes across subjects (less than 1 cm of intersubject error, on average). Vertical and horizontal electrooculographic activity was also recorded with the same features of the EEG data, to monitor eye movements and blinking. In parallel, involuntary and voluntary (following the go stimulus) hand motor responses were assessed by collecting electromyographic activity from extensor digitorum muscle of both arms. This allowed the control of involuntary and mirror hand movements for the selection of artifact‐free EEG trials. Acquisition time for all data was set from −1 s to +5.5 s after the onset of the cue stimulation. On average, 300 trials for each subject were recorded.
Behavioral Data Analysis
The reaction time (dependent variables) at the target stimulus was evaluated by ANOVAs for repeated measures. Mauchley's test evaluated the sphericity assumption. Correction of the degrees of freedom was made by Greenhouse–Geisser procedure. Duncan test was used for post‐hoc comparisons (P < 0.05). ANOVA analysis of the reaction time included the factors Condition (“not seen” and “seen”), Cue emotion (neutral, happy, and sad) and Target emotion (happy and sad).
Preliminary EEG Data Analysis
EEG trials contaminated by blinking, eye movements, and involuntary motor acts were rejected off‐line. A special attention was posed at the rejection of the EEG trials with blinking and eye movements, which could be associated to distraction from the cue and target stimuli.
The artifact‐free EEG trials were classified in “seen” and “not seen” trials. In each of these two classes, the EEG trials were further classified with respect to the three facial expressions of the cue stimuli (neutral, happy, and sad). In total, the EEG trials were divided into six classes (“seen” and “not seen” for neutral, happy, and sad cue stimuli).
Artifact‐free EEG potentials at the original 112 channels (or less based on the EEG preliminary analysis) were interpolated by a spline function [Babiloni et al., 1995], to obtain EEG potentials at 105 electrode sites of an augmented 10–20 system. These electrodes were disposed over a 3‐D template head model digitized at the Brain Imaging Center of the Montreal Neurological Institute (http://www.bic.mni.mcgill.ca/), which was coregistered to Talairach atlas [Talairach and Tournoux, 1988]. This procedure made the electrode position consistent across subjects for the subsequent data analyses.
The EEG potentials at the interpolated 105 electrodes were averaged within each of the six mentioned classes to form the ERPs. The same number of “seen” and “not seen” trials was selected in each subject so that the ERP components of the six classes could be correctly compared in amplitude across subjects. The total number of EEG trials for each subject and condition (“seen” and “not seen”) was 110 (±7 SE), which included an equal number of neutral, happy, and sad cue stimuli. In all subjects, a standard prestimulus baseline (from −1,000 ms to cue stimulus onset) was used as a reference to measure the amplitude of the ERP components typically associated with facial stimuli, namely N100, N170, P200, and P300 peaks.
Cortical Sources Analysis of the ERPs
“Low resolution brain electromagnetic tomography” (LORETA) was used for the source analysis of the ERPs [Pascual‐Marqui and Michel, 1994; Pascual‐Marqui et al., 1999, 2002]. We preferred LORETA to other analogous techniques, since this software can be downloaded from Internet for the replication of the present results (http://www.unizh.ch/keyinst/NewLORETA/LORETA01.htm). Furthermore, several independent research groups have successfully applied LORETA to model cortical responses to sensorimotor events [Carretié et al., 2004; Frei et al., 2001; Gamma et al., 2004; Herrmann et al., 2004; Jausovec and Jausovec, 2001; Wang et al., 1999]. However, it should be stressed that LORETA has a spatial resolution (centimeters) lower than that of positron emission tomography and fMRI techniques (millimeters).
LORETA computed 3‐D linear solutions (LORETA solutions) for the EEG inverse problem within a three‐shell spherical head model including scalp, skull, and brain compartments. The brain compartment was restricted to the cortical gray matter/hippocampus and was coregistered to the Talairach probability brain atlas, which has been digitized at the Brain Imaging Center of the Montreal Neurological Institute [Talairach and Tournoux, 1988]. This compartment included 2.394 voxels (7 mm resolution), each voxel containing an equivalent current dipole. The so‐called LORETA solutions consisted of voxel current density values that were able to predict ERP voltage at scalp electrodes.
Solutions of the EEG inverse problem are underdetermined and ill‐conditioned when the number of spatial samples (electrodes) is lower than the unknown samples' ones (current density at each voxel). The LORETA solutions predicting scalp ERPs were regularized to estimate distributed rather than punctual EEG source activity [Pascual‐Marqui and Michel, 1994; Pascual‐Marqui et al., 1999, 2002]. It should be remarked that the head template of the original LORETA package cannot account for differences in individual cortical envelope as typically done in the analysis of fMRI (i.e., normalization, coregistering, smoothing). This methodological limitation was taken into account focusing LORETA source analysis on the activity within large cortical regions of interest [Brodmann areas (BAs)] rather than at voxel level. In particular, the cortical regions of interest for the statistical analysis were the BAs showing the maximum activity within frontal, central, parietal, temporal, and occipital areas. Since the current density at each voxel is a vector with three components with respect to orthogonal planes (X, Y, and Z moments), the strength of the dipole moment was defined as the square root of the sum of squares for the x, y, and z components of the dipole. For a given ERP component, the cortical response in each BA of interest was computed averaging the strength of the dipole moment of all voxels of that BA.
Statistical Analysis
Statistical analyses were performed by ANOVAs for repeated measures. Mauchley's test evaluated the sphericity assumption (P < 0.05). Correction of the degrees of freedom was made by Greenhouse–Geisser procedure. Duncan test was used for post‐hoc comparisons (P < 0.05).
ANOVA of the reaction time to go stimuli included the factors Condition (“not seen” and “seen”), Cue stimulus emotion (neutral, happy, and sad), and Go stimulus emotion (happy and sad).
ANOVA of the LORETA source amplitude was performed only for the ERP components showing clear amplitude differences between “seen” and “not seen” ERPs, to minimize the repetition of the statistical test. For each of these ERP components, the evaluation of the peak latency was performed by an ANOVA including the factors Condition (“not seen” and “seen”) and Cue stimulus emotion (neutral, happy, and sad). Furthermore, the evaluation of the LORETA source amplitude was performed by five different ANOVAs including the factors Condition (“not seen” and “seen”), Cue stimulus emotion (neutral, happy, and sad), and Hemisphere (left and right). Each ANOVA evaluated the LORETA source amplitude for one of the cortical lobes of interest, namely frontal, central, parietal, occipital, and temporal. Within each cortical lobe of interest, we identified the BA having the highest mean LORETA source amplitude (current density averaged across voxels) as revealed by the grand average across all subjects, conditions (“not seen” and “seen”), and emotional expressions of the cue stimuli (neutral, happy, and sad).
RESULTS
Behavioral Results
The subjects' accuracy in the recognition of the schematic facial expressions of the go (target) stimuli was globally high and ranged from 97.5% (sad) to 98.5% (happy) for the “seen” trials and from 99.1% (sad) to 98% (happy) for the “not seen” trials. ANOVA including the factors Condition (“not seen” and “seen”), Cue stimulus emotion (neutral, happy, and sad), and Go stimulus emotion (happy and sad) showed a statistically significant interaction between the two factors Condition and Go stimulus emotion [F(1,14) = 12.92; P < 0.005]. Post‐hoc comparisons revealed that the accuracy was better in the “not seen” than in the “seen” trials for the sad go stimuli (P < 0.02). These results globally confirmed that the subjects posed attention to the visual stimuli along the EEG session and performed the task well.
The subjects' reaction time to the go (target) stimuli showed values ranging from 477 to 987 ms for the “seen” trials and from 526 to 1,027 ms for the “not seen” trials. ANOVA of the reaction time to the go stimuli showed three statistically significant effects (P < 0.05). Firstly, there was a statistically significant main factor Condition (“not seen” and “seen”), indicating that the reaction time was faster in the “seen” than in the “not seen” trials [F(1,14) = 25.46; P < 0.0002].
Secondly, there was a statistically significant [F(1,14) = 19.42; P < 0.0006] interaction between the factors Condition (“not seen” and “seen”) and Go stimulus emotion (happy and sad). Planned post‐hoc comparisons revealed that the reaction time to the go stimuli was faster in the “seen” than in the “not seen” trials for both happy (P < 0.00005) and sad (marginal, P < 0.06) go stimuli.
Thirdly, there was a statistically significant [F(2,28) = 4.62; P < 0.0185] interaction (see Fig. 2) among the factors Condition (“not seen” and “seen”), Cue stimulus emotion (neutral, happy, and sad), and Go stimulus emotion (happy and sad). Planned post‐hoc comparisons showed that (i) the reaction time was globally shorter for the happy than the sad go stimuli (P < 0.05); (ii) the reaction time to the happy go stimuli was significantly shorter in the “seen” than in the “not seen” trials after the neutral (P < 0.00002), happy (P < 0.00002), and sad (P < 0.015) cue stimuli; and (iii) the reaction time to the sad go stimuli was shorter in the “seen” than in the “not seen” trials after the happy cue stimuli (P < 0.02). Compared with the nonconscious perception of the emotional schematic facial expressions, the conscious perception was associated with a faster reaction time to the target stimuli. This was true especially for the happy go stimuli and when the go stimuli were preceded by the happy cue stimuli.
Figure 2.
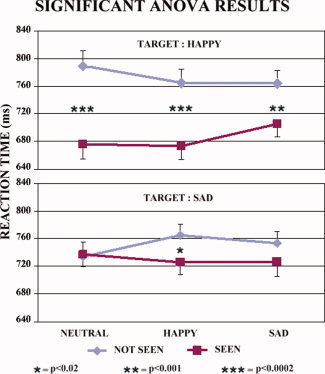
Mean and standard error (N = 15) of reaction time for the statistically significant [F(2,28) = 4.62; P < 0.0185] interaction among the factors Condition (“not seen” and “seen”), Cue stimulus emotion (neutral, happy, and sad), and Go stimulus emotion (happy and sad). Planned post‐hoc comparisons showed that (i) the reaction time to the happy go stimuli was longer in the “not seen” than “seen” trials with the neutral (P < 0.00002), happy (P < 0.00002), and sad (P < 0.015) cue stimuli; and (ii) the reaction time to the sad target stimuli was faster in the “seen” than “not seen” trials with the happy cue stimuli (P < 0.02). Compared to the nonconscious perception of the emotional schematic face expressions, the conscious one was associated with faster reaction time to the target stimuli as a possible effect of covert attention and awareness. [Color figure can be viewed in the online issue, which is available at wileyonlinelibrary.com.]
Spatiotemporal Evolution of the Scalp ERPs
Figure 3 plots grand average (N = 15) waveforms of the “not seen” and “seen” ERPs for the neutral, happy, and sad cue stimuli (i.e., schematic facial expressions). These ERPs refer to representative midline electrodes (Fz, Cz, Pz, and Oz). The ERP waveforms disclosed a sequence of negative–positive peaks, namely N100, N170, P200, and P300 (N = negative, P = positive, poststimulus peak latency in milliseconds). These components were quite similar in shape and amplitude in both “not seen” and “seen” ERPs. As an exception, the N170 amplitude was higher in the “seen” than in the “not seen” trials, especially at posterior electrodes. This component was, hence, selected for further analyses.
Figure 3.
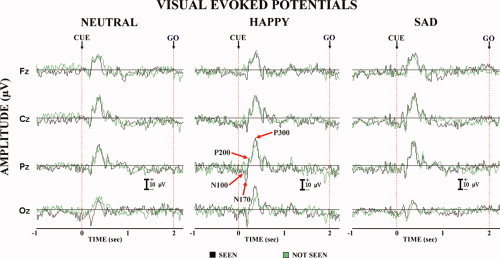
Grand average (N = 15) waveforms of the “not seen” and “seen” ERPs for the neutral, happy, and sad cue stimuli (i.e., schematic facial expressions). These ERPs refer to representative midline electrodes (Fz, Cz, Pz, and Oz). The ERP waveforms disclosed a sequence of negative–positive peaks, namely N100, N170, P200, and P300 (N = negative, P = positive, post‐stimulus peak latency in milliseconds). These components were quite similar in shape and amplitude in both “not seen” and “seen” ERPs. As an exception, the N170 amplitude was higher in the “seen” than in the “not seen” trials, especially at posterior electrodes. This component was, hence, selected for further analyses.
The peak latency of the N170 was practically equal in the “not seen” and “seen” ERPs. Specifically, the mean latency was +178 ms (±12 SE) for the neutral cue stimuli, +194 ms (±6 SE) for the happy cue stimuli, and +178 ms (±7 SE) for the sad cue stimuli. There was no statistically significant latency effect (P > 0.05) in the peak latency for the factors Condition (“not seen” and “seen”) and Cue stimulus emotion (neutral, happy, and sad). The N170 amplitude served as an input for LORETA source analysis.
N170 LORETA Sources
Figure 4 shows that grand average of the LORETA N170 source solutions averaged across all subjects, conditions (“not seen” and “seen”), and emotional expressions of the cue stimuli (neutral, happy, and sad). The most activated BAs for the frontal, central, parietal, occipital, and temporal cortical regions of interest were the BA 9, BA 6M, BA 7, BA 17, and BA 37, respectively. These BAs were used for ANOVAs comparing LORETA source amplitude. To be consistent with the field N170 literature [Balconi and Lucchiari, 2005; Eimer and Holmes, 2007; Sokolov and Boucsein, 2000], we referred to the N170 sources when they were estimated in occipital and temporal regions in line with previous high‐resolution EEG studies [e.g., Curran et al., 1993]. For the ERP sources were estimated elsewhere, we used the term “N170” sources.
Figure 4.
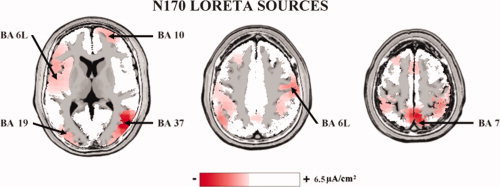
Grand average (N = 15) of the LORETA N170 source solutions averaged across all subjects, conditions (“not seen” and “seen”), and emotional expressions of the cue stimuli (neutral, happy, and sad). The most activated BAs for the frontal, central, parietal, occipital, and temporal cortical lobes of interest were the BA 9, BA 6M, BA 7, BA 17, and BA 37, respectively. These BAs were used for ANOVAs comparing LORETA source amplitude. [Color figure can be viewed in the online issue, which is available at wileyonlinelibrary.com.]
Figure 5 maps the grand average (N = 15) of the “not seen” and “seen” LORETA “N170” sources for the neutral, happy, and sad cue stimuli (i.e., schematic facial expressions).
Figure 5.
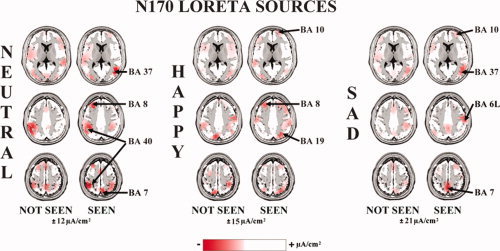
Grand average (N = 15) of LORETA solutions separately modeling the N170 sources relative to neutral, happy, and sad cue stimuli for the “not seen” and “seen” trials. The amplitude of the central (BA 6) and parietal (BA 7) N170 sources appeared to be markedly higher in the “seen” with respect to the “not seen” trials. [Color figure can be viewed in the online issue, which is available at wileyonlinelibrary.com.]
The individual LORETA solutions for the cortical lobes of interest were used as an input for the ANOVAs. For the frontal lobe (BA 9), the ANOVA of the LORETA “N170” source solutions showed a statistically significant interaction [F(2,28) = 3.25; P < 0.0536] between the factors Condition and Cue stimulus emotion. Figure 6 (top graph) illustrates the mean LORETA source amplitude relative to this interaction. The amplitude of the LORETA solutions for the sad cue stimuli was higher in the “seen” than in the “not seen” ERPs, whereas the opposite was true for the happy cue stimuli.
Figure 6.
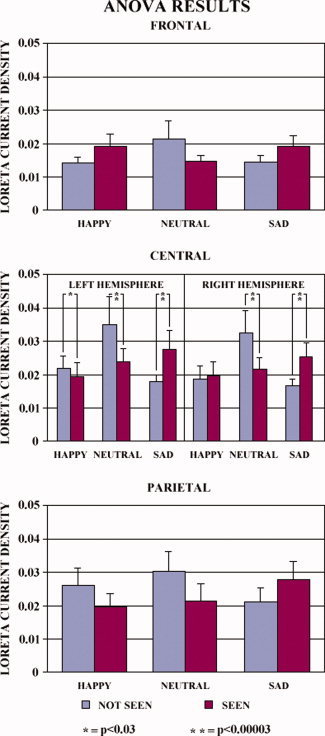
Individual LORETA solutions for the cortical lobes of interest were used as an input for the ANOVAs. For the frontal lobe (BA 9), the ANOVA of the LORETA N170 source solutions showed a statistically significant interaction [F(2,28) = 3.25; P < 0.0536] between the factors Condition and Cue stimulus emotion. Top graph illustrates the mean LORETA source amplitude relative to this interaction. The amplitude of the LORETA solutions for the sad cue stimuli was higher in the “seen” than in the “not seen” ERPs, whereas the opposite was true for the happy cue stimuli. For the central region (BA 6M), the ANOVA pointed to a statistically significant interaction between the factors Conditions, Hemisphere, and Cue stimulus emotion [F(2,28) = 4.37; P < 0.0223]. Middle graph illustrates the mean LORETA source amplitude relative to this interaction. For the left hemisphere, the amplitude of the LORETA N170 source solutions was higher in the “seen” than in the “not seen” trials for the sad cue stimuli (P < 0.00003); the opposite was true for the happy (P < 0.03) and neutral (P < 0.00003) cue stimuli. For the right hemisphere, the amplitude of the LORETA N170 source solutions was higher in the “seen” than in the “not seen” trials for the sad cue stimuli (P < 0.00003); the opposite was true for the neutral cue stimuli (P < 0.00003). For the parietal lobe (BA 7), there was a statistically significant interaction [F(2,28) = 4.16; P < 0.0262] between the factors Condition and Cue stimulus emotion. Bottom graph illustrates mean LORETA source amplitude relative to this interaction. The amplitude of the LORETA solutions for the sad cue stimuli was higher in the “seen” than in the “not seen” ERPs, whereas the opposite was true for the happy cue stimuli. [Color figure can be viewed in the online issue, which is available at wileyonlinelibrary.com.]
For the central region (BA 6M), the ANOVA pointed to a statistically significant interaction between the factors Conditions, Hemisphere, and Cue stimulus emotion [F(2,28) = 4.37; P < 0.0223]. Figure 6 (middle graph) illustrates the mean LORETA source amplitude relative to this interaction. For the left hemisphere, the amplitude of the LORETA “N170” source solutions was higher in the “seen” than in the “not seen” trials for the sad cue stimuli (P < 0.00003); the opposite was true for the happy (P < 0.03) and neutral (P < 0.00003) cue stimuli. For the right hemisphere, the amplitude of the LORETA “N170” source solutions was higher in the “seen” than in the “not seen” trials for the sad cue stimuli (P < 0.00003); the opposite was true for the neutral cue stimuli (P < 0.00003).
For the parietal lobe (BA 7), there was a statistically significant interaction [F(2,28) = 4.16; P < 0.0262] between the factors Condition and Cue stimulus emotion. Figure 6 (bottom graph) illustrates mean LORETA source amplitude relative to this interaction. The amplitude of the LORETA “N170” solutions for the sad cue stimuli was higher in the “seen” than in the “not seen” ERPs, whereas the opposite was true for the happy cue stimuli.
For the occipital (BA 17) and temporal (BA 37) lobes, ANOVAs of the LORETA N170 source solutions pointed to neither a main effect (P > 0.05) nor a statistically significant interaction (P > 0.05).
Control Experiments
It might be argued that the schematic emotional facial expressions affected the ERP sources for general arousal and relative neurovegetative sympathetic effects that typically accompany human emotions [Solbakk et al., 2005]. To address this issue, a control experiment was performed. We recruited (new) 15 healthy adult volunteers (seven males; mean age of 31.3 years ± 1.2 SE). They were presented the same schematic facial expressions (neutral, happy, and sad) used for the main experiment. Each stimulus lasted 0.5 s and interstimulus interval lasted 2 s. The neurovegetative effects were registered by a routine electrocardiogram (Einthoven's derivations) and were indexed by heart rate deceleration (HRD). During off‐line analysis, the HRD was separately measured for the neutral, happy, and sad facial expressions. A computer‐assisted procedure minimized the experimenter errors in the evaluation of the HRD. For each trial, intervals between hearth beats (R–R intervals) were measured before and after the onset of the cue stimuli. The mean “baseline” R–R interval was computed considering three R peaks prior to the cue stimulus onset, whereas the mean “event” R–R interval was computed considering three R peaks after the cue stimulus onset. The HRD was defined as the mean R–R interval at the event minus the mean R–R interval at the baseline. ANOVA of the HRD included the factor Cue stimulus emotion (neutral, happy, and sad). No statistically significant ANOVA effect was observed (P < 0.05), pointing to a negligible neurovegetative effect related to the observation of the emotional schematic facial expressions.
In the present study, the main effects of primary consciousness were observed during the observation of the schematic sad facial expression. A systematic comparison between N170 sources for the observation of schematic versus real sad emotional facial expressions was beyond the scope of this study. However, we performed a control experiment aimed at testing whether the observation of the schematic sad facial expression roughly induced the activation of the typical cortical regions encoding human faces. To this aim, we recalled the subjects of the main experiments, and ten of them (five males; mean age of 26 years ± 1.5 SE) accepted to be part of a new control EEG recording. In the control experiment, we used the same schematic sad facial expression of the main protocol and the photo of a real face expressing sadness (the background was similar to that of the emoticon). The control experiment included 120 trials. Each trial comprised the following sequence of visual stimuli: (i) a background stimulus lasting 2 s; (ii) a stimulus illustrating either the sad emoticon or the real sad face (50%; duration: 0.5 s); (iii) a masking stimulus lasting about 2 s. The EEG‐EOG recordings and data analysis were performed with the same parameters of the main experiment. The EOG and an experimenter served to monitor that the subjects watched the computer monitor during the task. Figure 7 shows LORETA source solutions relative to the N170 peak for the schematic and real sad facial expressions. It was shown that both kinds of visual stimuli induced an activation of ventral occipital and temporal cortical areas in the typical regions involved in the processing of visual stimuli illustrating human faces and in the generation of N170. It was concluded that as real facial expressions, the present schematic sad facial expression induced the generation of an occipital and temporal N170.
Figure 7.
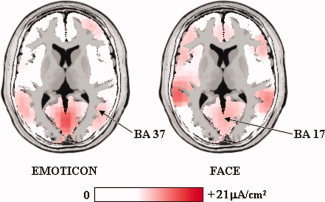
LORETA source solutions relative to the N170 peak for the schematic (emoticon) and real (face) sad facial expressions. Both kinds of visual stimuli induced an activation of ventral occipital and temporal cortical areas in the typical regions involved in the processing of visual stimuli illustrating human faces and in the generation of N170. [Color figure can be viewed in the online issue, which is available at wileyonlinelibrary.com.]
DISCUSSION
Here we tested the hypothesis that compared with nonconscious perception, conscious perception of schematic facial expressions (neutral, happy, and sad) induces shorter reaction time to the go (target) stimuli and enhanced cortical sources of ERPs, in line with previous investigations using the present high‐resolution EEG approach for the study of primary consciousness of neutral visual stimuli [Babiloni et al., 2006a, 2009]. At this early stage of the research, we used schematic emotional facial expressions (emoticons) rather than pictures of real emotional facial expressions to fully control the physical features of the visual stimuli. For example, real sad and happy emotional facial expressions are typically associated to marked wrinkles on a normally smooth skin surface, thus changing the spatial frequency content of the visual stimuli. Furthermore, the use of schematic emotional facial expressions minimized the effects of the face pleasantness, which might affect the judgment of the emotional facial expressions. Moreover, the repeated use of the schematic facial expressions minimized the confounding effects of general arousal and autonomic peripheral responses typically associated to real emotional facial expressions (e.g., see Junghöfer et al. [2005]). Indeed, a control experiment showed a lack of measurable peripheral neurovegetative reactions (i.e., heart rate deceleration) during the observation of the schematic emotional facial expressions, indicating that the arousal and peripheral autonomic effects cannot explain the modulation of the ERP sources and the reaction time to the go (target) stimuli in the current experimental conditions.
We report that the subjects' accuracy in the recognition of the go (target) stimuli was quite high (about 98%) for the “not seen” and “seen” conditions and for the stimulus emotions (sad and happy), thus indicating that the subjects posed attention to the visual stimuli and performed well the task. Compared with the nonconscious perception of the schematic emotional facial expressions, the conscious perception was associated to a slightly higher accuracy for the “not seen” than “seen” sad go (target) stimuli. Furthermore, there was a faster reaction time to the go (target) stimuli. This was true especially for the happy go stimuli and for the go stimuli preceded by the happy cue stimuli, whereas the statistical significance was globally marginal for the sad go stimuli (P < 0.06). We also report that the cue stimuli with the schematic facial expressions evoked four major ERP components such as posterior N100, N170, P200, and P300, which had the same peak latency in the “not seen” and “seen” ERPs. Only the N170 component showed some difference in amplitude in the “seen” versus “not seen” trials. In both “seen” and “not seen” ERPs, the LORETA sources of the N170 showed a dominant activity in occipital (BA 17) and ventral temporal (BA 37) areas. Furthermore, there was a source activity in posterior parietal (BA 7), medial premotor (BA 6M), and dorsolateral prefrontal (BA 9) areas. For the schematic sad facial expression, the “N170” sources in prefrontal, posterior parietal, and medial premotor areas were globally greater in magnitude in the “seen” than “not seen” trials. No remarkable difference of the “N170” sources was observed for the “seen” versus “not seen” schematic happy facial expressions (cue stimuli). In the same vein, there was no significant difference in the occipital and temporal N170 sources.
The present results extend to the emotional facial expressions with previous evidence showing that primary consciousness of neutral visuo‐spatial stimuli was related to shorter reaction time and enhanced cortical sources of the ERPs in occipital and parietal areas [Babiloni et al., 2006a], and in dorsolateral prefrontal areas when some operations were mentally performed on the visual stimuli [Babiloni et al., 2009]. The present results also extend to primary consciousness with a bulk of previous evidence showing that scalp N170 is not totally insensitive to emotional facial expressions [Balconi and Lucchiari, 2005; Bar‐Haim et al., 2005; Bentin et al., 2002; Mikhailova and Bogomolova, 1999; Schweinberger and Burton, 2003; Sokolov and Boucsein, 2000] and that source estimation of the N170 emphasizes the underlying functional topography [Eimer et al., 2003; Esslen et al., 2004; Herrmann et al., 2002]. Specifically, the present results agree with previous evidence suggesting that the occipital–temporal N170 reflects an early activation of a domain‐specific mechanism for visual analysis of faces [Carmel and Bentin, 2002], poorly implicated in the processing of emotional expressions [Bentin et al., 2006; Carretié and Iglesias, 1995; Eimer and Holmes, 2002; Herrmann et al., 2002; Labuschagne et al., in press]. They also agree with the previous report that conscious perception of the emotional (sad) facial expression would be related to a prefrontal, motor, and posterior parietal “N170.”
The high temporal resolution of the present results complements the high spatial but low temporal resolution of previous evidence obtained by functional magnetic resonance imaging (fMRI) and positron emission tomography (PET). These techniques have shown that (i) passive viewing of emotional facial expressions activated occipital, temporal, orbitofrontal, insular, and amygdala regions [Britton et al., 2006; Dolan et al., 1996; Gobbini and Haxby, 2007; Kesler‐West et al., 2001; Vuilleumier and Pourtois, 2007; Winston et al., 2003]; (ii) some of these regions increased the activation in relation to primary consciousness [Morris et al., 1998, 1999; Whalen et al., 1998]; and (iii) frontal cortex was specifically activated during the perception/empathy of happy and sad emotional facial expressions [Seitz et al., 2008].
At odds with the studies using photographic emotional facial expressions, the present study did not unveil an increase in cortical activity accompanying the conscious perception of emotional facial expressions around 400 ms poststimulus, when conscious integration of meaning and context relative to emotional valence of faces may occur in working memory [Halgren and Marinkovic, 1995; Kiefer and Spitzer, 2000]. To reconcile the present findings with previous conflicting evidence, we posit that the late phase of this conscious integrative processing is minimized when schematic facial expressions are used as visual stimuli. Alternatively, the use of masking stimuli only in the nonconscious visual condition might introduce some differences in late ERP amplitude with respect to what we observed using masking stimuli for both conscious and nonconscious conditions (“seen” and “not seen” trials).
At this early stage of research, a conclusive explanation of the results is unviable. We just speculate that nonconscious and conscious processing of schematic emotional facial expressions shares a similar temporal evolution of bilateral cortical activity. Compared with nonconscious processing, conscious processing induces an enhancement of bilateral cortical activity for the schematic sad facial expressions around 200 ms poststimulus (N170), which is a latency compatible with the processing of top–down parietal and prefrontal feedback signals [Bernat et al., 2001a, b; Diedrich et al., 1997; Kiefer and Spitzer, 2000; Marzi et al., 2000; Molholm et al., 2002]. The cortical circuit might extract visual (BA 17 and BA 37 as typical sources of N170) and spatial (BA 7) features, might ensure postural and motor control (BA 6M), and might maintain extracted information in working memory (BA 7 and BA 9). The involvement of both hemispheres might reflect parallel visuospatial processes (right hemisphere) and sequential or subvocal linguistic processes (left hemisphere), although the present subjects denied the use of mental verbal codes after the experiment. Of note, the specific demand of the present experiments required the evaluation of the geometric features of the line representing the mouth of the emoticons (i.e., horizontal line for the neutral face, up‐right curvature for the happy face, and down‐right curvature for the sad face). In precedence, fMRI evidence has shown that awareness of fearful faces specifically enhanced activation of bilateral parietal, temporal, and frontal areas [Vuilleumier et al., 2002]. Taken together, the mentioned data corroborate the theory of “micro‐consciousnesses,” posing that different attributes of primary consciousness are associated with the activity of specialized cortical areas [Zeki, 2003, 2004, 2005].
Why did conscious perception of the emotional facial expressions enhance cortical neural synchronization for the sad but not for the happy cue stimuli? Again, we can just provide a tentative explanation. Primary consciousness of the schematic sad facial expression might not emerge by an enhancement of the occipital–temporal neural synchronization as revealed by the proper N170 source, which is thought to reflect perceptual encoding of faces in content‐specific areas of the visual ventral stream [Balconi and Lucchiari, 2005; Eimer and Holmes, 2007; Sokolov and Boucsein, 2000]. Rather, this primary consciousness might emerge by the enhancement of the frontal and parietal neural synchronization as revealed by distributed “N170” sources. It is an open issue the degree of the conscious emotional experience at a so early stage of the visual information processing. Primary consciousness of the sad facial expression would have a peculiar biological utility, since a sad facial expression may signal negative and potentially dangerous implications that require maximal brain resource allocation in terms of stimulus processing, executive functions, motor control, and communicative behavior. This intensive and time‐consuming process might explain the longer reaction time for the sad than happy go (target) stimuli. Instead, happy facial expressions might be quickly processed and their global biological impact would not require a so deep enhancement of the cortical synchronization associated to the primary consciousness.
As an alternative explanation, enhanced “N170” sources might reflect less stimulus familiarity and higher difficulty in the face recognition of the sad than happy facial expression. We think that this is not the case. The subjects knew well the present schematic happy and sad facial expressions as confirmed by the high and similar rate of recognition accuracy and self‐report of the subjects (they frequently used the present sad and happy emoticons in the electronic correspondence). Therefore, the relatively unfamiliar visual stimulus was the neutral facial expression. If the amplitude of the N170 sources were merely due to the familiarity (“difficulty”) of the facial expressions, then its peak amplitude would have been observed for the neutral facial expression rather than for the sad one.
Methodological Remarks
The above interpretation of the present results should be considered at the light of the following considerations.
Firstly, primary consciousness is not an instantaneous mental experience to be related to the instantaneous peak of a local neural concomitant (e.g., N170). Rather, it reasonably emerges from relatively long integrative neural processes (i.e., hundreds of milliseconds), which might be related to fluctuating information flux and temporal synchronization among different brain regions [Dean, 1981; Geisler and Albrecht, 1997; Shadlen and Newsome, 1998; Softky, 1993; Tononi, 2001, 2004]. Our analysis was limited to just one neural concomitant of the phenomenon (ERP sources) and should be integrated by parallel analyses in time–frequency domain [Palva et al., 2005a].
Secondly, we do not know exactly if all “not seen” stimuli were really missed and if all “seen” trials were really perceived. The self‐reports could be affected by subject's perceptive or response uncertainty. This problem has been extensively discussed in the implicit perception literature [Babiloni et al., 2009; Hannula et al., 2005; Hillyard et al., 1971; Pessoa, 2005]. A certain rate of false “seen” and false “not seen” is expected [Ress and Heeger, 2003]. However, previous studies following the present binary methodology [Babiloni et al., 2006a] showed that the mean percentage of false “seen” stimuli was very low (less than 3%).
Thirdly, the discrimination threshold (or point at which subjects cannot discriminate emotion from neutral with above‐chance accuracy) has been successfully used as the criterion for the neurophysiological evaluation of conscious versus nonconscious perception in a bulk of previous neuroimaging studies of masked stimuli (reviewed in Introduction). Therefore, we did not include additional trials with cue stimuli given at the detection threshold for the discrimination between facial stimulus and blank screen [Shevrin, 2001]. Some degree of conscious detection of stimulus features must occur before emotion discrimination, and this smidgen of consciousness may be taken into account in future studies to examine in detail the neural correlates of nonconscious perception [Bernat et al., 2001a, b].
Fourthly, LORETA is a functional imaging technique belonging to a family of linear inverse solution procedures like minimum norm solution, weighted minimum norm solution, or weighted resolution optimization [Pascual‐Marqui et al., 1999; Phillips et al., 2002; Valdès et al., 1998; Yao and He, 2001]. These techniques model 3D distributions of EEG sources [Pascual‐Marqui et al., 2002]. With respect to the dipole modeling of cortical sources, no a priori decision of the dipole position is required by LORETA procedure. However, LORETA cannot be yet considered as an absolute international standard or the most scientifically appropriate approach for EEG source estimation. Therefore, the present results should be confirmed by future studies using other methodological approaches to EEG source estimation.
CONCLUSIONS
What is the role of visual primary consciousness during the processing of schematic emotional facial expressions? Do neural correlates of that form of consciousness involve activity in particular neural networks, a particular temporal pattern of neural activity, or an interaction of spatial and temporal dimensions? We observed that reaction time to go stimuli was generally shorter during “seen” than during “not seen” trials, possibly due to covert attention and awareness. The cue stimuli evoked four ERP components (posterior N100, N170, P200, and P300), which had similar peak latency in the “not seen” and “seen” ERPs. Only N170 amplitude showed differences in amplitude in the “seen” versus “not seen” ERPs. Compared to the “not seen” ERPs, the “seen” ones showed prefrontal, premotor, and posterior parietal sources of N170 higher in amplitude with the sad cue stimuli and lower in amplitude with the neutral and happy cue stimuli. These results suggest that nonconscious and conscious processing of schematic emotional facial expressions shares a similar temporal evolution of cortical activity, and conscious processing induces an early enhancement of bilateral cortical activity for the schematic sad facial expressions (N170).
Acknowledgements
We thank Prof. Fabrizio Eusebi for his continuous support.
REFERENCES
- Babiloni F, Babiloni C, Fattorini L, Carducci F, Onorati P, Urbano A ( 1995): Performances of surface Laplacian estimators: A study of simulated and real scalp potential distributions. Brain Topogr 8: 35–45. [DOI] [PubMed] [Google Scholar]
- Babiloni C, Vecchio F, Miriello M, Romani GL, Rossini PM ( 2006a): Visuo‐spatial consciousness and parieto‐occipital areas: A high‐resolution EEG study. Cereb Cortex 16: 37–46. [DOI] [PubMed] [Google Scholar]
- Babiloni C, Vecchio F, Rossi S, De Capua A, Bartalini S, Ulivelli M, Rossini PM ( 2007): Human ventral parietal cortex plays a functional role on visuospatial attention and primary consciousness. A repetitive transcranial magnetic stimulation study. Cereb Cortex 17: 1486–1492. [DOI] [PubMed] [Google Scholar]
- Babiloni C, Vecchio F, Iacoboni M, Buffo P, Eusebi F, Rossini PM ( 2009): Cortical sources of visual evoked potentials during consciousness of executive processes. Hum Brain Mapp 30: 998–1013. [DOI] [PMC free article] [PubMed] [Google Scholar]
- Balconi M, Lucchiari C ( 2005): In the face of emotions: Event‐related potentials in supraliminal and subliminal face expression recognition. Genet Soc Gen Psychol Monogr 131: 41–69. [DOI] [PubMed] [Google Scholar]
- Bar‐Haim Y, Lamy D, Glickman S ( 2005): Attentional bias in anxiety: A behavioral and ERP study. Brain Cogn 59: 11–22. [DOI] [PubMed] [Google Scholar]
- Batty M, Taylor MJ ( 2003): Early processing of the six basic facial emotional expressions. Brain Res Cogn Brain Res 17: 613–620. [DOI] [PubMed] [Google Scholar]
- Bentin S, Sagiv N, Mecklinger A, Friederici A, von Cramon YD ( 2002): Priming visual face‐processing mechanisms: Electrophysiological evidence. Psychol Sci 13: 190–193. [DOI] [PubMed] [Google Scholar]
- Bentin S, Golland Y, Flevaris A, Robertson LC, Moscovitch M ( 2006): Processing the trees and the forest during initial stages of face perception: Electrophysiological evidence. J Cogn Neurosci 18: 1406–1421. [DOI] [PubMed] [Google Scholar]
- Bernat E, Bunce S, Shevrin H ( 2001a): Event‐related potentials differentiate positive and negative mood adjectives during both supraliminal and subliminal visual processing. Int J Psychophysiol 42: 11–34. [DOI] [PubMed] [Google Scholar]
- Bernat E, Shevrin H, Snodgrass M ( 2001b): Subliminal visual oddball stimuli evoke a P300 component. Clin Neurophysiol 112: 159–171. [DOI] [PubMed] [Google Scholar]
- Britton JC, Taylor SF, Sudheimer KD, Liberzon I ( 2006): Facial expressions and complex IAPS pictures: Common and differential networks. Neuroimage 31: 906–919. [DOI] [PubMed] [Google Scholar]
- Carmel D, Bentin S ( 2002): Domain specificity versus expertise: Factors influencing distinct processing of faces. Cognition 83: 1–29. [DOI] [PubMed] [Google Scholar]
- Carretié L, Iglesias J ( 1995): An ERP study on the specificity of facial expression processing. Int J Psychophysiol 19: 183–192. [DOI] [PubMed] [Google Scholar]
- Carretié L, Hinojosa JA, Martin‐Loeches M, Mercado F, Tapia M ( 2004): Automatic attention to emotional stimuli: Neural correlates. Hum Brain Mapp 22: 290–299. [DOI] [PMC free article] [PubMed] [Google Scholar]
- Curran T, Tucker DM, Kutas M, Posner MI ( 1993): Topography of the N400: Brain electrical activity reflecting semantic expectancy. Electroencephalogr Clin Neurophysiol 88: 188–209. [DOI] [PubMed] [Google Scholar]
- Dean AF ( 1981): The variability of discharge of simple cells in the cat striate cortex. Exp Brain Res 44: 437–440. [DOI] [PubMed] [Google Scholar]
- Diedrich O, Naumann E, Maier S, Becker G ( 1997): A frontal slow wave in the ERP associated with emotional slides. J Psychophysiol 11: 71–84. [Google Scholar]
- Dolan RJ, Fletcher P, Morris J, Kapur N, Deakin JF, Frith CD ( 1996): Neural activation during covert processing of positive emotional facial expressions. Neuroimage 4( 3 Pt 1): 194–200. [DOI] [PubMed] [Google Scholar]
- Eimer M, Holmes A ( 2002): An ERP study on the time course of emotional face processing. Neuroreport 13: 427–431. [DOI] [PubMed] [Google Scholar]
- Eimer M, Holmes A ( 2007): Event‐related brain potential correlates of emotional face processing. Neuropsychologia 45: 15–31. [DOI] [PMC free article] [PubMed] [Google Scholar]
- Eimer M, Holmes A, McGlone FP ( 2003): The role of spatial attention in the processing of face expression: An ERP study of rapid brain responses to six basic emotions. Cogn Affect Behav Neurosci 3: 97–110. [DOI] [PubMed] [Google Scholar]
- Esslen M, Pascual‐Marqui RD, Hell D, Kochi K, Lehmann D ( 2004): Brain areas and time course of emotional processing. Neuroimage 21: 1189–1203. [DOI] [PubMed] [Google Scholar]
- Frei E, Gamma A, Pascual‐Marqui R, Lehmann D, Hell D, Vollenweider FX ( 2001): Localization of MDMA‐induced brain activity in healthy volunteers using low resolution brain electromagnetic tomography (LORETA). Hum Brain Mapp 14: 152–165. [DOI] [PMC free article] [PubMed] [Google Scholar]
- Gamma A, Lehmann D, Frei E, Iwata K, Pascual‐Marqui RD, Vollenweider FX ( 2004): Comparison of simultaneously recorded [H2(15)O]‐PET and LORETA during cognitive and pharmacological activation. Hum Brain Mapp 22: 83–96. [DOI] [PMC free article] [PubMed] [Google Scholar]
- Geisler WS, Albrecht DG ( 1997): Visual cortex neurons in monkeys and cats: Detection, discrimination and identification. Vis Neurosci 14: 897–919. [DOI] [PubMed] [Google Scholar]
- Gobbini MI, Haxby JV ( 2007): Neural systems for recognition of familiar faces. Neuropsychologia 45: 32–41. [DOI] [PubMed] [Google Scholar]
- Halgren E, Marinkovic K ( 1995): Neurophysiological networks integrating human emotions In: Gazzainga M, editor. The Cognitive Neurosciences. Cambridge: MIT Press; pp 1137–1152. [Google Scholar]
- Hannula DE, Simons DJ, Cohen NJ ( 2005): Imaging implicit perception: Promise and pitfalls. Nat Rev Neurosci 6: 247–255. [DOI] [PubMed] [Google Scholar]
- Herrmann MJ, Aranda D, Ellgring H, Mueller TJ, Strik WK, Heidrich A, Fallgatter AJ ( 2002): Face‐specific event‐related potential in humans is independent from face expression. Int J Psychophysiol 45: 241–244. [DOI] [PubMed] [Google Scholar]
- Herrmann MJ, Rommler J, Ehlis AC, Heidrich A, Fallgatter AJ ( 2004): Source localization (LORETA) of the error‐related‐negativity (ERN/Ne) and positivity (Pe). Brain Res Cogn Brain Res 20: 294–299. [DOI] [PubMed] [Google Scholar]
- Hillyard SA, Squires KC, Bauer JW, Lindsay PH ( 1971): Evoked potential correlates of auditory signal detection. Science 172: 1357–1360. [DOI] [PubMed] [Google Scholar]
- Izard CE ( 1978): Emotions as motivations: An evolutionary–developmental perspective. Nebr Symp Motiv 26: 163–200. Review. [PubMed] [Google Scholar]
- Jausovec N, Jausovec K ( 2001): Differences in EEG current density related to intelligence. Brain Res Cogn Brain Res 12: 55–60. [DOI] [PubMed] [Google Scholar]
- Junghöfer M, Schupp HT, Stark R, Vaitl D ( 2005): Neuroimaging of emotion: Empirical effects of proportional global signal scaling in fMRI data analysis. Neuroimage 25: 520–526. [DOI] [PubMed] [Google Scholar]
- Kesler‐West ML, Andersen AH, Smith CD, Avison MJ, Davis CE, Kryscio RJ, Blonder LX ( 2001): Neural substrates of facial emotion processing using fMRI. Brain Res Cogn Brain Res 11: 213–226. [DOI] [PubMed] [Google Scholar]
- Kiefer M, Spitzer M ( 2000): Time course of conscious and unconscious semantic brain activation. Neuroreport 11: 2401. [DOI] [PubMed] [Google Scholar]
- Krombholz A, Schaefer F, Boucsein W ( 2007): Modification of N170 by different emotional expression of schematic faces. Biol Psychol 76: 156–162. [DOI] [PubMed] [Google Scholar]
- Labuschagne I, Croft R, Phan K, Nathan P: Augmenting serotonin neurotransmission with citalopram modulates emotional expression decoding but not structural encoding of moderate intensity sad facial emotional stimuli: An event‐related potential (ERP) investigation. J Psychopharmacol. 2008. Oct 2. [Epub ahead of print] [DOI] [PubMed] [Google Scholar]
- Marzi CA, Girelli M, Miniussi C, Smania N, Maravita A ( 2000): Electrophysiological correlates of conscious vision: Evidence from unilateral extinction. J Cogn Neurosci 12: 869–877. [DOI] [PubMed] [Google Scholar]
- Mikhailova EG, Bogomolova IV ( 1999): The evoked cortical activity of the cerebral hemispheres in man during the active and passive perception of face expression. Zh Vyssh Nerv Deiat Im I P Pavlova 49: 566–575. [PubMed] [Google Scholar]
- Molholm S, Ritter W, Murray MM, Javitt DC, Schroeder CE, Foxe J ( 2002): Multisensory auditory–visual interactions during early sensory processing in humans: A high‐density electrical mapping study. Brain Res Cogn Brain Res 14: 115–128. [DOI] [PubMed] [Google Scholar]
- Morris JS, Friston KJ, Büchel C, Frith CD, Young AW, Calder AJ, Dolan RJ ( 1998): A neuromodulatory role for the human amygdala in processing emotional facial expressions. Brain 121( Pt 1): 47–57. [DOI] [PubMed] [Google Scholar]
- Morris JS, Ohman A, Dolan RJ ( 1999): A subcortical pathway to the right amygdala mediating “unseen” fear. Proc Natl Acad Sci USA 96: 1680–1685. [DOI] [PMC free article] [PubMed] [Google Scholar]
- Palva S, Linkenkaer‐Hansen K, Naatanen R, Palva JM ( 2005a): Early neural correlates of conscious somatosensory perception. J Neurosci 25: 5248–5258. [DOI] [PMC free article] [PubMed] [Google Scholar]
- Pascual‐Marqui RD, Michel CM ( 1994): LORETA (low resolution brain electromagnetic tomography): New authentic 3D functional images of the brain. ISBET Newsl ISNN 5: 4–8. [Google Scholar]
- Pascual‐Marqui RD, Lehmann D, Koenig T, Kochi K, Merlo MC, Hell D, Koukkou M ( 1999): Low resolution brain electromagnetic tomography (LORETA) functional imaging in acute, neurolepticnaive, first‐episode, productive schizophrenia. Psychiatry Res 90: 169–179. [DOI] [PubMed] [Google Scholar]
- Pascual‐Marqui RD, Esslen M, Kochi K, Lehmann D ( 2002): Functional imaging with low resolution brain electromagnetic tomography (LORETA): A review. Methods Find Exp Clin Pharmacol 24: 91–95. [PubMed] [Google Scholar]
- Pessoa L ( 2005): To what extent are emotional visual stimuli processed without attention and awareness? Curr Opin Neurobiol 15: 188–196. [DOI] [PubMed] [Google Scholar]
- Phillips C, Rugg MD, Friston KJ ( 2002): Systemic regularization of linear inverse solutions of the EEG source localization problem. Neuroimage 17: 287–301. [DOI] [PubMed] [Google Scholar]
- Pinker S ( 1997): How the Mind Works. London: Penguin. [Google Scholar]
- Ress D, Heeger DJ ( 2003): Neuronal correlates of perception in early visual cortex. Nat Neurosci 6: 414–420. [DOI] [PMC free article] [PubMed] [Google Scholar]
- Schweinberger SR, Burton AM ( 2003): Covert recognition and the neural system for face processing. Cortex 39: 9–30. [DOI] [PubMed] [Google Scholar]
- Seitz RJ, Schäfer R, Scherfeld D, Friederichs S, Popp K, Wittsack HJ, Azari NP, Franz M ( 2008): Valuating other people's emotional face expression: A combined functional magnetic resonance imaging and electroencephalography study. Neuroscience 152: 713–722. [DOI] [PubMed] [Google Scholar]
- Shadlen MN, Newsome WT ( 1998): The variable discharge of cortical neurons: Implications for connectivity, computation, and information coding. J Neurosci 18: 3870–3896. [DOI] [PMC free article] [PubMed] [Google Scholar]
- Shevrin H ( 2001): Event‐related markers of unconscious processes. Int J Psychophysiol 42: 209–218. [DOI] [PubMed] [Google Scholar]
- Softky WR ( 1993): The highly irregular firing of cortical cells is inconsistent with temporal integration of random EPSPs. J Neurosci 13: 334–350. [DOI] [PMC free article] [PubMed] [Google Scholar]
- Sokolov EN, Boucsein W ( 2000): A psychophysiological model of emotional space. Integr Physiol Behav Sci 35: 81–119. [DOI] [PubMed] [Google Scholar]
- Solbakk AK, Reinvang I, Svebak S, Nielsen CS, Sundet K ( 2005): Attention to affective pictures in closed head injury: Event‐related brain potentials and cardiac responses. J Clin Exp Neuropsychol 27: 205–223. [DOI] [PubMed] [Google Scholar]
- Talairach J, Tournoux P ( 1988): Co‐Planar Stereotaxic Atlas of the Human Brain. Stuttgart: Thieme. [Google Scholar]
- Tononi G ( 2001): Information measures for conscious experience. Arch Ital Biol 139: 367–371. [PubMed] [Google Scholar]
- Tononi G ( 2004): An information integration theory of consciousness. BMC Neurosci 5: 42. [DOI] [PMC free article] [PubMed] [Google Scholar]
- Valdès P, Picton TW, Trujillo N, Bosch J, Aubert E, Riera J ( 1998): Constraining EEG‐MEG source imaging with statistical neuroanatomy. Neuroimage 4: 635. [Google Scholar]
- Vuilleumier P, Pourtois G ( 2007): Distributed and interactive brain mechanisms during emotion face perception: Evidence from functional neuroimaging. Neuropsychologia 45: 174–194. [DOI] [PubMed] [Google Scholar]
- Vuilleumier P, Armony JL, Clarke K, Husain M, Driver J, Dolan RJ ( 2002): Neural response to emotional faces with and without awareness: Event‐related fMRI in a parietal patient with visual extinction and spatial neglect. Neuropsychologia 40: 2156–2166. [DOI] [PubMed] [Google Scholar]
- Wang J, Jin Y, Xiao F, Fan S, Chen L ( 1999): Attention‐sensitive visual event‐related potentials elicited by kinetic forms. Clin Neurophysiol 110: 329–341. [DOI] [PubMed] [Google Scholar]
- Whalen PJ, Rauch SL, Etcoff NL, McInerney SC, Lee MB, Jenike MA ( 1998): Masked presentations of emotional facial expressions modulate amygdala activity without explicit knowledge. J Neurosci 18: 411–418. [DOI] [PMC free article] [PubMed] [Google Scholar]
- Winston JS, O'Doherty J, Dolan RJ ( 2003): Common and distinct neural responses during direct and incidental processing of multiple facial emotions. Neuroimage 20: 84–97. [DOI] [PubMed] [Google Scholar]
- Yao D, He B ( 2001): A self‐coherence enhancement algorithm and its application to enhancing three‐dimensional source estimation from EEGs. Ann Biomed Eng 29: 1019–1027. [DOI] [PubMed] [Google Scholar]
- Zeki S ( 2003): The disunity of consciousness. Trends Cogn Sci 7: 214–218. [DOI] [PubMed] [Google Scholar]
- Zeki S ( 2004): The neurology of ambiguity. Conscious Cogn 13: 173–196. [DOI] [PubMed] [Google Scholar]
- Zeki S ( 2005): The Ferrier Lecture 1995 behind the seen: The functional specialization of the brain in space and time. Philos Trans R Soc Lond B Biol Sci 360: 1145–1183. [DOI] [PMC free article] [PubMed] [Google Scholar]