

Abstract
Whether there are differences in knee anthropometry between Asian and white knees remains unclear. Three-dimensional knee models were constructed using computed tomography or magnetic resonance imaging of healthy Chinese and white subjects. The morphologic measurements of the femur included mediolateral, anteroposterior dimensions, and aspect ratio. The tibial measurements included mediolateral, medial/lateral anteroposterior dimension, aspect ratio, and posterior slope of medial/lateral plateau. The results showed that Chinese knees were generally smaller than white knees. In addition, the femoral aspect ratio of Chinese females was significantly smaller than that of white females (1.24 ± 0.04 vs 1.28 ± 0.06). Tibial aspect ratio differences between Chinese and white males (1.82 ± 0.07 vs 1.75 ± 0.11), though significant, were likely a reflection of differences in knee size between races. These racial differences should be considered in the design of total knee arthroplasty prosthesis for Asian population.
Keywords: knee geometry, total knee arthroplasty, Chinese, Caucasian, male, female
Recent anthropometric studies have suggested that current design of total knee arthroplasty (TKA) does not cater to racial anthropometric differences [1–5]. Most of the commercially available TKA prostheses are designed according to the anthropometric data of white knees, which has been suspected as the cause of the component mismatch in Asian people [4].
Several studies [1–3] have compared the morphology of Asian knees to that of TKA prostheses currently used in Asia and found that the femoral aspect ratio (mediolateral [fML]/anteroposterior [fAP]) of these prostheses were not suitable for Asian patients. For instance, Ho et al [2] reported that 3 of 5 TKA systems used in China tended to cause mediolateral overhang of the component across the width of the resected femurs of Chinese patients. The authors also found a larger femoral aspect ratio in small knees and a proportionally smaller ratio in large knees, but all the 5 sets of implant systems examined in the study showed little changes in the aspect ratio with AP length.
There is a remarkable paucity of information pertaining to clinical outcome differences of TKA across racial groups. Iorio et al [6] showed that the Japanese patients had a significantly less postoperative range of motion than white patients. Furthermore, 4.1% Japanese patients required revision after primary posterior cruciate-retaining TKA within an average follow-up of 6.6 years, whereas only 2.6% of their American cohort needed revision within an average follow-up of 9 years. The authors suggested that the racial morphologic differences might be a factor causing the differences in outcome.
The findings on TKA mismatching have led some researchers to suggest that Asia Pacific people should have special designs of TKA prosthesis system. However, whether there are differences in knee anthropometry between the Asian and white knees remains unclear. A literature review indicated that no study has specifically investigated knee anthropometric differences between Asian and white men and women. With the higher prevalence of knee osteoarthritis and lower preoperative knee function in Asian population than white population [7–9] and the increasing use of TKA in Asia Pacific areas [10], it becomes essential to understand the differences between the knee morphology of the Asian and white population to improve the outcome of TKA in Asia Pacific population. The aim of the present study was to investigate the anthropometry of the Chinese and white knees using 3-dimensional knee models. We hypothesize that there is a distinct difference in size and shape between the Asia Pacific knees and white knees.
Materials and Methods
Subject Demographics
Seventy-six knees from living subjects were analyzed in this study. Twenty male and 20 female Chinese subjects were recruited at Shanghai Ninth People’s Hospital, Shanghai Jiaotong University School of Medicine (Shanghai, PR China), after obtaining informed consent from the subjects. Twenty male and 16 female white subjects were recruited at the Massachusetts General Hospital following approval by the institute review board and collection of the informed consent from each subject.
White female subjects were younger (29.3 ± 9.6 years vs 41.8 ± 4.5 years; P < .001) and taller (165.5 ± 8.4 cm vs 157.8 ± 3.9 cm; P < .001) than Chinese female subjects. There was no significant difference in the body weight of the Chinese and white female subjects (66.9 ± 10.4 kg vs 62.1 ± 7.1 kg; P = .495).
White male subjects were younger (31.8 ± 10.8 years vs 47.9 ± 6.1 years; P < .001), taller (179.2 ± 5.9 cm vs 170.6 ± 7.1 cm; P < .001), and weighted significantly more than Chinese male subjects (85.5 ± 10.3 kg vs 66.5 ± 5.9 kg; P = .001).
One knee of each subject was studied (left or right chosen by random). All knees included in the study were healthy without any symptoms of soft tissue injuries or osteoarthritis. This was verified both via clinical examination and examination of computer tomographic (CT) images or magnetic resonance imaging (MRI).
Creation of 3-Dimensional Knee Models
For the Chinese subjects, a CT scan of the knee was obtained using a helical CT scanner (120 kV,80 mA; Light Speed 16; GE Medical System, General Electric Company, Milwaukee, Wis). During the scan, the subject was supine with his or her knee in a relaxed and extended position. The scanning procedure was performed to acquire 0.625 mm CT slices (resolution, 512 × 512 pixels) with a field of view of 360 × 360 mm around knee joint.
For the white subjects, MRI scans of each knee were obtained using a 3.0 Tesla magnet (Siemens, Erlangen, Germany) and fat suppressed 3-dimensional spoiled gradient-recalled sequence. During the scan, the subject was supine with his or her knee in a relaxed and extended position. Parallel sagittal plane images of 1 mm in thickness and no space were obtained (resolution, 512 × 512 pixels) with a field of view of 180 × 180 mm.
The CT and MRI images were then segmented using a 3-dimensional modeling software (Rhinoceros, Robert McNeel and Associates, Seattle, Wash) to construct 3-dimensional bone models of the knee, including the tibia and femur [11]. Our previous validation study indicated that similar bony models could be constructed using CT and MRI images [12].
Femoral Morphology
The mediolateral (fML) and anteroposterior (fAP) size of the femur were measured using a viewing plane set perpendicular to the femoral long axis. In the sagittal and coronal planes, the femoral long axis was angled equally with respect to the anterior/posterior and medial/lateral edges of the femoral shaft, respectively. The femur was rotated about its long axis so as to make the posterior condylar tangent line horizontal. The fML and fAP dimensions of the femur were then measured by fitting a rectangular bounding box to the distal femur in the above-defined viewing plane (Fig. 1A, B). In addition, the femoral aspect ratio (fML/fAP) was also calculated.
Fig. 1.
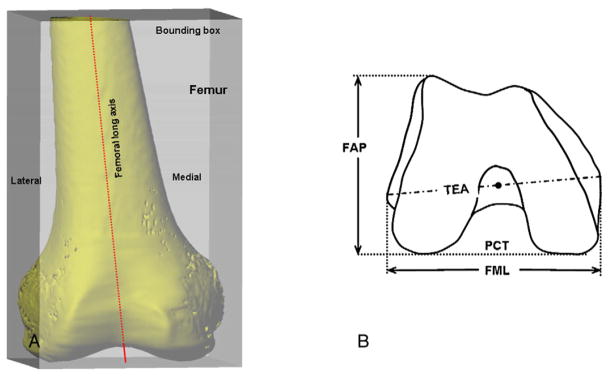
Femoral measurements. (A) Femoral bone model and its bounding box. (B) Measurements of femoral mediolateral and anteroposterior dimension (fML, fAP). Here, TEA indicates transepicondylar axis and PCT, posterior condylar tangent.
Tibial Morphology
A coordinate system was constructed on the tibial side to aid in making the morphological measurements (Fig. 2A) [13]. The tibial long axis passed through the middle of the tibial spines and was oriented parallel to the posterior wall of the tibial shaft in the sagittal plane. In the coronal plane, it was angled equally with respect to the medial and lateral edges of the tibial shaft. An orthogonal coordinate system was placed on the tibia with the mediolateral axis obtained by projecting a line passing through the centers of the medial and lateral tibial plateaus onto a plane perpendicular to the tibial long axis. The center of the medial/lateral tibial plateau was defined as the centroid of the closed curve formed by tracing the edges of the plateau (Fig. 2B). The midpoint of the tibial mediolateral axis was defined as the origin of the tibial coordinate system.
Fig. 2.

Tibial measurements. (A) Tibial coordinate system. (B) Measurements of proximal tibia: tibial mediolateral (TML) size, medial/lateral plateau anteroposterior size (MAP, LAP). (C) The posterior tibial slope was defined as angle between tibial long axis and a line tangent to the articular surface of the plateau in the sagittal plane.
The mediolateral length of the tibia and the ante-roposterior dimensions of medial/lateral tibial plateau were measured using a viewing plane set perpendicular to the tibial long axis (Fig. 2B). The tibia was rotated about its long axis, such that the line joining the centers of the medial and lateral plateaus was horizontal. The tibial mediolateral (tML) dimension was then measured in the above-defined viewing plane. The anteroposterior dimensions of the medial and lateral tibial condyles were measured separately. Subsequently, the average tibial anteroposterior dimension and the tibial aspect ratio (the mediolateral dimension divided by the average tibial anteroposterior dimension, tML/Avg. tAP) were calculated.
The posterior slope of the medial/lateral tibial plateau was measured separately in a sagittal plane and passing through the medial/lateral plateau center. The posterior slope was defined as angle between the tibial long axis and a line tangent to the articular surface of the plateau (Fig. 2C).
Statistics
A Student t test was performed to determine if the morphological measurements were statistically different between the races in the same sex. A P value of less than .05 was considered statistically significant. Bestfit lines representing the relationship between femoral/tibial AP dimension and the femoral/tibial aspect ratio were calculated using least-squares regression.
Results
The morphological measurements of the knees are summarized by race and sex in Tables 1 and 2.
Table 1.
Femoral Measurements Categorized by Race and Sex
| fML (mm) | fAP (mm) | fML/fAP | |
|---|---|---|---|
| Chinese female | 72.8 ± 2.6 (70.0–79.1) | 58.8 ± 2.5 (53.2–63) | 1.24 ± 0.04 (1.17–1.32) |
| White female | 76.4 ± 4.0 (70.3–82) | 59.7 ± 2.6 (54.6–64.1) | 1.28 ± 0.06 (1.16–1.39) |
| P | .002 | .352 | .013 |
| Chinese male | 82.6 ± 3.6 (72.6–87.1) | 65.0 ± 2.8 (59.4–70.3) | 1.27 ± 0.03 (1.22–1.33) |
| White male | 86.0 ± 5.6 (74.9–100.2) | 67.5 ± 3.6 (62.4–75.3) | 1.28 ± 0.07 (1.12–1.37) |
| P | .028 | .017 | .85 |
Data are presented as mean ± SD (range).
Table 2.
Tibial Measurements Categorized by Race and Sex
| Tibial Plateau Dimensions
|
Posterior Tibial Slope (deg)
|
|||||||
|---|---|---|---|---|---|---|---|---|
| MPAP (mm) | LPAP (mm) | Average AP (mm) | tML (mm) | tML/Avg. tAP | MPPS | LPPS | Average Posterior Slope | |
| Chinese female | 41.5 ± 3.0 (37.6–48.6) | 33.2 ± 3.2 (28.7–40.2) | 37.3 ± 2.8 (34.5–44.1) | 66.2 ± 2.1 (63.1–69.5) | 1.78 ± 0.10 (1.56–1.96) | 5.4 ± 2.3 (1.4–10.1) | 4.8 ± 2.8 (0.3–10.6) | 5.1 ± 2.3 (1.4–9.9) |
| White female | 43.4 ± 1.9 (39.2–46.5) | 35.2 ± 3.8 (26.5–40.0) | 39.3 ± 2.6 (34.1–43.3) | 69.0 ± 4.2 (61.3–74.4) | 1.76 ± 0.08 (1.58–1.89) | 6.5 ± 2.9 (0.6–10.7) | 5.8 ± 2.7 (0.8–10.4) | 6.1 ± 2.5 (0.7–9.8) |
| P | .029 | .089 | .036 | .016 | .442 | .223 | .287 | .208 |
| Chinese male | 46.1 ± 2.4 (42.0–49.5) | 36.8 ± 2.1 (34.1–40.7) | 41.5 ± 2.1 (38.0–45.1) | 75.2 ± 3.6 (67.6–81.5) | 1.82 ± 0.07 (1.70–1.95) | 6.0 ± 2.5 (2.7–12.0) | 5.2 ± 3.6 (−1.8–14.0) | 5.6 ± 2.8 (0.4–11.9) |
| White male | 49.3 ± 3.1 (42.5–53.5) | 40.7 ± 2.9 (35.6–48.4) | 45.0 ± 2.8 (39.9–50.2) | 78.7 ± 5.4 (67.1–89.1) | 1.75 ± 0.11 (1.58–1.97) | 5.1 ± 3.3 (−3.0–11.1) | 5.6 ± 2.7 (2.5–15.1) | 5.3 ± 2.5 (0.8–12.7) |
| P | .001 | .000 | .001 | .022 | .033 | .361 | .703 | .778 |
Data are presented as mean ± SD (range). MPAP, medial plateau anteroposterior dimension; LPAP, lateral plateau anteroposterior dimension; tML, tibial mediolateral dimension; MPPS, medial plateau posterior slope; LPPS, lateral plateau posterior slope; Avg. posterior tibial slope = (MPPS + LPPS)/2.
Chinese and White Females
The fML dimension of Chinese females (72.8 ± 2.6 mm; range, 70.0–79.1 mm) was significantly smaller than that of white females (76.4 ± 4.0 mm; range, 70.3–82 mm) (P = .002). The fAP dimension was 58.8 ± 2.5 mm (range, 53.2–63 mm) for Chinese females and 59.7 ± 2.6 mm (range, 54.6–64.1 mm) for white females. The difference in fAP dimension was not statistically significant (P = .352). A statistically significant difference was noted between the fML/fAP ratios of Chinese females (1.24 ± 0.04; range, 1.17–1.32) and white females (1.28 ± 0.06; range, 1.16–1.39) (P = .013). The morphological data showed a progressive decline in the fML/fAP ratio with increasing fAP dimension for both races (Fig. 3A). However, there was a distinct offset between the fML/fAP ratio of Chinese and white females, indicating that the Chinese females had a smaller fML/fAP ratio than white females for the same fAP dimension.
Fig. 3.

(A) The lines representing the average values for the femoral aspect ratio showed a progressive decline in the femoral ratio with increasing fAP dimension for both races. A distinct offset between the fML/fAP ratio of Chinese and white females was noticed. (B) The morphological data showed a progressive decline in the tibial aspect ratio with increasing average tAP dimension for both races. The lines representing change in tibial aspect ratio with increasing average tAP dimension for Chinese and white males were nearly coincident.
Measurements of tibia showed that the tibial size of Chinese females was generally smaller than that of white females. However, the tibial aspect ratio did no show any significant difference between Chinese (1.78 ± 0.1; range, 1.56–1.96) and white females (1.76 ± 0.08; range, 1.58–1.89) (P = .442). The medial/lateral posterior tibial slopes showed no difference between the 2 groups. The average medial slope was 5.4° ± 2.3° (range, 1.4°–10.1°) for Chinese females and 6.5° ± 2.9° (range, 0.6°–10.7°) for white females (P = .223). The average lateral slope was 4.8° ± 2.8° (range, 0.3°–10.6°) for Chinese females and 5.8° ± 2.7° (range, 0.8°–10.4°) for white females (P = .361).
Chinese and White Males
Chinese males had an average fML dimension of 82.6 ± 3.6 mm (range, 72.6–87.1 mm), which was significantly smaller than that of white males (86.0 ± 5.6 mm; range, 74.9–100.2 mm) (P = .028). The fAP size averaged 65.0 ± 2.8 mm (range, 59.4–70.3 mm) for Chinese males and 67.5 ± 3.6 mm (range, 62.4–75.3 mm) for white males. The difference was statistically significant between fAP size of Chinese and white males (P = .017). The femoral aspect ratio (fML/fAP) of Chinese males averaged 1.27 ± 0.03 (range, 1.22–1.33) and white males 1.28 ± 0.07 (range, 1.12–1.37), and there was no statistically significant difference (P = .85).
The tibial dimension of Chinese males was generally smaller than that of white males. A significant difference was noted for the tibial aspect ratio, with Chinese males averaging 1.82 ± 0.07 (range, 1.70–1.95) and white males averaging 1.75 ± 0.11 (range, 1.58–1.87) (P = .033). The morphological data showed a progressive decline in the tibial aspect ratio with increasing average tAP dimension for both races (Fig. 3B). The lines representing change in tibial aspect ratio with increasing average tAP dimension for Chinese and white males were nearly coincident. Therefore, the differences in tibial aspect ratios between the 2 groups may be caused by the average tAP dimensions of Chinese males that were generally smaller than those of white males.
The medial/lateral plateau posterior slope showed no significant difference between the 2 groups. The average medial slope was 6.0° ± 2.5° (range, 2.7°–12.0°) for Chinese males and 5.1° ± 3.3° (range, −3.0° to 11.1°) for white males (P = .361). The average lateral slope was 5.2° ± 3.6° (range, −1.8° to 14.0°) for Chinese males and 5.6° ± 2.7° (range, 2.5°–15.1°) for white males (P = .703).
Discussion
The present study showed that the dimensions of Chinese knees were generally smaller than white knees. In addition, Chinese females had a significantly narrower distal femur than white females, whereas Chinese males had a wider proximal tibia than their white counterparts. These results proved the hypothesis that there is a distinct difference in size and shape between the Chinese and white knees.
Many studies have reported on the measurements of white knees. Berger et al [14] studied 75 embalmed femurs and determined that the femoral mediolateral width was 85.6 ± 5.1 mm for white males and 75.4 ± 2.3 mm for females. Seedhom et al [15] reported the average fML dimensions on x-ray to be 86 mm and 75 mm for white males and females, respectively. Griffin et al [16] reported similar femoral ML measurements, 84.1 ± 4.4 mm for white males and 74.1 ± 4.6 mm for females, using MRI. These results agree quite closely with our measurements of the mediolateral dimension of the white femurs (86.0 ± 5.6 mm for males and 76.5 ± 4.1 mm for females). The lateral femoral AP length (similar to the fAP length in our study) reported by Berger et al [14] was 68.1 ± 4.6 mm for white males and 60.2 ± 2.0 mm for females, which are also quite comparable to our results (67.5 ± 3.6 mm for white males and 59.7 ± 2.6 mm for females).
Many studies have measured the femoral aspect ratio (fML/fAP) of white TKA patients intraoperatively, and their results are similar to ours. Poilvache et al [17] reported that the femoral aspect ratio was 1.333 for white males and 1.299 for females. Lonner et al [18] found this value to be 1.235 and 1.19 for white males and females, respectively. Chin et al [19] reported similar results, with femoral aspect ratio of 1.266 for white men and 1.22 for women. Our results are quite similar to these studies (1.28 ± 0.07 for white males and 1.28 ± 0.06 for white females). However, it should be stated that our data were measured from intact knee models, whereas others were measured from knees after bone cutting in TKA.
Morphological measurements of Chinese knees in the present study showed that both Chinese males and females had smaller fML and fAP dimension than their white counterparts. Although few studies have measured fML dimension of Chinese knees, several studies reported that the average fAP size of Chinese knees ranged from about 63.4 mm to 66.6 mm [1,2,20]. In general, these data are consistent with ours (65.0 ± 2.8 mm for Chinese males and 58.8 ± 2.5 mm for females). Cheng et al [1] reported the femoral aspect ratio to be 1.12 for Chinese males and 1.09 for females, which were smaller than our results (1.27 ± 0.03 for Chinese males and 1.24 ± 0.04 for females). The differences between the results might be explained by most of these studies that took into account the cartilage thickness in measurement of femoral AP dimension, whereas we measured the bony geometry.
A proper design of femoral aspect ratio of femoral TKA components is critical to obtain an ideal coverage of the resected bone surface [21]. The present study showed that Chinese females had a significantly smaller average fML/fAP ratio than white females (1.239 ± 0.042 vs 1.286 ± 0.063). A progressive decline in the fML/fAP ratio with increasing fAP dimension was also noted for both races (Fig. 3A). However, there was a distinct offset between the corresponding regression lines for Chinese and white knees, indicating that Chinese females had a smaller fML/fAP ratio than white females for the same fAP dimension. Thus, the differences in average values of femoral aspect ratio between Chinese and white females cannot be explained by differences in knee size alone, and this may point to a distinct variation in femoral shape between the 2 races. Given this, it is possible that the components designed based on white knee data may produce a mediolateral component overhang in Chinese females. Ho et al [2] found that 3 of 5 TKA systems used in China tended to overhang across the mediolateral width of resected femurs from Chinese patients, where 57 of 70 patients were females. Cheng et al [1] also found that the femoral component overhang was more obvious in Chinese females than males and suggested that the prostheses that were suitable for white patients may be too large for Chinese patients. An overhanging prosthesis is more likely to cause soft tissue irritation, soft tissue imbalance, and unfavorable patellofemoral stress distribution [4,21]. It is often needed to downsize the femoral components during TKA operation to avoid femoral component overhang. However, this may also result in undesirable outcomes, such as notching of the anterior cortex that can predispose to periprosthetic fractures [22] and overresection of the posterior femoral condyles resulting in an imbalance between the flexion and extension gaps [23].
The geometry of tibial plateau has a direct influence on the biomechanics of tibiofemoral joint and is considered as an important factor in TKA design and implantation [24,25]. However, little quantitative information is available in the literature regarding geometric difference of natural tibia between Asian and white people. Our study showed that Chinese subjects generally had a smaller size of proximal tibia than white subjects in both sexes. Interestingly, the tibial aspect ratio of Chinese males was significantly larger than that of white males (1.82 ± 0.07 vs 1.75 ± 0.11). However, the present study also found a larger tibial aspect ratio in small knees and a proportionally smaller ratio in large knees. Therefore, the differences of the tibial aspect ratios between the 2 groups may be caused by the average tAP dimensions of Chinese males that were generally smaller than those of white males. Further clinical measurement is necessary to verify the observation of this study.
Another important characteristic of the tibial plateau is its posterior slope. The most often applied method for posterior slope measurements is based on lateral radiographs, on which the medial and lateral tibial plateaus are superimposed [25,26]. We measured the medial and lateral posterior slope separately on a 3-dimensional surface, which allowed us to characterize the true slope of the tibial plateau at the center of the surfaces of the medial and lateral plateau. The data showed that there was no difference in medial/lateral posterior slope between Chinese and white subjects in either sex. The posterior tibial slope of 5° to 10° is frequently quoted for the normal knee [26]. In one MRI study, Hashemi et al [25] stated that the medial plateau slope was 3.7° for white males and 5.9° for females, and the lateral plateau slope was 5.4° for white males and 7.0° for females. Matsuda et al [27] reported that the mean tibial posterior slopes of the medial and lateral plateaus were 10.7° and 7.2°, respectively, in healthy white knees. Kuwano et al [28] measured the 3-dimensional bone models of osteoarthritic knees of Japanese patients and reported that the mean value of plateau slope was 9.0° for the medial plateau and 8.1° for the lateral plateau. In a cadaveric study, Chiu et al [26] reported that the average medial plateau slope was 14.8°, and the lateral plateau slope was 11.8° for Chinese knees. Our data showed that the average medial slope was 5.4° for Chinese females and 6.5° for white females. The average lateral slope was 4.8° for Chinese females and 5.8° for white females. Similarly, the average medial slope was 6.0° for Chinese males and 5.1° for white males, and the average lateral slope was 5.2° for Chinese males and 5.6° for white males. These results are similar to that of Hashemi et al [25], and the differences with other studies may be attributed to the differences in the choice of reference axes.
The purpose of the present study was to provide a comparison between anthropometric data of Asian and white population. Therefore, we measured the natural healthy knees instead of resected knees. Measurement on the resected bone may lead to differences in the measured dimensions due to variation in bone resection techniques and choice of TKA system [29]. Furthermore, the osteoarthritic knees requiring TKA, which have been measured by many studies, are deformed according to different disease stages and frequently have anatomical dimensions different from normal knees [2,5]. Therefore, we choose to measure intact normal knees. The explanation of the data has to take this into consideration.
One limitation of the present study is the relatively small sample size. This study included data from 76 healthy subjects but with each group having no more than 20 subjects. If a larger sample size was studied, other significant differences may also be noticed. However, the magnitude of the difference likely remains small. We are continuing to collect more subjects for each group. In future, we will report data for a larger sample size and we will also examine the TKA component mismatch data for Asian patients. These data may be useful for designing Asian-specific TKA systems. In addition, all the Chinese subjects recruited in the present study were from Chinese Han population, and the white subjects were recruited from the New England area of United States. Therefore, the subjects studied in the current study can only represent the subgroup populations of Chinese and/or white populations. Another limitation of the present study is that the 3-dimensional knee models were made from CT images for Chinese subjects, whereas for white subjects, the knee models were made from MRI images. This was because the subjects were recruited at different hospitals. However, a previous study in our laboratory showed the average difference between CT-based and MRI-based bone models to be 0.07 ± 1.1 mm [12].
In conclusion, the Asian knees in the current study were generally smaller in size than white knees, and this may be related to differences in height between the races. In addition, this study showed that Chinese females have a significantly narrower distal femur than white females for the same fAP dimension. On the tibial side, the study demonstrated that Chinese males have a wider proximal tibia than their white counterparts. However, the difference in tibial aspect ratio was likely a consequence of difference in average tAP dimension rather than an effect of race. These results suggest that a greater range of femoral implants sizes may be necessary to accommodate femoral aspect ratio variations specific to Asian knees, and further studies may be warranted to explore this issue in greater depth.
Acknowledgments
No benefits or funds were received in support of the study.
This study was made possible through grants received from the National Institutes of Health (R01-AR052408, R21-AR05107). The authors also gratefully acknowledge the support of the Shanghai Science and Technology Development Fund (09dz2200400), the Program for Shanghai Key Laboratory of Orthopedic Implant (08DZ2230330), and National Natural Science Foundation of China (30901517).
Footnotes
Ethical Board Review statement: This study was conducted with the approval of the Institute Review Board of Massachusetts General Hospital, and informed consent was obtained from all subjects before their inclusion in the study. In China, This study was conducted with the approval of the Institute Review Board of Shanghai Ninth People’s Hospital, and informed consent was obtained from all subjects prior to their inclusion in the study.
References
- 1.Cheng FB, Ji XF, Lai Y, et al. Three dimensional morphometry of the knee to design the total knee arthroplasty for Chinese population. Knee. 2009 doi: 10.1016/j.knee.2008.12.019. in press. [DOI] [PubMed] [Google Scholar]
- 2.Ho WP, Cheng CK, Liau JJ. Morphometrical measurements of resected surface of femurs in Chinese knees: correlation to the sizing of current femoral implants. Knee. 2006;13:12. doi: 10.1016/j.knee.2005.05.002. [DOI] [PubMed] [Google Scholar]
- 3.Urabe K, Miura H, Kuwano T, et al. Comparison between the shape of resected femoral sections and femoral prostheses used in total knee arthroplasty in Japanese patients: simulation using three-dimensional computed tomography. J Knee Surg. 2003;16:27. [PubMed] [Google Scholar]
- 4.Vaidya SV, Ranawat CS, Aroojis A, et al. Anthropometric measurements to design total knee prostheses for the Indian population. J Arthroplasty. 2000;15:79. doi: 10.1016/s0883-5403(00)91285-3. [DOI] [PubMed] [Google Scholar]
- 5.Yip DK, Zhu YH, Chiu KY, et al. Distal rotational alignment of the Chinese femur and its relevance in total knee arthroplasty. J Arthroplasty. 2004;19:613. doi: 10.1016/j.arth.2003.11.008. [DOI] [PubMed] [Google Scholar]
- 6.Iorio R, Kobayashi S, Healy WL, et al. Primary posterior cruciate-retaining total knee arthroplasty: a comparison of American and Japanese cohorts. J Surg Orthop Adv. 2007;16:164. [PubMed] [Google Scholar]
- 7.Zhang Y, Xu L, Nevitt MC, et al. Comparison of the prevalence of knee osteoarthritis between the elderly Chinese population in Beijing and whites in the United States: the Beijing Osteoarthritis Study. Arthritis Rheum. 2001;2065:44. doi: 10.1002/1529-0131(200109)44:9<2065::AID-ART356>3.0.CO;2-Z. [DOI] [PubMed] [Google Scholar]
- 8.Joshy S, Datta A, Perera A, et al. Ethnic differences in preoperative function of patients undergoing total knee arthroplasty. Int Orthop. 2006;30:426. doi: 10.1007/s00264-006-0115-x. [DOI] [PMC free article] [PubMed] [Google Scholar]
- 9.Inoue K, Hukuda S, Fardellon P, et al. Prevalence of large-joint osteoarthritis in Asian and white skeletal populations. Rheumatology (Oxford) 2001;40:70. doi: 10.1093/rheumatology/40.1.70. [DOI] [PubMed] [Google Scholar]
- 10.Kim HA, Kim S, Seo YI, et al. The epidemiology of total knee replacement in South Korea: national registry data. Rheumatology (Oxford) 2008;47:88. doi: 10.1093/rheumatology/kem308. [DOI] [PubMed] [Google Scholar]
- 11.DeFrate LE, Sun H, Gill TJ, et al. In vivo tibiofemoral contact analysis using 3D MRI-based knee models. J Biomech. 2004;37:1499. doi: 10.1016/j.jbiomech.2004.01.012. [DOI] [PubMed] [Google Scholar]
- 12.Wang S, Passias P, Li G, et al. Measurement of vertebral kinematics using noninvasive image matching method-validation and application. Spine. 2008;33:E355. doi: 10.1097/BRS.0b013e3181715295. [DOI] [PubMed] [Google Scholar]
- 13.Varadarajan KM, Gill TJ, Freiberg AA, et al. Gender differences in trochlear groove orientation and rotational kinematics of human knees. J Orthop Res. 2009 doi: 10.1002/jor.20844. [DOI] [PMC free article] [PubMed] [Google Scholar]
- 14.Berger RA, Rubash HE, Seel MJ, et al. Determining the rotational alignment of the femoral component in total knee arthroplasty using the epicondylar axis. Clin Orthop Relat Res. 1993:40. [PubMed] [Google Scholar]
- 15.Seedhom BB, Longton EB, Wright V, et al. Dimensions of the knee. Radiographic and autopsy study of sizes required by a knee prosthesis. Ann Rheum Dis. 1972;31:54. doi: 10.1136/ard.31.1.54. [DOI] [PMC free article] [PubMed] [Google Scholar]
- 16.Griffin FM, Math K, Scuderi GR, et al. Anatomy of the epicondyles of the distal femur: MRI analysis of normal knees. J Arthroplasty. 2000;15:354. doi: 10.1016/s0883-5403(00)90739-3. [DOI] [PubMed] [Google Scholar]
- 17.Poilvache PL, Insall JN, Scuderi GR, et al. Rotational landmarks and sizing of the distal femur in total knee arthroplasty. Clin Orthop Relat Res. 1996:35. doi: 10.1097/00003086-199610000-00006. [DOI] [PubMed] [Google Scholar]
- 18.Lonner JH, Jasko JG, Thomas BS. Anthropomorphic differences between the distal femora of men and women. Clin Orthop Relat Res. 2008;2724:466. doi: 10.1007/s11999-008-0415-0. [DOI] [PMC free article] [PubMed] [Google Scholar]
- 19.Chin KR, Dalury DF, Zurakowski D, et al. Intraoperative measurements of male and female distal femurs during primary total knee arthroplasty. J Knee Surg. 2002;15:213. [PubMed] [Google Scholar]
- 20.Wang SW, Feng CH, Lu HS. A study of Chinese knee joint geometry for prosthesis design. Chin Med J (Engl) 1992;105:227. [PubMed] [Google Scholar]
- 21.Hitt K, Shurman JR, 2nd, Greene K, et al. Anthropometric measurements of the human knee: correlation to the sizing of current knee arthroplasty systems. J Bone Joint Surg Am. 2003;85-A(Suppl 4):115. [PubMed] [Google Scholar]
- 22.Clarke HD, Hentz JG. Restoration of femoral anatomy in TKA with unisex and gender-specific components. Clin Orthop Relat Res. 2008;2711:466. doi: 10.1007/s11999-008-0454-6. [DOI] [PMC free article] [PubMed] [Google Scholar]
- 23.Greene KA. Gender-specific design in total knee arthroplasty. J Arthroplasty. 2007;22:27. doi: 10.1016/j.arth.2007.05.019. [DOI] [PubMed] [Google Scholar]
- 24.Uehara K, Kadoya Y, Kobayashi A, et al. Anthropometry of the proximal tibia to design a total knee prosthesis for the Japanese population. J Arthroplasty. 2002;17:1028. doi: 10.1054/arth.2002.35790. [DOI] [PubMed] [Google Scholar]
- 25.Hashemi J, Chandrashekar N, Gill B, et al. The geometry of the tibial plateau and its influence on the biomechanics of the tibiofemoral joint. J Bone Joint Surg Am. 2008;2724:90. doi: 10.2106/JBJS.G.01358. [DOI] [PMC free article] [PubMed] [Google Scholar]
- 26.Chiu KY, Zhang SD, Zhang GH. Posterior slope of tibial plateau in Chinese. J Arthroplasty. 2000;15:224. doi: 10.1016/s0883-5403(00)90330-9. [DOI] [PubMed] [Google Scholar]
- 27.Matsuda S, Miura H, Nagamine R, et al. Posterior tibial slope in the normal and varus knee. Am J Knee Surg. 1999;12:165. [PubMed] [Google Scholar]
- 28.Kuwano T, Urabe K, Miura H, et al. Importance of the lateral anatomic tibial slope as a guide to the tibial cut in total knee arthroplasty in Japanese patients. J Orthop Sci. 2005;10:42. doi: 10.1007/s00776-004-0855-7. [DOI] [PubMed] [Google Scholar]
- 29.Kwak DS, Surendran S, Pengatteeri YH, et al. Morphometry of the proximal tibia to design the tibial component of total knee arthroplasty for the Korean population. Knee. 2007;14:295. doi: 10.1016/j.knee.2007.05.004. [DOI] [PubMed] [Google Scholar]