Abstract
In vivo, the DNA methyltransferase inhibitor, 5-fluoro-2′-deoxycytidine (FdCyd, NSC-48006), is rapidly converted to its unwanted metabolites. Tetrahydrouridine (THU, NSC-112907), a cytidine deaminase inhibitor can block the first metabolic step in FdCyd catabolism. Clinical studies have shown that co-administration with THU can inhibit the metabolism of FdCyd. The National Cancer Institute is particularly interested in a 1:5 FdCyd/THU formulation. The purpose of this study was to investigate the in vitro pH stability of FdCyd and THU individually and in combination. A stability-indicating high-performance liquid chromatography method for the quantification of both compounds and their degradants was developed using a ZIC®-HILIC column. The effect of THU and FdCyd on the in vitro degradation of each other was studied as a function of pH from 1.0 to 7.4 in aqueous solutions at 37°C. The degradation of FdCyd appears to be first-order and acid-catalyzed. THU equilibrates with at least one of its degradants. The combination of FdCyd and THU in solution does not affect the stability of either compound. The stability and compatibility of FdCyd and THU in the solid state at increased relative humidity and at various temperatures are also evaluated.
Key words: degradation mechanism, FdCyd, NSC-112907, NSC-48006, THU
INTRODUCTION
The nucleoside analogue 5-fluoro-2′-deoxycytidine (FdCyd, NSC 48006) is being evaluated clinically as a DNA methyltransferase inhibitor. Unfortunately, FdCyd undergoes rapid metabolism in vivo by cytidine deaminase (1). Co-administration of FdCyd with tetrahydrouridine (THU), a cytidine deaminase inhibitor, prevents the rapid metabolism of FdCyd to its pharmacologically active metabolites and thus results in less side effects and more efficient hypomethylation (2–4). The purpose of this study was to investigate the pH stability and solid-state stability of the compounds individually and in combination. The chemical structures of FdCyd and THU are shown in Fig. 1a, b, respectively.
Fig. 1.
Chemical structures of FdCyd and THU
EXPERIMENTAL
Materials
The FdCyd and THU were provided by the Pharmaceutical Resources Branch, National Cancer Institute (Bethesda, MD) and were used as received. Hydrochloric acid, sodium citrate, sodium phosphate, sodium phosphate dibasic, sodium hydroxide, ammonium acetate, and 5-fluorocytosine were purchased from Sigma-Aldrich (St. Louis, MO). Glacial acetic acid and citric acid monohydrate were purchased from Mallinckrodt (Paris, KY). Sodium chloride and acetonitrile were obtained from Fisher Chemicals (Fair Lawn, NJ). All agents were of analytical grade and used without further purification. Water was purified using a Milli-Q system (18.2 MΩ cm, Millipore, Billerica, MA).
Buffer Preparation
The buffer systems used for the pH stability profile studies are listed in Table I. Since the formulation is intended to be orally delivered, the pH range is from 1 to 7.4. The buffers used were hydrochloric acid, citric acid–sodium citrate, and monosodium phosphate–disodium phosphate. A constant ionic strength of 300 mM was maintained for each buffer by adding an appropriate amount of NaCl. The buffer solutions were freshly prepared and the pH values measured by an Accumet® pH meter and H1 1083 glass electrodes. The pH meter was standardized with pH 2.0, 4.0, 7.0, and 10.0 solutions before each measurement.
Table I.
List of Buffer Solutions Prepared for Stability Studies
| pH | Buffer | Buffer strength (mM) | Ionic strength (mM) |
|---|---|---|---|
| 1 | HCl | 100 | 300 |
| 2 | Phosphate | 100 | 300 |
| 3 | Citrate | 100 | 300 |
| 4 | Citrate | 100 | 300 |
| 5 | Citrate | 100 | 300 |
| 7.4 | Phosphate | 100 | 300 |
High-Performance Liquid Chromatography Optimization
Reverse phase C18 and C8 columns provided poor retention for FdCyd and THU, which are polar compounds. A HILIC column was chosen for this study since it is especially suitable for hydrophilic analytes. The mobile phase contained a high concentration of acetonitrile to promote interactions between the analytes and the stationary phase.
An Agilent 1100 HPLC (Agilent Technologies, Santa Clara, CA) system equipped with a quaternary pump, an automatic injector, a diode array detector, and ChemStation® software was used. A ZIC®-HILIC column (5 μm, 4.6 × 150 mm) from Sequant AB (Umeå, Sweden) was used with a mobile phase composed of 85% acetonitrile for this study. The aqueous phase contained 25 mM acetic acid and 2.5 mM ammonium acetate. The flow rate was 0.5 mL/min, the column temperature was 20°C, and the injection volume was 10–40 μL. The UV detection wavelength was set at 210 nm with 360 nm as the reference. The high-performance liquid chromatography (HPLC) assay developed in this study can detect FdCyd, THU, and their major degradants.
Standard Solution
A 15% deionized water in acetonitrile solution was used to prepare the standard solutions of FdCyd and THU. The solution polarity was consistent with the HPLC mobile phase. All standard solutions were prepared and measured in duplicate. The intra-day and inter-day precision of injection was evaluated.
Differential Scanning Calorimetry
The differential scanning calorimetry (DSC) thermalgrams of the solid samples were obtained using a Q1000 differential scanning calorimeter (TA Instruments, New Castle, DE) equipped with TA Universal Analysis 2000 software. Samples with approximately 5 mg were sealed in hermetically crimped pans. DSC samples were heated at 5°C/min under nitrogen purge at a flow rate of 40 mL/min. The peak temperature was noted as the point corresponding to the onset of deviation from the baseline.
Thermogravimetric Analysis
The thermogravimetric analysis (TGA) curves were obtained using a Q1000 thermogravimetric analyzer (TA Instruments) linked to TA Universal Analysis 2000 software. All TGA runs were performed on samples in open aluminum pans with a nitrogen purge at 60 mL/min. Non-isothermal TGA was performed on 5-mg samples at a heating rate of 5°C/min.
Powder X-ray Diffractometry
The powder X-ray diffraction patterns of samples were determined at ambient temperature on a PANalytical MPD X’Pert Pro diffractometer with Cu Kα radiation using a circular rotating sample holder, a scan range of 4–90° 2θ, a scan step size of 0.004187, and a scan speed of 10.16 s per step.
Sample Preparation for pH Stability Studies
Duplicate stock solutions containing 1 mg/mL of FdCyd and/or 5 mg/mL of THU were prepared using the buffer systems mentioned above. The ratio of 1:5 in solution as well as in solid state was chosen by the National Cancer Institute. The solutions were stored in clear glass vials at 37°C. The data were collected at different intervals over 400 h. The pH values of samples were checked and adjusted to within ±0.2 units using concentrated HCl or NaOH.
Sample Preparation for Solid Stability and Compatibility
Fluorescent light was used for the photostability testing of solid FdCyd, THU, and physical mixtures (1:5) with and without grinding. The light source was four 32-W GEF32T8 light bulbs, each with a color temperature of 4100 K and a color rendering index of 86. The distance between the light and the samples was about 6 ft. Ground samples were prepared by hand grinding using an agate mortar and pestle. Control samples were kept in amber vials.
For the thermal stability, samples were incubated at 40°C/75% RH (which was maintained by a saturated solution of NaCl) for 1 month. The moisture absorption was monitored by following weight changes of samples that were loosely dispersed on a DSC aluminum pan to guarantee maximum exposure to the environment. To measure the content of drug and its degradation products, samples were dissolved using 15% deionized water in acetonitrile solution and analyzed using HPLC. The crystal transitions were monitored by DSC and X-ray powder diffraction (XRPD).
RESULTS AND DISCUSSIONS
Standard Curve
The linear concentration range for the FdCyd is 2–200 µg/mL at 215 nm and 20–200 µg/mL for THU at 195 nm. The correlation coefficient (r2) values are >0.998. The precision of intra-day and inter-day assay validation is <5%.
Separation
The retention times of the FdCyd and THU are approximately 6.5 and 16 min, respectively. A representative chromatogram of FdCyd in combination with THU is shown in Fig. 2a. After 8 days at pH 2, three degradants were detected as shown in Fig. 2b.
Fig. 2.
a Chromatograms of FdCyd and THU in combination at T = 0. b Chromatogram of FdCyd and THU and their degradants after 8 days at pH 2
Degradation Mechanism of FdCyd
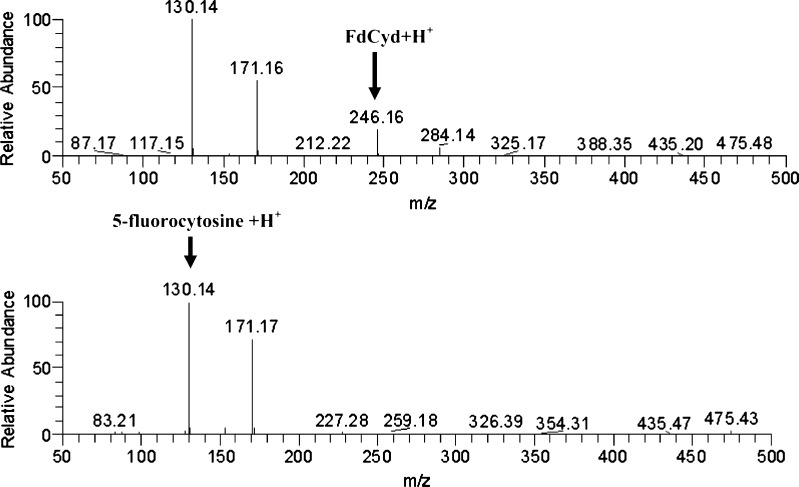
The proposed degradation mechanism of FdCyd is the cleavage of the N-glycosidic bond to form the products shown in Fig. 3. The spectrum of one degradant is identical to the reference compound 5-fluorocytosine purchased from Sigma-Aldrich. Its molecular weight was confirmed by mass spectrometry as shown in Fig. 4. Another degradant, 5-(hydroxymethyl)tetrahydrofuran-2,4-diol, was not detected by HPLC due to the lack of a chromophore in the molecule. The degradation mechanism of FdCyd does not change when THU is added to the solution.
Fig. 3.
Proposed degradation mechanism of FdCyd
Fig. 4.
Mass spectra of FdCyd (top) and 5-fluorocytosine (bottom)
Degradation Mechanism of THU
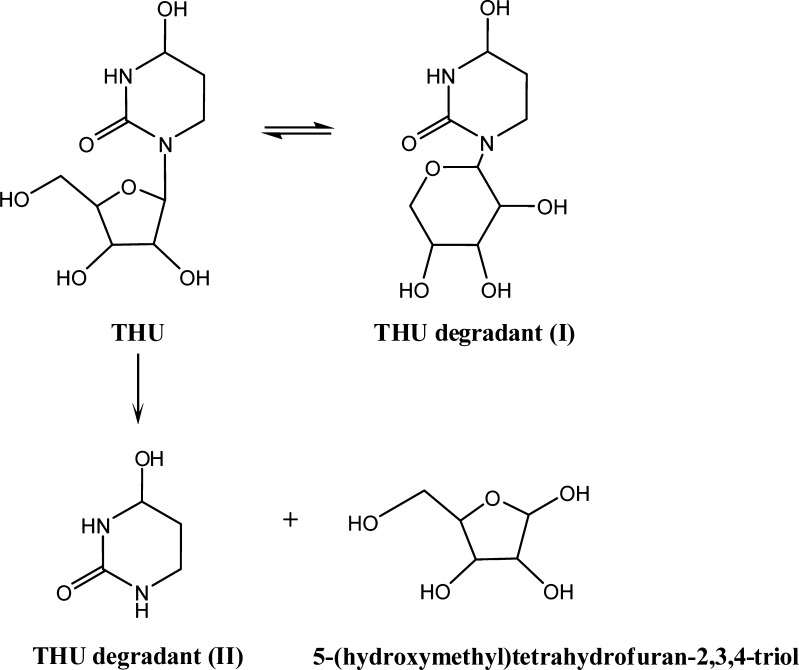
Xiang et al. (5) conducted a thorough study of the interconversion, isomerization, and hydrolysis of THU. THU decomposes by forming degradant (I) which is its ribopyranosyl isomer, degradant (II), and 5-(hydroxymethyl)tetrahydrofuran-2,3,4-triol which are hydrolysis products of slow N-glycosidic bond cleavage. Our results, shown in Figs. 5 and 6, are consistent with their results.
Fig. 5.
Degradation mechanism of THU
Fig. 6.
Mass spectra of THU (top) and degradant (I) (middle) and degradant (II)
Degradation Kinetics of FdCyd
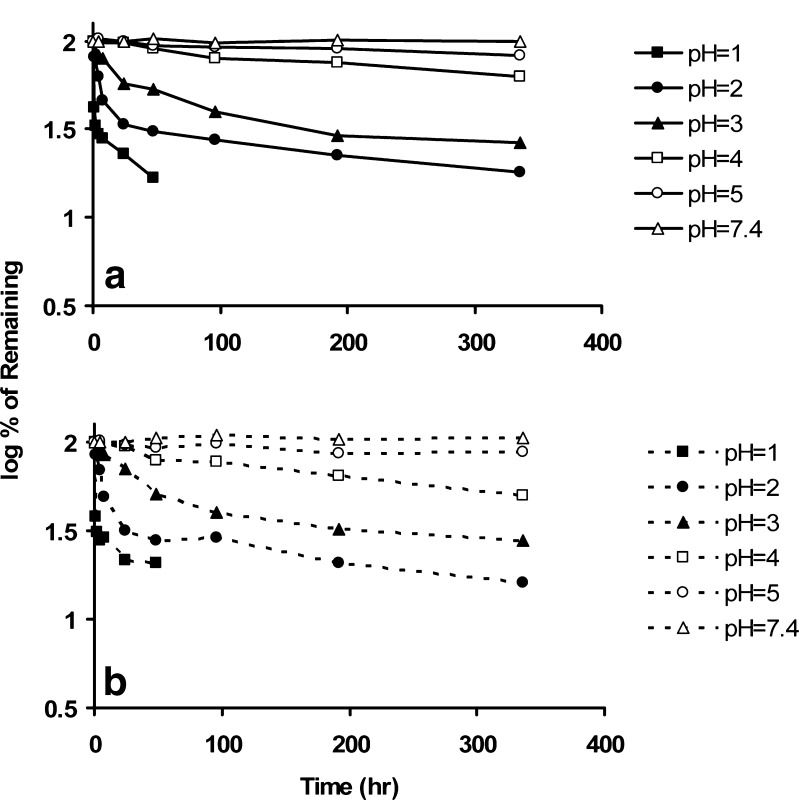
The degradation of FdCyd in the presence of THU is nearly identical to that of pure FdCyd as shown in Fig. 7a, b. In both cases, there are linear relationships between the logarithm of the remaining of FdCyd and the time described by  where [D0] and [D] are the initial and time-dependent concentrations of drug, kobs is the observed degradation rate constant, and t is time.
Fig. 7.
a Percentage remaining of FdCyd (in the absence of THU) vs. time. b Percentage remaining of FdCyd (in the presence of THU) vs. time
The kobs data for FdCyd degradation with and without THU at various pH values are listed in Table II and illustrated graphically in Fig. 8. It is clear that kobs for FdCyd is dependent on the pH but not affected by the presence of THU. There is no statistically significant difference between the rate constants listed in Table II with and without THU. The stability of FdCyd improves with an increase in pH, and there is minimal degradation above pH 5.
Table II.
Observed FdCyd Degradation Rate Constant k obs (h−1) at Different pH with and Without THU
| pH | Alone | In combination with THU |
|---|---|---|
| 1 | 0.00921 | 0.00898 |
| 2 | 0.00806 | 0.00599 |
| 3 | 0.00253 | 0.00230 |
| 4 | 0.000461 | 0.000461 |
| 5 | 0.000115 | 0.000138 |
| 7.4 | 0.000115 | 0.000092 |
Fig. 8.
pH-log K obs profile of FdCyd alone and in combination with THU at 37°C
Degradation Kinetics of THU
THU does not degrade by first-order kinetics. The flat minima in Fig. 9a, b show that THU reaches equilibrium with at least one of its degradation products.
Fig. 9.
a Percentage remaining of THU (in the absence of FdCyd) vs. time. b Percentage remaining of THU (in the presence of FdCyd) vs. time
Like FdCyd, the degradation of THU is also acid-catalyzed and minimal above pH 5. The degradation profile of THU alone is not significantly different from that of THU in combination with FdCyd.
Light Effects on Solid-State Stability
The melting points of FdCyd and THU were determined to be approximately 205°C and 150°C. After 30 days of storage at ambient temperature in clear and amber vials, no significant degradation was detected by HPLC for solid FdCyd, THU, or their 1:5 physical mixtures with and without grinding.
Temperature and Humidity Effect on Solid-State Stability
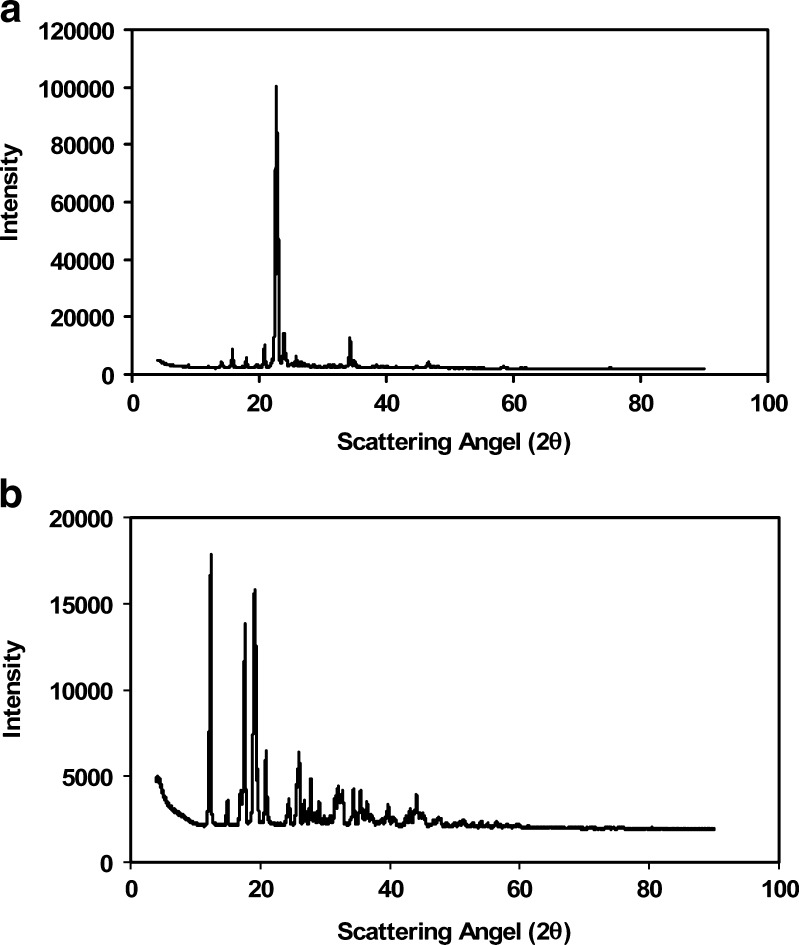
The X-ray powder diffraction patterns of FdCyd and THU at T = 0 are shown in Fig. 10a, b, respectively. Changes in weight were not observed for any of the samples under 40°C/75% RH after 1 month of storage. Results from XRPD, DSC, and TGA show that no significant water absorption occurred during this time period. Degradants were not detected by HPLC, indicating that FdCyd and THU are chemically compatible in solid state. Soft caking was noticed after 2 months for samples containing THU, which suggests a slight interaction between the drug and moisture. However, hydrate formation was not observed using DSC and TGA.
Fig. 10.
X-ray powder diffraction patterns for a FdCyd and b THU
Conclusions
An HPLC procedure that can separate FdCyd, THU, and their degradants was developed. The degradation of FdCyd appears to be first-order and an acid-catalyzed reaction, whereas THU equilibrates with at least one of its degradants. Combining FdCyd and THU in the solution does not affect the degradation mechanism or kinetics of either compound. Light has no effect on the solid-state stability at ambient temperature. Crystal transitions were not observed for samples stored under 40°C/75% RH for a 1-month period.
Acknowledgments
This work was supported by National Cancer Institute under the contract N01-CM-27142.
References
- 1.Beumer JH, Eiseman JL, Parise RA, Joseph E, Holleran JL, Covey JM, et al. Pharmacokinetics, metabolism, and oral bioavailability of the DNA methyltransferase inhibitor 5-fluoro-2′-deoxycytidine in mice. Clin Cancer Res. 2006;12:7483–7491. doi: 10.1158/1078-0432.CCR-06-1250. [DOI] [PubMed] [Google Scholar]
- 2.Beumer JH, Parise RA, Newman EM, Doroshow JH, Synold TW, Lenz H-J, et al. Concentrations of the DNA methyltransferase inhibitor 5-fluoro-2′-deoxycytidine (FdCyd) and its cytotoxic metabolites in plasma of patients treated with FdCyd and tetrahydrouridine (THU) Cancer Chemother Pharmacol. 2008;62:363–368. doi: 10.1007/s00280-007-0603-8. [DOI] [PubMed] [Google Scholar]
- 3.Stoller RG, Myers CE, Chabner BA. Analysis of cytidine deaminase and tetrahydrouridine interaction by use of ligand techniques. Biochem Pharmacol. 1978;27:53–59. doi: 10.1016/0006-2952(78)90256-3. [DOI] [PubMed] [Google Scholar]
- 4.Boothman DA, Briggle TV, Greer S. Tumor-selective metabolism of 5-fluoro-2′-deoxycytidine coadministered with tetrahydrouridine compared to 5-fluorouracil in mice bearing Lewis lung carcinoma. Cancer Res. 1987;47:2354–2362. [PubMed] [Google Scholar]
- 5.Xiang T, Niemi R, Bummer P, Anderson BD. Epimer interconversion, isomerization, and hydrolysis of tetrahydrouridine: implications for cytidine deaminase inhibition. J Pharma Sci. 2003;92:2027–2039. doi: 10.1002/jps.10447. [DOI] [PubMed] [Google Scholar]


