Abstract
Using combined morphological and electrophysiological approaches, we have determined the composition of inhibitory synapses of the nucleus tractus solitarii (NTS), a brainstem structure that is a gateway for many visceral sensory afferent fibres. Immunohistochemical experiments demonstrate that, in adult rat, GABA axon terminals are present throughout the NTS while mixed GABA–glycine axon terminals are strictly located to the lateral part of the NTS within subnuclei surrounding the tractus solitarius. Purely glycine axon terminals are rare in the lateral part of the NTS and hardly detected in its medial part. Electrophysiological experiments confirm the predominance of GABA inhibition throughout the NTS and demonstrate the existence of a dual inhibition involving the co-release of GABA and glycine restricted to the lateral part of NTS. Since GABAA and glycine receptors are co-expressed postsynaptically in virtually all the inhibitory axon terminals throughout the NTS, it suggests that the inhibition phenotype relies on the characteristics of the axon terminals. Our results also demonstrate that glycine is mostly associated with GABA within axon terminals and raise the possibility of a dynamic regulation of GABA/glycine release at the presynaptic level. Our data provide new information for understanding the mechanisms involved in the processing of visceral information by the central nervous system in adult animals.
Introduction
The nucleus tractus solitarii (NTS) is a major integrative centre for a wide range of homeostatic reflex pathways (Potts, 2002; Bonham et al. 2006; Travagli et al. 2006). Visceral information is first conveyed by cranial nerves from the viscera to the NTS via a fibre bundle, the tractus solitarius. Thus, the first step of information processing occurs within the NTS through local neural networks before being sent out to several brain areas such as the ventrolateral medulla, the parabrachial nucleus and the hypothalamus. Most studies have focused on the properties of excitatory synapses within the NTS but the properties of inhibitory connections have been less thoroughly investigated.
Yet, numerous studies indicate that GABA is involved in respiratory, cardiovascular and gastrointestinal regulation (Bennett et al. 1987; Jordan et al. 1988; Feldman & Felder, 1991; Bonham, 1995; Andresen & Mendelowitz, 1996; Zhang & Mifflin, 1998; Tabata et al. 2001; Ezure & Tanaka, 2004; Kubin et al. 2006; Potts, 2006; Travagli et al. 2006; Edwards et al. 2007; Sabbatini et al. 2008). About one-third of axon terminals of NTS contain GABA (Saha et al. 1995; Torrealba & Muller, 1999), and inhibitory transmission is predominantly mediated by GABAA receptors (GABAARs; Feldman & Felder, 1991; Butcher et al. 1999; Kasparov et al. 2001; Edwards et al. 2007; Li & Yang, 2007; McDougall et al. 2008).
Glycinergic axon terminals have been detected in the NTS (Cassell et al. 1992; Rampon et al. 1996; Saha et al. 1999). However, the role of glycine as inhibitory neurotransmitter in the NTS has been much less investigated. Direct activation of glycine receptors by exogenous application of glycine produces a decrease of NTS neuron firing activity both in vivo and in vitro (Bennett et al. 1987; Jordan et al. 1988; Talman & Robertson, 1989; Feldman & Felder, 1991; Pimentel et al. 2003). However, in most in vitro studies, evoked or spontaneous IPSPs recorded from NTS neurons appeared to be solely mediated by GABA (Fortin & Champagnat, 1993; Butcher et al. 1999; Kasparov et al. 2001). Contrariwise, two studies have reported that IPSPs evoked after electrical stimulation of the intermedius nucleus of the medulla or the tractus solitarius are partly mediated by glycine in a small subset of NTS neurons (Edwards et al. 2007; Li & Yang, 2007). Whether glycine is used as inhibitor in a specific anatomical pathway within the NTS and/or acts as a co-transmitter with GABA remain unknown.
The present study was undertaken to determine the composition of inhibitory synapses within the NTS of adult rat by focusing on GABA versus glycine inhibition using immunocytochemistry and quantitative analysis, as well as electrophysiological recordings. The results establish a differential anatomical distribution of GABA and glycine synapses in the NTS of adult rat. They also provide the first physiological evidence for the co-release of GABA and glycine in the NTS. The relevance of these data to the processing of visceral information will be discussed.
Methods
Immunohistochemistry
All experimental procedures were designed to minimize animal suffering and were in agreement with the European Communities Council directive (86/609/EEC). All neuroanatomical experiments were performed on adult male Wistar rats (180–200 g). Inhibitory axon terminals were visualized by immunodetection of the vesicular inhibitory amino acid transporter (VIAAT, 1/500) and the subtype 2 of the glycine transporter (glyT2, 1/2000), and by using a mixture of antibodies against the 65 kDa and the 67 kDa isoforms of glutamate decarboxylase (GAD65/67, 0.5 μg ml−1). Synaptic contacts were analysed using antibodies raised against the cytomatrix protein bassoon (a marker of the presynaptic active zone, 3 μg ml−1), gephyrin (3 μg ml−1), the β2/3 subunits of GABAAR (3 μg ml−1) and the α1–4 subunits of glyR (4 μg ml−1). As a control an antibody raised against the gluR2 subunit of the AMPA receptor (gluR2, 2.4 μg ml−1) was also used. The characteristics, specificity and sources of the antibodies are presented in Table 1.
Table 1.
List of primary antibodies
| Protein | Species | Source code no. | Antigen | Specificity and references |
|---|---|---|---|---|
| VIAAT | Rabbit polyclonal | Synaptic Systems1 131 003 | Synthetic peptide (residues 75–87 in rat) | By WB the AB recognizes a band at ∼55–60 kDa1 |
| glyT2 | Guinea-pig polyclonal | Millipore2 AB1773 | Synthetic peptide from rat C-terminal region of glyT2 | By WB the AB recognizes a broad band between 90 and 110 kDa5 |
| Gephyrin | Mouse monoclonal | Synaptic Systems1 no. 147011 | Purified rat gephyrin (N-terminus epitope) | By WB the AB recognizes an ∼93 kDa band4 |
| GAD65 | Mouse monoclonal | Millipore2 MAB351 | Purified rat brain GAD | By WB the AB recognizes an ∼65 kDa band2 |
| GAD67 | Mouse monoclonal | Millipore2 MAB5406 | Recombinant GAD67 residues from N-terminus region | By WB the AB recognizes an ∼67 kDa band2 |
| gluR2 | Mouse monoclonal | Millipore2 no. MAB397 | Recombinant GluR2 residues 175–430 | By WB the AB recognizes an ∼102 kDa band2 |
| GABAAR β2/3 subunits | Mouse monoclonal | Millipore2 no. 05-474 | Affinity-purified GABAA receptor isolated from bovine brain (N-terminus epitope of β subunit) | By WB the AB recognizes two bands at 57 (β2) and 55 (β3) kDa2 |
| glyR panα subunits | Mouse monoclonal | Synaptic Systems1 146011 | Purified rat glycine receptor (N-terminus epitope of α subunits) | By WB the AB recognizes an ∼50 kDa band1 |
| Bassoon | Mouse monoclonal | Stressgen3 VAM-P300C | Recombinant bassoon residues 783–1035 | By WB the AB recognizes an ∼400 kDa band3 |
Synaptic Systems, Goettingen, Germany. http://www.sysy.com.
Millipore, Billerica, MA, USA; http://www.millipore.com.
Assay Designs, Inc., Ann Arbor, MI, USA; Stressgen; http://www.assaydesigns.com.
VIAAT, GAD65/67, glyT2, gephyrin and bassoon were detected with conventional immunofluorescence. Animals were anaesthetized with a ketamine (50 mg ml−1) and xylazine (7.5 mg ml−1) solution at a dose of 2 ml kg−1i.m. and perfused through the ascending aorta with a constant flow (12 ml min−1) of ice-cold 4% paraformaldehyde in phosphate buffer (PB, 0.1 m, pH 7.4). The brain was extracted immediately after perfusion and rinsed overnight in PB. Brainstem coronal sections (50 μm thick) were obtained with a vibrating blade microtome (Leica VT1000S, Leica Microsystems, Wetzlar, Germany). Immunofluorescence was performed on free-floating sections as follows. After incubation for 45 min in 10% normal goat serum (NGS; Jackson ImmunoResearch Laboratories Inc., West Grove, PA, USA) in PB containing 0.9% NaCl (phosphate-buffered saline, PBS), sections were sequentially incubated with primary antibodies (Table 1) diluted in PBS overnight at 4°C, incubated in appropriate secondary antibodies conjugated with either Alexa Fluor 488 (Al-488; 1/500; Molecular Probes/Invitrogen), Cy3 or Cy5 (1/500; Jackson ImmunoResearch Laboratories) for 1 h. Finally sections were mounted on slides and coverslipped using glycerol–PB 0.2 m (50:50) as mounting medium.
For electron microscopy, VIAAT GAD, glyT2 and gephyrin were detected with immunoperoxidase using appropriate biotinylated secondary antibodies (goat anti-rabbit IgG, goat anti-mouse IgG, donkey anti-guinea pig IgG; 1/50; Jackson ImmunoResearch Laboratories) and avidin–biotin–peroxidase complex (ABC kit, Vector Laboratories Inc., Burlingame, CA, USA). Gephyrin was also detected with pre-embedding immunogold using goat anti-mouse ultra small gold (1/100; Aurion, Wageningen, The Netherlands); gold particles were silver enhanced using the silver enhancement kit from BBInternational (Cardiff, UK). Ultra-thin sections were examined on a Phillips CM10 electron microscope equipped with a digital camera (Advanced Microscopy Techniques, Danvers, MA, USA).
An antigen retrieval procedure was used to detect GABAAR, glyR, gluR2 associated with VIAAT, gephyrin and bassoon. Antigen retrieval by microwave irradiation increases the detection of synaptically located antigens (45 s, 800 W; Fritschy et al. 1998; Lachamp et al. 2003, 2005). Rats were decapitated under halothane anaesthesia. Brainstems were removed and immediately frozen in cold isopentane (−50°C). Coronal brainstem sections (14 μm thick) were obtained on a cryostat, thaw-mounted on gelatinized glass slides and stored at −20°C. Slide-mounted cryostat sections were fixed by immersion in phosphate buffer containing 0.5% paraformaldehyde under microwave irradiation. Because two or three primary antibodies from the same species were used, triple fluorescence detection was carried out by pre-labelling antibodies to glyR, gephyrin or basson with dye coupled Fab (Balland et al. 2008). Triple immunofluorescence labelling was carried out as follows. For triple detection of GABAAR–gephyrin–glyR or of gluR2–gephyrin–glyR, sections were blocked with NGS, incubated with mouse anti-GABAAR or mouse anti-gluR2 (overnight) followed by Al-488-conjugated goat anti-mouse (Molecular Probe; 1/500 each, 1 h). After a second blocking step with mouse immunoglobulins (Jackson ImmunoResearch Laboratories), sections were incubated overnight with antibodies to gephyrin and glyR pre-labelled with Cy3 and Cy5 conjugated anti-mouse Fab, respectively. For triple detection of gephyrin, GABAAR or glyR with VIAAT–bassoon, a mixture of mouse anti-gephyrin (or anti-GABAR or anti-glyR) and rabbit anti-VIAAT was applied on sections (overnight) followed by a mixture of Al-488-conjugated goat anti-mouse and Cy5-conjugated goat anti-rabbit (Molecular Probes; 1/500 each, 1 h). Bassoon was detected by incubation with the pre-labelled antibody with Cy3 conjugated anti-mouse Fab.
Control experiments
Specificities of the different primary antibodies are given in Table 1. No staining corresponding to specific labelling was observed when primary antisera were omitted. In multiple labelling experiments using primary antibodies from different species, the lack of cross-reactivity of the secondary antibodies was consistently checked. For multiple labelling using primary antibodies from the same species, the lack of cross-reactivity of the secondary antibodies was checked by incubating sections with Cy3- or Cy5-conjugated anti-mouse Fab fragments neutralized with an excess of mouse immunoglobulins. Furthermore, we tested our immunocytochemistry and quantitative analysis protocols (see Results) by checking the absence of colocalisation of gephyrin and glyR labelling (markers of inhibitory synapses) with gluR2 labelling (the AMPA receptor major subunit of excitatory synapses within the NTS; Lachamp et al. 2003; Balland et al. 2006).
Image acquisition
Confocal images were acquired on a Leica TCS SP2 laser scanning microscope (Leica Microsystems) using the 488 nm band of an argon laser for excitation of Al-488 (spectral detection, 492–532 nm) and the 543 and 633 nm bands of two helium–neon lasers for excitation of Cy3 and Cy5, respectively (spectral detection 566–634 and 644–799 nm). High-magnification images were acquired using a 63× oil immersion objective (NA 1.32). Pinhole size was set to ‘Airy one’ to achieve the best possible resolution (theoretical lateral and axial limits, 165 and 330 nm, respectively) without reducing luminosity. Pixel size was set to 58 nm (i.e. approximately one-third of the theoretical lateral resolution) by adjusting the scanning zoom factor. For each channel, photomultiplier gains and offsets were adjusted to use the full image dynamic range leaving minimal numbers of either ‘blind’ or saturated pixels. Images (1024 × 1024 pixels) were obtained by scanning at 200 Hz with a four time averaging. Quantitative analysis was performed on high-magnification images (one image from each channel) using the public domain NIH Image software and custom-made macros. Image editing was performed using Adobe Photoshop.
Slice preparation
Adult male Wistar rats (25–35 postnatal days) were used and preparation of medullary slices was carried out as described before (Lachamp et al. 2003; Balland et al. 2006, 2008). Animals were anaesthetized first with halothane. The brainstem was quickly removed, cooled to 4°C, and cut on a vibrating blade microtome into 300 μm-thick medullary slices in oxygenated (95% O2–5% CO2, pH 7.4) saline containing (mm): 130 NaCl, 3 KCl, 0.5 CaCl2, 4 MgCl2, 26 NaHCO3, 1.25 KH2PO4, 10 glucose, 0.5 ascorbate, 2 pyruvate, 3 myo-inositol, 0.05 acid aminophosphonovalerate (APV). Slices were then allowed to recover for 1 h in a similar saline containing 2 mm CaCl2, 2 mm MgCl2 and no APV at room temperature.
Electrophysiology
For recordings, slices were perfused in a chamber at 1–3 ml min−1 with a similar physiological solution containing 2 mm CaCl2, 2 mm MgCl2, tetrodotoxin (1 μm) and kynurenate (a blocker of glutamate ionotropic receptors, 2 mm) at 32–34°C. Gabazin (5 μm), strychnine (3 μm) and/or Flunitrazepam (3 μm) were added in the standard solution as needed. Patch electrodes (2.5–5 MΩ) contained (mm): 130 caesium chloride, 10 NaCl, 1 MgCl2, 1 CaCl2, 10 EGTA, 2 ATP, 0.3 GTP, 10 glucose, 10 Hepes (pH 7.4). Biocytin (1%) was routinely added in the intracellular solution for further anatomical identification.
Data acquisition and analysis
Whole-cell patch-clamp recordings of NTS neurons were made with an Axopatch 200B (Axon instruments/Molecular Devices, Sunnyvale, CA, USA), filtered at 2 kHz and digitized at 20 kHz with pCLAMP 9.0 (Molecular Devices). Series resistance was continuously monitored throughout the experiment by delivering a voltage step command at the end of each trace recorded. Neurons in which this parameter was > 20 MΩ or unstable were discarded. Neurons in which input resistance and holding current were less than 300 MΩ and greater than −100 pA at a holding potential of −70 mV were also discarded. Miniature inhibitory postsynaptic currents (mIPSCs) were recorded at this holding potential for at least 4 min in different pharmacological conditions. Threshold for their detection was set at 3× root mean square noise level. Five minutes after break-in, 500–2000 contiguous events per cell were acquired. Off-line analysis was made with the mini analysis software (Synaptosoft, Inc., Decatur, GA, USA). The mean frequency of mIPSCs was determined for each neuron as the number of events per second during a period from 4 to 6 min. For kinetics analysis, 150–400 mIPSCs were carefully selected by visual inspection based on the following criteria: fast rise time, stable baseline holding current, absence of spurious fluctuations during the mIPSC decay, separation with the next event of at least 150 ms. The decay time constants (τ) of inhibitory synaptic currents were obtained by automatically fitting the decay phase with a single or a double exponential equation. Comparison of fit goodness (one versus two exponentials) was made by an R2 measure. For each mIPSC analysed, goodness of fit was nevertheless checked by visual inspection. For events that yielded decay time constant values greater than one-third of the analysis window duration (usually 150 ms), the duration of the analysis window was lengthened, when possible, to appropriate values or the event was discarded. Overall, less than 5% of synaptic events were thus discarded for inadequate fitting, generally due to spurious baseline fluctuations. The general fitting equation was: F(t) =Afastexp(−t/τfast) +Aslowexp(−t/τslow).Thus, the weighted decay time (Tw) was calculated according to: Tw= (τfastAfast+τslowAslow)/(Afast+ Aslow) where Afast and Aslow are the relative amplitudes of the two exponential components. For mixed GABAAR–glyR mediated mIPSCs, the relative contribution of GABA to glycine was calculated by dividing Aslow by (Afast+Aslow).
Statistical procedures
Data were expressed as means ±s.e.m. unless otherwise noted. Significance of the difference between means of two samples was computed with the non-parametric Wilcoxon's matched pairs test or the unpaired Mann–Whitney test. Differences in distribution were assessed by the Kolmogorov–Smirnov test. The differences were considered significant at P < 0.05. Statistical tests were computed by using Kyplot (KyensLab Inc., Tokyo, Japan) or Instat (GraphPad Software Inc., La Jolla, CA, USA).
Results
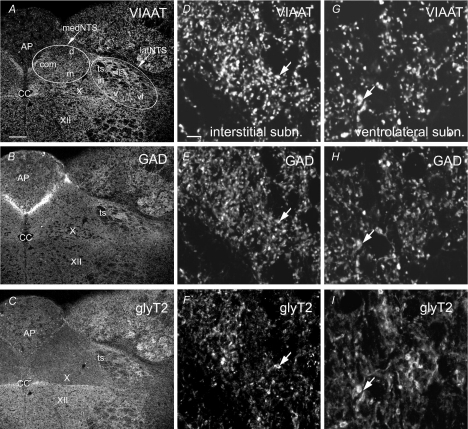
All experiments were performed in the caudal part of NTS, at the level of the area postrema. This region is composed of several subnuclei (Fig. 1A). Subnuclei surrounding the tractus solitarius (interstitial, ventrolateral, ventral and intermediate subnuclei) were regrouped in our analysis, and named lateral NTS (latNTS). Subnuclei located more medially to the tractus solitarius (medial, dorsal and commissural subnuclei) were regrouped and named medial NTS (medNTS).
Figure 1. Confocal views showing immunofluorescence for VIAAT, GAD65/67 (GAD) and glyT2 within adult rat NTS.
A–C, two subregions are distinguished: the medial part of the NTS (medNTS) is located medial to the tractus solitarius (ts); the lateral part of the NTS (latNTS) regroups subnuclei surrounding the tractus solitarius. D–I, higher magnifications of the interstitial (D–F) and the ventrolateral (G–I) subnuclei showing numerous putative immunoreactive axon terminals (e.g. arrows). AP, area postrema; cc, central canal; com, commissural subnucleus; d, dorsal subnucleus; in, intermediate subnucleus; is, interstitial subnucleus; m, medial subnucleu; v, ventral subnucleus; vl, ventrolateral subnucleus; X, dorsal motor nucleus of the vagus; XII, hypoglossal nucleus. Scale bars = 146 μm for A–C, 5.8 μm for D–I.
Relative distribution of inhibitory presynaptic terminals in adult NTS
The relative distribution of GABA, glycine and mixed GABA–glycine axon terminals was analysed using the immunodetection of different markers. Since glycine and GABA shared VIAAT as vesicular transporter, VIAAT is commonly used as a reliable marker of inhibitory axon terminals (McIntire et al. 1997; Sagnéet al. 1997; Dumoulin et al. 1999). The glycine transporter glyT2 is used as a marker for glycinergic axon terminals (Zeilhofer et al. 2005; Aubrey et al. 2007; Rousseau et al. 2008). The synthesis of GABA from glutamate depends upon two distinct isoforms of the glutamate decarboxylase, GAD65 and GAD67 (GAD65/67) that have been extensively used as a GABAergic marker (Esclapez et al. 1994; Fukuda et al. 1997). Therefore, inhibitory axon terminals were visualized by immunodetection of VIAAT as a general marker and by immunodetection of GAD65/67 or glyT2 to discriminate between GABA and glycine terminals, respectively.
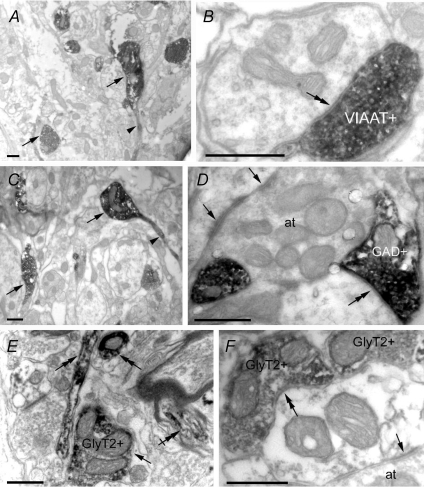
Immunoreactivity for VIAAT was present throughout the subnuclei of the NTS and in the surrounding structures such as the dorsal motor nucleus of the vagus nerve and the hypoglossal nucleus (Fig. 1A). Similarly, labelling for GAD65/67 was present all over the NTS (Fig. 1B). In contrast, glyT2 immunoreactivity was almost restricted to latNTS (Fig. 1C). At higher magnification, VIAAT, GAD65/67 and glyT2 immunoreactivities appeared as patchy labelling (e.g. Fig. 1D–I). Examined under electron microscopy immunoperoxydase for VIAAT, GAD65/67 and glyT2 was present within numerous axon terminals establishing symmetrical synapses (Fig. 2). In addition, glyT2 immunoreactivity was present in axons that could be myelinated (Fig. 2E). Therefore most of the VIAAT and GAD65/67 patchy labelling observed in immunofluorescence corresponded to inhibitory axon terminals, while glyT2 immunofluorescence corresponded to axon terminals and axons.
Figure 2. Electronic micrographs of VIAAT (A and B), GAD65/67 (GAD; C and D) and glyT2 (E and F) within adult rat NTS after immunoperoxidase.
Labelling for VIAAT, GAD or glyT2 is present in axon terminals (arrows in A, C and E, respectively). GAD and VIAAT labelling can also be found present in pre-terminal axonal processes (arrowhead in A and C). GlyT2 labelling is present in axons (double arrows in E) that can be myelinated (crossed double arrow in E). Axon terminals positive for VIAAT, GAD or glyT2 establish symmetric synapses (double arrow in B, D and F). Asymmetric synapses (arrows in D and F) are visible and associated to negative axon terminals (at). Scale bars = 0.5 μm.
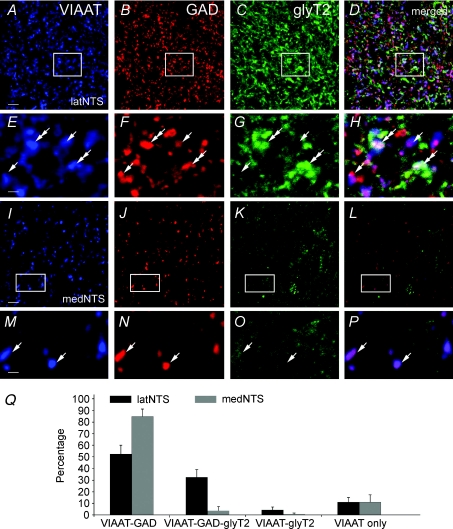
To determine the distribution of putative GABA, glycine or both GABA and glycine releasing axon terminals, triple immunofluorescence for VIAAT, GAD65/67 and glyT2 was performed (Fig. 3A–P). Results indicated that VIAAT positive axon terminals contained GAD65/67 labelling co-localized or not with glyT2 immunoreactivity. Using VIAAT immunoreactivity as a marker for both GABAergic and glycinergic inhibitory axon terminals, we quantified the proportion of axon terminals immunoreactive for VIAAT that contained GAD65/67, glyT2 or both immunoreactivities within lateral and medial NTS. The quantification was performed as follows. Delineation of positive axon terminals was obtained after an automatic intensity thresholding of confocal images (Image J macro) from VIAAT, GAD65/67 and glyT2 labellings. Binary masks were generated from thresholded VIAAT, GAD65/67 and glyT2 images (Supplemental Material, Supplemental Fig. 1A and D, B and E, C and F, respectively). Delineated VIAAT positive axon terminals were classified as positive for GAD65/67, glyT2 or both GAD65/67 and glyT2, if binarized VIAAT labellings overlapped with binarized GAD65/67 or glyT2 labellings after performing a logical AND operation (Image J macro; Supplemental Fig. 1G, H and I, respectively). The number of VIAAT-positive axon terminals positive for GAD65/67, glyT2 or both was automatically counted (Image J). The percentages (expressed as means ±s.d.) of the different populations of axon terminals were obtained relative to the total number of VIAAT positive axon terminals (100%) and compared between medial and lateral NTS (Fig. 3Q). Data were obtained from a total of 6 animals, 12 brain sections and 3357 putative VIAAT positive axon terminals. Results indicated that VIAAT–GAD65/67 immunoreactive axon terminals were predominant in medNTS (88 ± 6%) and also, but to a lesser extent, in latNTS (52 ± 7%). VIAAT–GAD65/67–glyT2 immunoreactive axon terminals represented 32 ± 7% of the VIAAT positive axon terminals in latNTS, but were very rare (4 ± 3%) in medNTS. VIAAT–glyT2 immunoreactive axon terminals were rarely seen in latNTS (4 ± 2%) and nearly absent from the medNTS (less than 1%). All these results demonstrated that inhibitory axon terminals are endowed with the machinery to release GABA, or GABA and glycine. They suggested that GABA axon terminals are present throughout the NTS, while GABA–glycine axon terminals (and the few pure glycinergic axon terminals) are strictly located in the latNTS. In both latNTS and medNTS, 10% of VIAAT positive axon terminals co-expressed neither GAD65/67 nor glyT2 immunoreactivities; this could represent terminals where expression of GAD65/67 or glyT2 was below the detection threshold of immunocytochemical procedures.
Figure 3. Relative distribution of axon terminals immunoreactive for VIAAT, GAD65/67 (GAD) and glyT2 in rat NTS.
A–D, numerous axon terminals are immunoreactive for VIAAT (A), GAD (B) and glyT2 (C) in latNTS. E–H, enlarged views of areas framed in A–D show that VIAAT positive terminals (arrows and double arrows) co-express immunoreactivity for GAD only (arrows) or for both GAD and glyT2 (double arrows). I–L, in medNTS numerous terminals are immunoreactive for VIAAT and GAD, but glyT2 labelling is almost absent. M–P, enlarged views of framed areas in I–L show that VIAAT positive terminals are immunoreactive only for GAD (arrows). Scales bar = 5.8 μm for A–D and I–L; 1.45 μm for E–H and M–P. Q, percentages of axon terminals immunoreactive for VIAAT and GAD65/67, or immunoreactive for VIAAT and glyT2, or immunoreactive for VIAAT, GAD65/67 and glyT2 in the lateral (black) and medial (grey) NTS. Error bars show s.d., n= 6 rats.
GABAAR, glyR and gephyrin are present in inhibitory synapses of adult NTS
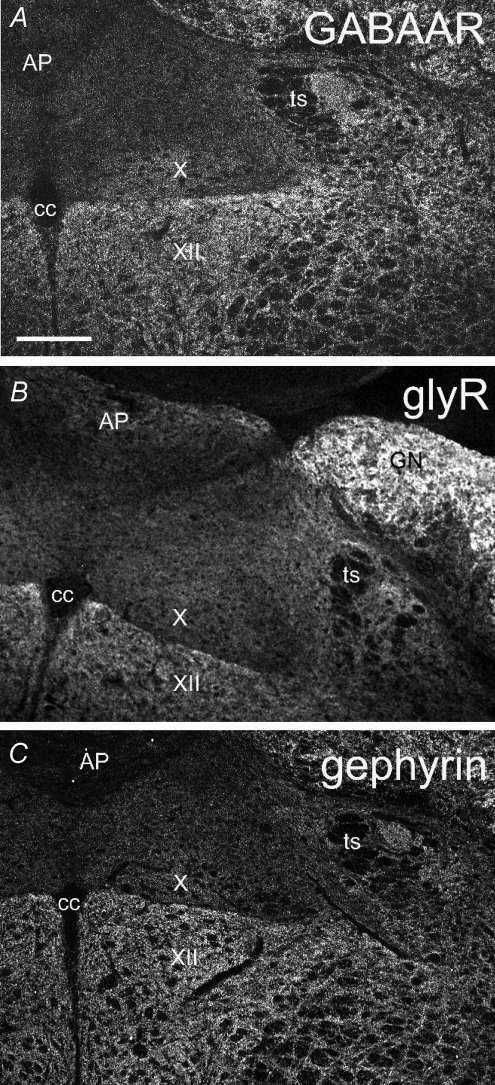
After analysing the content of inhibitory axon terminals, we investigated the presence of GABAAR and glyR in the postsynaptic density. An antibody directed to the β2/3 subunits was used to label most, if not all, of the GABAARs in the NTS. β2 and β3 subunits are present in the majority of native GABAARs (Olsen & Sieghart, 2009) and are highly expressed in the NTS (Saha et al. 2001). GlyRs were visualized with an antibody that recognized all native glycine receptors in rat as it is directed against the α1–4 subunits of glyR (Lynch, 2009). After antigen retrieval procedures, labelling for GABAARs and glyRs (Figs 4 and 5) was present throughout the NTS. At low magnification, latNTS always appeared more densely and strongly labelled than the medNTS (Fig. 4A–B). Immunoreactivity for GABAARs and glyRs appeared as strongly immunoreactive clusters in both latNTS and medNTS (e.g. Fig. 5C and G and Fig. 5K and O); diffuse and weaker labelling was also observed throughout the neuropil of NTS.
Figure 4. Confocal views showing immunofluorescence for the β2/3 subunits of GABAAR, the α subunits of glyR and gephyrin within adult rat NTS.
AP, area postrema; cc, central canal; GN, gracilis nucleus; ts, tractus solitarius; X, dorsal motor nucleus of the vagus; XII, hypoglossal nucleus. Scale bar = 224 μm.
Figure 5. GABAAR, glyR and gephyrin immunoreactivity in inhibitory synapses of rat NTS.
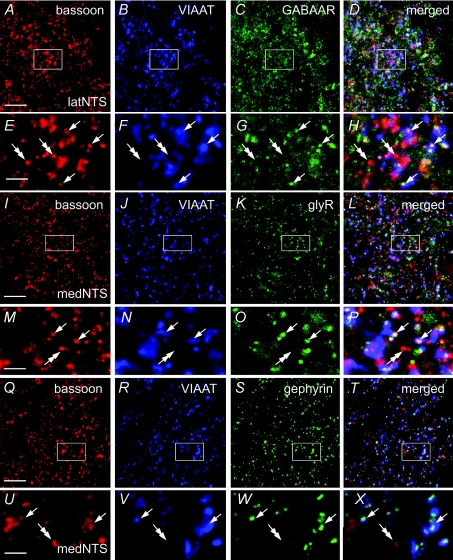
A–X, simultaneous detection of the presynaptic active zones (bassoon, red), inhibitory axon terminals (VIAAT, blue) and GABAAR, glyR or gephyrin (green). Immunoreactivity is visible as numerous fluorescent clusters throughout the NTS. Images in E–H, M–P and U–X represent enlarged views of framed areas in A–D, I–L and Q–T, respectively. Bassoon immunoreactive puncta colocalized with VIAAT labelling (inhibitory synapses, arrows) are associated with GABAAR (E–H), glyR (M–P) or gephyrin (U–X) positive clusters within latNTS and medNTS. Inversely, bassoon immunoreactive puncta that are not colocalized with VIAAT labelling (non-inhibitory synapses, double arrows) are not associated to GABAAR, glyR or gephyrin positive clusters. Scale bars = 11.6 μm for A–D, I–L and Q–T; 2.9 μm for E–H, M–P and U–X.
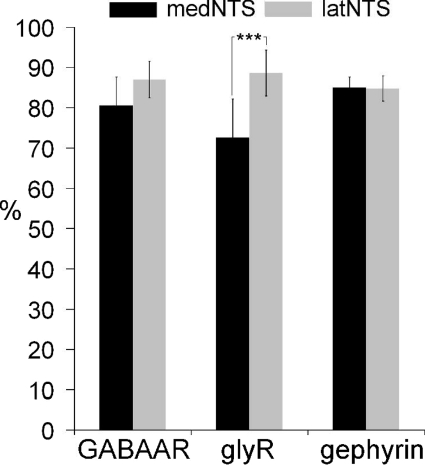
To determine the composition of inhibitory synapses and their distribution within the NTS, we examined the presence of GABAAR and glyR labelling within inhibitory synapses. Inhibitory axon terminals were visualized by co-labelling of VIAAT and synapses were identified using the cytomatrix bassoon as a marker of the presynaptic active zone (e.g. Fig. 5A and B). Axon terminals co-labelled for VIAAT and bassoon were seen to be extensively associated with GABAAR and glyR labelling (Fig. 5A–P). This was confirmed by quantitative analysis performed as described before (Balland et al. 2008; Supplemental Fig. 2). No significant difference between medNTS and latNTS was observed and, on average, 85 ± 3% (mean percentages ±s.d.; n= 6 rats) of VIAAT–bassoon axon terminals were associated with GABAAR labelling (Fig. 6). The percentage of VIAAT–bassoon axon terminals associated to glyR labelling was high and represented in average 83 ± 5% (n= 6 rats) within NTS. Nevertheless, the number of VIAAT–bassoon axon terminals associated to glyR immunoreactivity was slightly, but significantly (P < 0.005), lower in the medNTS (72.5 ± 9.5%, n= 6 rats) compared to latNTS (89 ± 6%, n= 6 rats; Fig. 6). All these results indicated that the vast majority of inhibitory synapses in adult NTS expressed GABAAR or glyR. The remaining VIAAT–bassoon axon terminals not associated to GABAAR or glyR labelling could be either synapses without GABAAR or glyR, or synapses expressing GABAAR or glyR below detection levels.
Figure 6. Distribution of inhibitory synapses expressing GABAAR, glyR and gephyrin in rat NTS.
Percentages of inhibitory synapses containing GABAAR or glyR in medNTS and latNTS. Note that the percentage of glyR containing synapses is significantly lower in medNTS (Mann–Whitney test, P < 0.005).
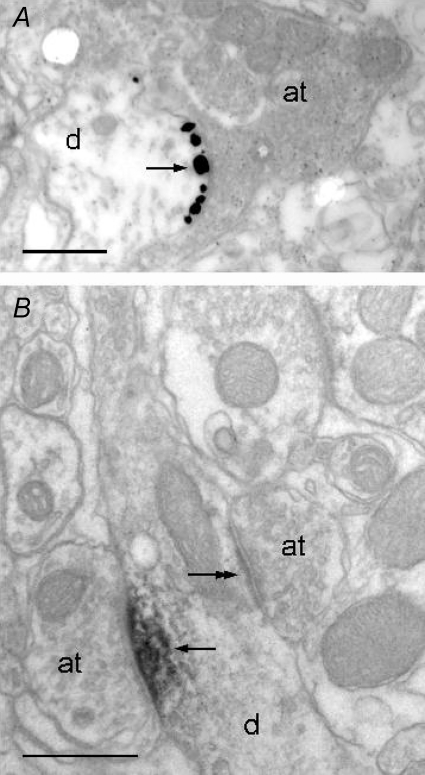
Gephyrin has been shown to aggregate selectively at postsynaptic sites of glycine, GABA and mixed synapses in various structures of the CNS (Fritschy et al. 2008). Gephyrin immunofluorescence was present throughout NTS (Fig. 4C) as strongly immunoreactive clusters, and diffuse labelling within neuropil was low (Fig. 5Q–X). A high proportion of VIAAT–bassoon positive axon terminals was associated with gephyrin immunoreactivity (84.5 ± 3%; mean percentages ±s.d.; n= 6 rats) in both medial and lateral NTS (e.g. Fig. 6D). This indicated that gephyrin positive clusters were associated with synaptic inhibitory terminals. This result was confirmed by electron microscopy showing that gephyrin immunoperoxidase and immunogold were associated to inhibitory symmetrical synapses within NTS (Fig. 7).
Figure 7. Electronic micrographs of gephyrin labelling in NTS after pre-embedding immunogold (A) or immunoperoxidase (B).
Labelling is present at synapses (arrows) between dendrites (d) and axon terminals (at). Symmetrical synapses are labelled (arrows in A), while no labelling is found at asymmetrical synapses (e.g. double arrows in B). Scale bars = 500 nm.
GABAAR and glyR are co-expressed with gephyrin at inhibitory synapses in adult rat NTS
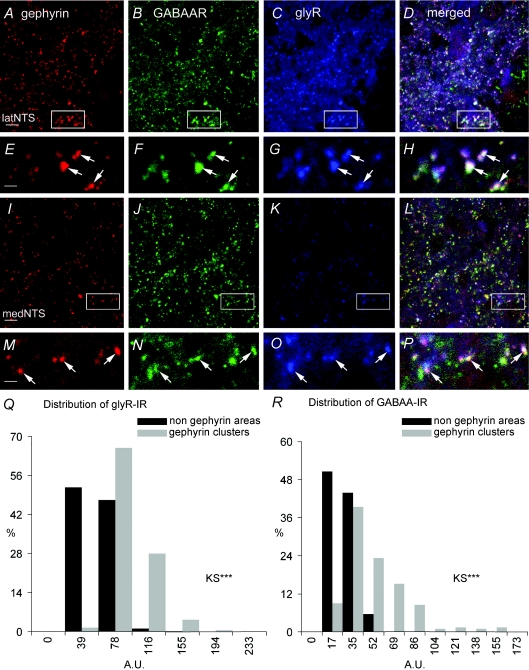
We have demonstrated that GABAAR and glyR are expressed in inhibitory synapses in the NTS. The high percentages of synapses expressing either GABAAR or glyR suggested that both receptors were co-expressed in inhibitory synapses. This was demonstrated by examining the expression of GABAAR and glyR in gephyrin clusters. GABAAR and glyR labelling was co-localized within gephyrin clusters in latNTS (Fig. 8A–H) and medNTS (Fig. 8I–P). This was confirmed by quantitative analysis (Fig. 8Q–R). A first set of values corresponded to Al-488 fluorescence (GABAAR) or Cy5 fluorescence (glyR) measured within 180 nm radius circles centred on gephyrin clusters. A second set of measures corresponded to Al-488 and Cy5 fluorescence measured within 180 nm radius circles randomly chosen in the image, but not overlapping with gephyrin clusters. Histograms representing the distributions of mean fluorescence intensities in gephyrin clusters and non-gephyrin areas were constructed and compared using the Kolmogorov–Smirnov test. Whatever the experiment (n= 7 rats), distributions of GABAAR and glyR fluorescence intensities in gephyrin clusters were broader extending to relatively high values in comparison to the distribution of fluorescence intensities in non-gephyrin areas, which was skewed to weaker values (Fig. 8Q–R). The distributions of GABAAR and glyR fluorescence measured in non gephyrin areas and in gephyrin clusters were significantly different (P < 0.001). We concluded that inhibitory synapses were enriched with both GABAAR and glyR in latNTS and medNTS.
Figure 8. GABAAR and glyR are co-expressed with gephyrin at inhibitory synapses in the NTS.
A–P, immunofluorescence for gephyrin, GABAAR and glyR is colocalised in latNTS (A–D and arrows in enlarged views E–H), and also in medNTS although immunoreactivity for glyR is weaker (I–L and arrows in enlarged views M–P). Q–R, distributions of fluorescence intensities (A.U., arbitrary unit) for glyR immunoreactivity (glyR-IR) and GABAAR immunoreactivity (GABAAR-IR). Fluorescence intensities in gephyrin clusters are significantly different from those in non-gephyrin areas (KS, P < 0.01). Scale bars = 5.8 μm for A–D and I–L; 1.39 μm for E–H and M–P.
To verify that our triple immunolabelling did not result from cross-reactions, we analysed the distribution of the immunofluorescence obtained with a mouse antibody directed to the AMPA receptor gluR2 subunit relative to gephyrin positive clusters, in comparison to the distribution of glyR immunofluorescence (Supplemental Fig. 3A–H). As expected, gluR2 labelling was never associated with gephyrin clusters (Supplemental Fig. 3I–J).
Characterization of inhibitory synaptic transmission in the NTS
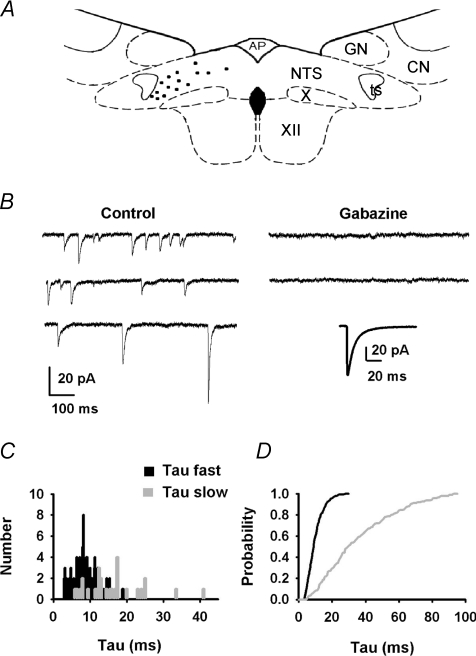
Anatomical results having revealed that the latNTS contained GABA and GABA–glycine axon terminals while the medNTS contained only GABA axon terminals, we then analysed the quantal synaptic activity on brainstem slices. Miniature inhibitory postsynaptic currents (mIPSCs) were recorded in neurons located either in medNTS (n= 15, Fig. 9A) or in latNTS (n= 20, Fig. 10A). In medNTS, neurons presented inward currents occurring at a relatively low frequency (1.2 ± 0.3 Hz, n= 10) that were completely abolished after application of 5 μm gabazine (n= 8, Fig. 9B). mIPSCS analysis indicated that decay time and peak amplitude distribution of individual events were rather broad. Depending on cells, peak amplitude ranges from 5 to 200 pA with a mean amplitude of 68 ± 9 pA (10 neurons). Most mIPSC decay times were best fitted to a single exponential (600 mIPSCs, 7 neurons) and the remaining decay times were fitted to a sum of two exponential functions (221 mIPSCs, 7 neurons). For all mIPSCs, the fastest decays ranged from 3.5 to 30 ms (τfast, Fig. 9C and D; 9.5 ± 0.6 ms) and the slowest, when present, from 5 to 93 ms (τslow, Fig. 9C and D; 30 ± 5 ms). Weighted decay times for average mIPSCs ranged from 6 to 20 ms (mean value: 13 ± 1.4 ms, n= 10). Rise time (10–90%) of averaged mIPSCs was 0.62 ± 0.2 ms (n= 10; 0.5–0.7 ms). Amplitudes of mIPSCs did not correlate with weighted decay times or rise times arguing against dendritic filtering.
Figure 9. Characterization of mIPSCs in medial NTS neurons.
A, schematic drawing of a coronal section of brainstem showing the location of recorded cells in the medNTS (black dots). AP, area postrema; CN, cuneatus nucleus; GN, gracilis nucleus; NTS, nucleus tractus solitarii; ts, tractus solitarius; X, dorsal motor nucleus of the vagus; XII, hypoglossal nucleus. B, in control conditions (bath added 2 mm kynurenate, TTX, holding potential: −70 mV), inward inhibitory current exhibited either mono- or bi-exponential decay. Addition of 5 μm gabazine abolished synaptic activity (same scale as control). Inset: average mIPSC obtained from 50 events. C, distribution of τfast (black) and τslow (grey) for the neuron shown in B (132 mIPSCs). D, normalized cumulative distribution of τfast and τslow for 7 medial NTS neurons (values computed from 821 IPSCs).
Figure 10. Characterization of mIPSCs in lateral NTS neurons.
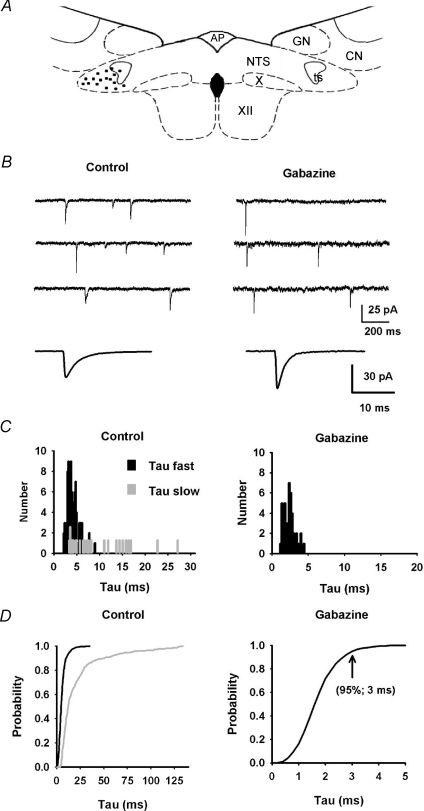
A, schematic drawing of a coronal section of brainstem showing the location of recorded cells in the latNTS (black dots). AP, area postrema; CN, cuneatus nucleus; GN, gracilis nucleus; NTS, nucleus tractus solitarii; ts, tractus solitarius; X, dorsal motor nucleus of the vagus; XII, hypoglossal nucleus. B, in control conditions, inward inhibitory current exhibited either mono- or bi-exponential decay. Bottom trace: average mIPSCs obtained from 150 events. Addition of 5 μm gabazine decreased synaptic activity frequency and revealed fast inward currents with mono-exponential decay. Bottom trace: average mIPSCs obtained from 50 events. C, distribution of τfast (black) and τslow (grey) for the neuron shown in A in control condition (117 mIPSCs) or after addition of gabazine (42 mIPSCs). D, normalized cumulative distribution of τfast and τslow for 8 latNTS neurons (values computed from 1504 mIPSCs) in control conditions and after addition of gabazine (800 mIPSCs). Note that under gabazine, all mIPSC decays were best fitted to a single exponential.
In the latNTS (Fig. 10A), three types of mIPSCs were observed in all neurons according to their decay times: fast decaying, slow decaying and mixed events (Fig. 10B). Thus mIPSCs were fitted either to a single exponential (63 ± 5%, 950 mIPSCs, 8 neurons) or to a sum of two exponential functions (37 ± 5%, 554 mIPSCs, 8 neurons). Unlike mIPSCs recorded in the medNTS, the distribution of the fastest decays (τfast; 4.8 ± 1 ms; range: 0.4 to 35 ms; Fig. 10C) was larger. The slowest decay, when present, ranged between 4 and 120 ms (τslow: 14 ± 5 ms). This result suggested the presence of a subgroup of mIPSCs with faster kinetics than that observed in the medNTS. This was confirmed pharmacologically by addition of gabazine in the saline that halved mIPSC frequency (Fig. 10B; from 2.5 ± 0.6 Hz to 1 ± 0.3 Hz; Mann–Whitney unpaired test, P= 0.001) and revealed a subgroup of fast decaying mIPSCs that were blocked by an additional application of strychnine (4 neurons, not shown). Under gabazine, these glycine-mediated mIPSCs were further characterized. Rise time of averaged glyR-mediated mIPSCs was 0.35 ± 0.01 ms (9 neurons; 0.3–0.45 ms; significantly faster than GABAAR-mediated mIPSCs recorded in medNTS neurons; Mann–Whitney unpaired test, P= 0.0001). They had variable peak amplitudes from 10 to 300 pA (mean value = 60 ± 9 pA). They were all best fitted to a single exponential yielding a very rapid decay time ranging from 0.4 to 4.5 ms (mean = 2.1 ± 0.15 ms; Fig. 10C and D). In additional experiments on three latNTS neurons, addition of stychnine selectively abolished rapid mono-decaying events allowing characterization of pure GABAAR-mediated mIPSCs. Rise time for averaged GABAAR-mediated mIPSCs was 0.6 ± 0.21 ms. As observed for medNTS neurons, most GABAAR-mediated mIPSCs (58%) decay times were best fitted to a single exponential and in the remaining decay times were fitted to a sum of two exponential functions. Whatever the case, the fastest exponential ranged from 3.5 to 25 ms. Weighted decay times for average mIPSCs ranges from 5 to 15 ms (11.5 ± 2 ms; not significantly different from values obtained in medNTS neurons).
These data indicated that in medNTS inhibitory synaptic events were exclusively mediated by GABAAR activation. In contrast, in latNTS while most mIPSCs appeared to be due to the release of GABA (the slowest ones) or glycine (the fastest ones), our data suggested that some mIPSCs (dual mIPSCs) were due to the co-release of GABA and glycine from single vesicles. The low frequency of mIPSCs ruled out the possibility that dual mIPSCs could have arisen from stochastic superimposition of glycine and GABA mediated events.
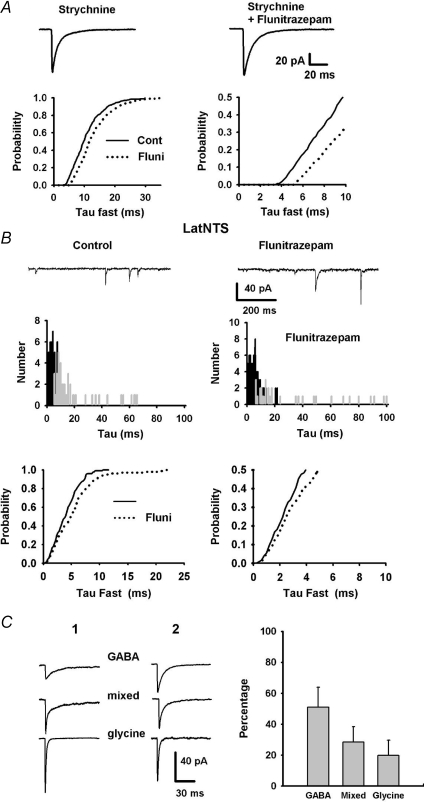
To further explore this question, we added Flunitrazepam (3 μm) in the perfusion solution in order to better discriminate mIPSC kinetics between glycine, GABA and dual mIPSCs (Russier et al. 2002). To characterize the effect of Flunitrazepam, pure GABAAR-mediated mIPSCs were isolated by addition of strychnine (5 medNTS neurons and 3 latNTS neurons, Fig. 11A). In all neurons, addition of Flunitrazepam induced an increase in decay time constant. Weighted decay times for average mIPSCs increased from 12.5 ± 1.1 ms to 16.3 ± 1.5 (Wilcoxon paired test, P < 0.01; 8 neurons) whereas amplitudes remained unchanged (62 ± 9 pA vs. 68 ± 9.5 pA). Decay time distribution histograms indicate a rightward shift for exponential time constants when compared to control conditions (Fig. 11A, bottom; Kolmogorov–Smirnov test, P < 0.01). In the presence of Flunitrazepam, 92% of GABA events had a decay time constant slower than 6 ms.
Figure 11. Evidence for co-release of GABA and glycine in NTS neurons.
A, addition of Flunitrazepam into the saline increased GABA averaged mIPSCs duration as seen by a prolonged decay times (upper traces). Normalized cumulative distribution of τfast for isolated GABA events (TTX and strychnine) before (plain lines) and after addition of Flunitrazepam (dashed lines). Note the rightward shift of the distributions after Flunitrazepam addition (right, expanded axes for clarity). B, addition of Flunitrazepam into the saline increased mIPSC duration in latNTS neurons (upper traces). Distribution of τfast (black) and τslow (grey) for the same neuron in control condition or after addition of Flunitrazepam (middle panel). Normalized cumulative distribution of τfast the same neuron before (plain lines) and after addition of Flunitrazepam (dashed lines). Note that the fastest decays (<3 ms, right, expanded axes) were not affected by Flunitrazepam (bottom panel). C, left, examples of averaged mIPSCs for two different latNTS neurons (1, 2) obtained from mIPSCs separated according to the fitting procedure. C, right, bar graph of the relative proportion of the GABA-, mixed and glyR-mediated mIPSCs estimated in 5 latNTS neurons. Error bars show s.e.m.
On latNTS neurons (Fig. 11B, top), Flunitrazepam also induced an increase of the decay time of averaged mIPSCs. This increase resulted from an enlargement of τfast distribution and a rightward shift of τslow distribution (Fig. 11B, middle). Unlike what we observed for pure GABAAR-mediated mIPSCs, the fastest decay times remained unaffected by Flunitrazepam indicating that they reflected glycine-mediated events (Fig. 11B, bottom). In the presence of gabazine and Flunitrazepam, glycine events were all best fitted to a single exponential yielding to a very rapid decay time constant (mean value 2.2 ± 0.1 ms; 6 neurons). In these conditions, 98% of glycine events had a decay time constant faster than 3.5 ms (92% faster than 3 ms).
We therefore reasoned that mIPSCs with single exponential decay <3.5 ms were pure glycinergic events and that mIPSCs with a fastest decay >6 ms were pure GABA events. In doing so, we hence supposed that bi-exponential mIPSCs with a fast decay <3.5 ms represented dual synaptic events. Based on these criteria, we estimated the relative proportion of glycine, GABA and dual events on five latNTS neurons (Fig. 11C). Pure GABAAR-mediated mIPSCs represented 51% of the total synaptic activity (range 20–68%), pure glyR-mediated mIPSCs amounted to 20% (5–58%) and dual synaptic events represented 29% (11–68%; Fig. 11C). For each subgroups, peak amplitudes of individual mIPSCS did not correlate with weighted decay times arguing against dendritic filtering. Averaged peak amplitudes of GABA, glycine and mixed mIPSCs were not significantly different (in pA: 80 ± 22, 125 ± 20 and 87 ± 11, respectively). In mixed mIPSCs, the relative contribution of the GABA component was very variable (range 12–90%) and was an average of 47 ± 1.5% (185 mIPSCs). Averaged decay time comparison revealed that τ for glyR-mediated mIPSCs were not different to τfast of mixed mIPSCs (2.4 ± 0.23 ms vs. 2.3 ± 0.19 ms) and τ for GABAAR-mediated mIPSCs were similar to τslow of mixed mIPSCS (12 ± 2.5 ms vs. 17 ± 4 ms).
Discussion
This study demonstrates that synaptic inhibition is mediated in the adult NTS by both GABA and glycine but with a striking anatomical segregation. While GABA axon terminals are present throughout the NTS, GABA–glycine axon terminals are strictly located in the latNTS. Both GABAAR and glyR are clustered in nearly all inhibitory synapses, suggesting that inhibition is governed by the characteristics of presynaptic axon terminals. Electrophysiological experiments confirm the predominance of GABA inhibition and demonstrate the existence of co-release of GABA and glycine in all neurons of the latNTS.
Distribution of GABA and glycine synapses delineates a specific topography in the NTS
Throughout the NTS, most inhibitory synapses possess the molecular machinery (presynaptic transporters, synthesis enzyme and postsynaptic receptors) for GABA inhibition. As expected, GABAAR-mediated mIPSCs are recorded in NTS neurons whatever their location. This is in agreement with previous studies mainly focused on the medial NTS (Kasparov et al. 2001; Edwards et al. 2007). In contrast glyT2, the neuronal glycine transporter, is strictly located in the latNTS. GlyT2 is almost exclusively co-localized with GAD65/67 and this co-expression amounted for about one-third of the whole inhibitory terminals identified by VIAAT expression. Thus, glycine is released only from mixed GABA–glycine axon terminals whereas GABA is released either by pure GABA axon terminals or by mixed GABA–glycine axon terminals. Likewise, mIPSCs are mediated either by the release of GABA or glycine but in about one-third of synaptic events the synaptic currents are mediated by the co-release of GABA and glycine. Mixed synaptic events indicate that within GABA–glycine terminals, single synaptic vesicles are filled both with GABA and glycine. According to the large variation of GABA and glycine mediated currents in mixed mIPSCs and the presence of virtually pure glycine events, the concentrations of GABA and glycine greatly differ from one synaptic vesicle to another. Co-release of GABA and glycine has already been reported in different structures during development or before weaning (Jonas et al. 1998; Inquimbert et al. 2007). Other studies have reported that GABA inhibition or glycine inhibition becomes predominant after the second postnatal week (Kotak et al. 1998; Gao et al. 2001; Baccei & Fitzgerald, 2004). Interestingly, co-release of GABA and glycine still occurs in the latNTS of post-weaning rats. The proportion of GABA (51%), glycine (21%) or mixed synaptic events (29%) is variable from neuron to neuron but fits well to the anatomical quantification suggesting that the release probability of axon terminals is homogeneous. Pure glycine mIPSCs may reflect release of glycine-filled vesicles by a subset of pure glycinergic axon terminals as reported in the spinal cord and in some motor nuclei (Singer et al. 1998; Inquimbert et al. 2007). However, the weak proportion of glycinergic axon terminals in the latNTS (4%) suggests that most of the ‘pure’ glycine events may be due to the release of vesicles containing glycine and no or very little GABA by GABA-glycine axon terminals.
While synaptic inhibition is exclusively mediated by GABA in the medNTS, we show that glyR co-localized with GABAAR in the vast majority of inhibitory synapses. Inhibitory responses are observed after exogenous glycine application within medNTS suggesting that these glyRs are functional (Bennett et al. 1987; Feldman & Felder, 1991). However, the absence of glyT2 at fibre terminals in the medNTS certainly precludes the recycling and filling of synaptic vesicles with glycine in medNTS terminals (Gomeza et al. 2003; Aubrey et al. 2007; Rousseau et al. 2008). Whether these glycine receptors are activated by other endogenous agonists such as taurine (Hussy et al. 1997) that could be released in pathological conditions (Hehre et al. 2008) remains to be determined. In sum, these data suggest that inhibition is governed by the characteristics of presynaptic terminals.
Although our results show that GABA is released independently of glycine in the latNTS, co-release of GABA and glycine occurs in at least one-third of the synaptic events. As discussed by Russier et al. (2002), this would add two levels of functional complementarity. First, neuronal firing activity would be more efficiently inhibited during co-release. This may not be due to the summation of GABAAR and glyR activation since modelling rather predicts a sublinear summation (Russier et al. 2002). Accordingly the peak amplitude of NTS mixed mIPSCs is not significantly larger than that of the sum of pure GABA or glycine synaptic events. However, in mixed events the rapid increase in membrane conductance provided by the fast activation of glyR would ensure a rapid cessation of firing subsequently prolonged by the slower activation of GABAAR (Russier et al. 2002). Second, we show that isolated GABA and glyR-mediated mIPSCs have very different kinetics. Glycine events have faster rise and decay times than GABAAR-mediated mIPSCs (0.35 ms vs. 0.6 ms and 2 ms vs. 13 ms, respectively). Therefore, the glycine synaptic events would allow a millisecond-scale inhibition whereas GABAAR activation would induce a sustained inhibition lasting up to several tens of milliseconds. The latter would be particularly efficient in de-inactivating voltage-dependent conductances described in NTS neurons, such as the transient potassium current or the low-voltage activated calcium current (Dekin & Getting, 1987; Tell & Bradley, 1994; Vincent & Tell, 1997). Whether co-release of GABA and glycine is a phenomenon subject to dynamic regulation during short- or long-term synaptic plasticity or pathophysiological conditions requires further investigation. The mixed terminals may originate from local inhibitory interneurons. Glycinergic neurons have been detected in the NTS (Zafra et al. 1995; Rampon et al. 1996; Chan & Sawchenko, 1998; Saha et al. 1999; Zeilhofer et al. 2005) and respiratory pump cells located in the latNTS co-express GAD65/67 and glyT2 (Ezure & Tanaka, 2004). Since visceral afferent fibres form mono-synaptic connections on most GABA NTS neurons (Bailey et al. 2008), mixed GABA–glycine inhibition would participate at the very earliest stage in the integrative processing of visceral afferent information within the NTS.
Functional considerations
From a functional point of view, the striking segregation of GABA–glycine inhibition in the latNTS raises the question of the relevance of having a dual inhibition mechanism for visceral information processing.
The NTS serves as the primary sensory recipient for autonomic inputs from various cervical, thoracic and subdiaphragmatic organs. Visceral afferent terminals are distributed in the NTS with a loose viscerotopy so that afferent fibres related to a given visceral organ (e.g. heart, lung and gastrointestinal organs) preferentially segregate in NTS subnuclei (Blessing, 1997). Thus, NTS subnuclei surrounding the tractus solitarius (corresponding in our study to the latNTS) mainly receive afferent fibres from cervical and thoracic organs (Hayakawa et al. 2001; Ezure et al. 2002; Kubin et al. 2006; Corbett et al. 2007). Afferent fibres originating from the digestive tract preferentially terminate within NTS subnuclei corresponding to our localization of medNTS (Blessing, 1997). Likewise NTS neurons partly segregate in latNTS and in medNTS according to their efferent projections. For example, neurons projecting to the caudal ventrolateral medulla are preferentially located in latNTS (Weston et al. 2003; Hermes et al. 2006) while neurons projecting to the hypothalamus or the parabrachial nucleus are largely restricted to medNTS (Bailey et al. 2006; Hermes et al. 2006). The medNTS neurons projecting to hypothalamus and parabrachial nucleus are involved in broader regulation such as regulation of the hormonal component of autonomic responses (Rinaman, 2007) or emotional awareness (Craig, 2002; Critchley, 2005). Our data suggest that processing of visceral information to anterior brain nuclei does not require the use of a dual inhibition.
In contrast, the descending pathway to the caudal ventrolateral medulla subserves specific cardiovascular or respiratory reflexes (Pilowsky & Goodchild, 2002; Dampney et al. 2003; Kubin et al. 2006). Blockade of GABAAR or glyR within the NTS increases arterial pressure and heart rate (Kubo & Kihara, 1987). Respiratory NTS neurons receive a double inhibition mediated by GABAAR or glyR depending on the respiratory phase (Schmid et al. 1996; Ezure et al. 1999, 2002). Since our data indicate that all or nearly all inhibitory synapses within the latNTS would support GABA–glycine co-release, dual inhibition observed in respiratory neurons may reflect a differential regulation of glycine to GABA release by the same terminals during the breathing cycle. Moreover, regarding the functional relevance of our study for respiration, an interesting outcome of our study is that neurons located in the latNTS would always receive a GABA–glycine mixed inhibition, which may be especially important for the fast resetting of the neuronal activity that occurs in some oro-facial and respiratory reflexes (Dutschmann & Paton, 2002). In conclusion, GABA–glycine co-release in latNTS neurons would ensure fast and reliable inhibition of neuronal firing activity as well as a mechanism to improve computational neuron capability during vital reflexes.
Acknowledgments
This work was supported by grants from the Centre National de la Recherche Scientifique and by the Aix-Marseille II and III universities. A.D. was a recipient of fellowship awarded by the French government (MNERT).
Author contributions
A.B. initiated and directed the study; A.D., F.T., J.-P. K. and A.B. performed the research; A.D., F.T., J.-P. K. and A.B. analysed the data; F.T. and A.B. wrote the manuscript. All authors approved the manuscript.
Supplemental material
Supplemental material 1
Supplemental material 2
Supplemental material 3
As a service to our authors and readers, this journal provides supporting information supplied by the authors. Such materials are peer-reviewed and may be re-organized for online delivery, but are not copy-edited or typeset. Technical support issues arising from supporting information (other than missing files) should be addressed to the authors
References
- Andresen MC, Mendelowitz D. Sensory afferent neurotransmission in caudal nucleus tractus solitarius: common denominators. Chem Senses. 1996;21:387–395. doi: 10.1093/chemse/21.3.387. [DOI] [PubMed] [Google Scholar]
- Aubrey KR, Rossi FM, Ruivo R, Alboni S, Bellenchi GC, Le Goff A, Gasnier B, Supplisson S. The Transporters GlyT2 and VIAAT cooperate to determine the vesicular glycinergic phenotype. J Neurosci. 2007;27:6273–6281. doi: 10.1523/JNEUROSCI.1024-07.2007. [DOI] [PMC free article] [PubMed] [Google Scholar]
- Baccei ML, Fitzgerald M. Development of GABAergic and glycinergic transmission in the neonatal rat dorsal horn. J Neurosci. 2004;24:4749–4757. doi: 10.1523/JNEUROSCI.5211-03.2004. [DOI] [PMC free article] [PubMed] [Google Scholar]
- Bailey TW, Appleyard SM, Jin Y-H, Andresen MC. Organization and properties of GABAergic neurons in solitary tract nucleus (NTS) J Neurophysiol. 2008;99:1712–1722. doi: 10.1152/jn.00038.2008. [DOI] [PubMed] [Google Scholar]
- Bailey TW, Hermes SM, Andresen MC, Aicher SA. Cranial visceral afferent pathways through the nucleus of the solitary tract to caudal ventrolateral medulla or paraventricular hypothalamus: target-specific synaptic reliability and convergence patterns. J Neurosci. 2006;26:11893–11902. doi: 10.1523/JNEUROSCI.2044-06.2006. [DOI] [PMC free article] [PubMed] [Google Scholar]
- Balland B, Lachamp P, Strube C, Kessler JP, Tell F. Glutamatergic synapses in the rat nucleus tractus solitarii develop by direct insertion of calcium-impermeable AMPA receptors and without activation of NMDA receptors. J Physiol. 2006;574:245–261. doi: 10.1113/jphysiol.2006.108738. [DOI] [PMC free article] [PubMed] [Google Scholar]
- Balland B, Lachamp P, Kessler J-P, Tell F. Silent synapses in developing rat nucleus tractus solitarii have AMPA receptors. J Neurosci. 2008;28:4624–4634. doi: 10.1523/JNEUROSCI.5355-07.2008. [DOI] [PMC free article] [PubMed] [Google Scholar]
- Bennett JA, McWilliam PN, Shepheard SL. A γ-aminobutyric-acid-mediated inhibition of neurones in the nucleus tractus solitarius of the cat. J Physiol. 1987;392:417–430. doi: 10.1113/jphysiol.1987.sp016788. [DOI] [PMC free article] [PubMed] [Google Scholar]
- Blessing WW. The Lower Brainstem and Bodily Homeostasis. New York: Oxford University Press; 1997. Anatomy of the lower brainstem; pp. 29–99. [Google Scholar]
- Bonham AC. Neurotransmitters in the CNS control of breathing. Respir Physiol. 1995;101:219–230. doi: 10.1016/0034-5687(95)00045-f. [DOI] [PubMed] [Google Scholar]
- Bonham AC, Chen CY, Sekizawa S, Joad JP. Plasticity in the nucleus tractus solitarius and its influence on lung and airway reflexes. J Appl Physiol. 2006;101:322–327. doi: 10.1152/japplphysiol.00143.2006. [DOI] [PubMed] [Google Scholar]
- Butcher WJ, Kasparov S, Paton FJ. Differential effects of apamin on neuronal excitability in the nucleus tractus solitarii of rats studied in vitro. J Auton Nerv Syst. 1999;77:90–97. [PubMed] [Google Scholar]
- Cassell MD, Roberts L, Talman WT. Glycine-containing terminals in the rat dorsal vagal complex. Neuroscience. 1992;50:907–920. doi: 10.1016/0306-4522(92)90214-m. [DOI] [PubMed] [Google Scholar]
- Chan R, Sawchenko P. Organization and transmitter specificity of medullary neurons activated by sustained hypertension: Implications for understanding baroreceptor reflex circuitry. J Neurosci. 1998;18:371–387. doi: 10.1523/JNEUROSCI.18-01-00371.1998. [DOI] [PMC free article] [PubMed] [Google Scholar]
- Corbett EK, Mary DA, McWilliam PN, Batten TF. Age-related loss of cardiac vagal preganglionic neurones in spontaneously hypertensive rats. Exp Physiol. 2007;92:1005–1013. doi: 10.1113/expphysiol.2007.038216. [DOI] [PubMed] [Google Scholar]
- Craig AD. How do you feel? Interoception: the sense of the physiological condition of the body. Nat Rev Neurosci. 2002;3:655–666. doi: 10.1038/nrn894. [DOI] [PubMed] [Google Scholar]
- Critchley HD. Neural mechanisms of autonomic, affective, and cognitive integration. J Comp Neurol. 2005;493:154–166. doi: 10.1002/cne.20749. [DOI] [PubMed] [Google Scholar]
- Dampney RAL, Polson JW, Potts PD, Hirooka Y, Horiuchi J. Functional organization of brain pathways subserving the baroreceptor reflex: studies in conscious animals using immediate early gene expression. Cell Mol Neurobiol. 2003;23:597–616. doi: 10.1023/A:1025080314925. [DOI] [PMC free article] [PubMed] [Google Scholar]
- Dekin MS, Getting PA. In vitro characterization of neurons in the ventral part of the nucleus tractus solitarius. II. Ionic basis for repetitive firing patterns. J Neurophysiol. 1987;58:215–229. doi: 10.1152/jn.1987.58.1.215. [DOI] [PubMed] [Google Scholar]
- Dumoulin A, Rostaing P, Bedet C, Levi S, Isambert MF, Henry JP, Triller A, Gasnier B. Presence of the vesicular inhibitory amino acid transporter in GABAergic and glycinergic synaptic terminal boutons. J Cell Sci. 1999;112:811–823. doi: 10.1242/jcs.112.6.811. [DOI] [PubMed] [Google Scholar]
- Dutschmann M, Paton JF. Inhibitory synaptic mechanisms regulating upper airway patency. Respir Physiol Neurobiol. 2002;131:57–63. doi: 10.1016/s1569-9048(02)00037-x. [DOI] [PubMed] [Google Scholar]
- Edwards IJ, Dallas ML, Poole SL, Milligan CJ, Yanagawa Y, Szabo G, Erdelyi F, Deuchars SA, Deuchars J. The neurochemically diverse intermedius nucleus of the medulla as a source of excitatory and inhibitory synaptic input to the nucleus tractus solitarii. J Neurosci. 2007;27:8324–8333. doi: 10.1523/JNEUROSCI.0638-07.2007. [DOI] [PMC free article] [PubMed] [Google Scholar]
- Esclapez M, Tillakaratne NJ, Kaufman DL, Tobin AJ, Houser CR. Comparative localization of two forms of glutamic acid decarboxylase and their mRNAs in rat brain supports the concept of functional differences between the forms. J Neurosci. 1994;14:1834–1855. doi: 10.1523/JNEUROSCI.14-03-01834.1994. [DOI] [PMC free article] [PubMed] [Google Scholar]
- Ezure K, Tanaka I, Miyazaki M. Electrophysiological and pharmacological analysis of synaptic inputs to pulmonary rapidly adapting receptor relay neurons in the rat. Exp Brain Res. 1999;128:471–480. doi: 10.1007/s002210050870. [DOI] [PubMed] [Google Scholar]
- Ezure K, Tanaka I. GABA, in some cases together with glycine, is used as the inhibitory transmitter by pump cells in the Hering-Breuer reflex pathway of the rat. Neuroscience. 2004;127:409–417. doi: 10.1016/j.neuroscience.2004.05.032. [DOI] [PubMed] [Google Scholar]
- Ezure K, Tanaka I, Saito Y, Otake K. Axonal projections of pulmonary slowly adapting receptor relay neurons in the rat. J Comp Neurol. 2002;446:81–94. doi: 10.1002/cne.10185. [DOI] [PubMed] [Google Scholar]
- Feldman PD, Felder RB. Effects of γ-aminobutyric acid and glycine on synaptic excitability of neurones in the solitary tract nucleus. Neuropharmacology. 1991;30:255–236. doi: 10.1016/0028-3908(91)90149-6. [DOI] [PubMed] [Google Scholar]
- Fortin G, Champagnat J. Spontaneous synaptic activities in rat nucleus tractus solitarius neurons in vitro: evidence for re-excitatory processing. Brain Res. 1993;630:125–135. doi: 10.1016/0006-8993(93)90650-c. [DOI] [PubMed] [Google Scholar]
- Fritschy JM, Harvey RJ, Schwarz G. Gephyrin: where do we stand, where do we go? Trends Neurosci. 2008;31:257–264. doi: 10.1016/j.tins.2008.02.006. [DOI] [PubMed] [Google Scholar]
- Fritschy JM, Weinmann O, Wenzel A, Benke D. Synapse-specific localization of NMDA and GABAA receptor subunits revealed by antigen-retrieval immunohistochemistry. J Comp Neurol. 1998;390:194–210. [PubMed] [Google Scholar]
- Fukuda T, Heizmann CW, Kosaka T. Quantitative analysis of GAD65 and GAD67 immunoreactivities in somata of GABAergic neurons in the mouse hippocampus proper (CA1 and CA3 regions), with special reference to parvalbumin-containing neurons. Brain Res. 1997;764:237–243. doi: 10.1016/s0006-8993(97)00683-5. [DOI] [PubMed] [Google Scholar]
- Gao B-X, Stricker C, Ziskind-Conhaim L. Transition from GABAergic to glycinergic synaptic transmission in newly formed spinal networks. J Neurophysiol. 2001;86:492–502. doi: 10.1152/jn.2001.86.1.492. [DOI] [PubMed] [Google Scholar]
- Gomeza J, Ohno K, Hulsmann S, Armsen W, Eulenburg V, Richter DW, Laube B, Betz H. Deletion of the mouse glycine transporter 2 results in a hyperekplexia phenotype and postnatal lethality. Neuron. 2003;40:797–806. doi: 10.1016/s0896-6273(03)00673-1. [DOI] [PubMed] [Google Scholar]
- Hayakawa T, Takanaga A, Maeda S, Seki M, Yajima Y. Subnuclear distribution of afferents from the oral, pharyngeal and laryngeal regions in the nucleus tractus solitarii of the rat: a study using transganglionic transport of cholera toxin. Neurosci Res. 2001;39:221–232. doi: 10.1016/s0168-0102(00)00218-2. [DOI] [PubMed] [Google Scholar]
- Hermes SM, Mitchell JL, Aicher SA. Most neurons in the nucleus tractus solitarii do not send collateral projections to multiple autonomic targets in the rat brain. Exp Neurol. 2006;198:539–551. doi: 10.1016/j.expneurol.2005.12.028. [DOI] [PubMed] [Google Scholar]
- Hehre DA, Devia CJ, Bancalari E, Suguihara C. Brainstem amino acid neurotransmitters and ventilatory response to hypoxia in piglets. Pediatr Res. 2008;63:46–50. doi: 10.1203/PDR.0b013e31815b4421. [DOI] [PubMed] [Google Scholar]
- Hussy N, Deleuze C, Pantaloni A, Desarménien MG, Moos F. Agonist action of taurine on glycine receptors in rat supraoptic magnocellular neurones: possible role in osmoregulation. J Physiol. 1997;502:609–621. doi: 10.1111/j.1469-7793.1997.609bj.x. [DOI] [PMC free article] [PubMed] [Google Scholar]
- Inquimbert P, Rodeau J-L, Schlichter R. Differential contribution of GABAergic and glycinergic components to inhibitory synaptic transmission in lamina II and laminae III–IV of the young rat spinal cord. Eur J Neurosci. 2007;26:2940–2949. doi: 10.1111/j.1460-9568.2007.05919.x. [DOI] [PubMed] [Google Scholar]
- Jonas P, Bischofberger J, Sandkuhler J. Corelease of two fast neurotransmitters at a central synapse. Science. 1998;281:419–424. doi: 10.1126/science.281.5375.419. [DOI] [PubMed] [Google Scholar]
- Jordan D, Mifflin SW, Spyer KM. Hypothalamic inhibition of neurones in the nucleus tractus solitarius of the cat is GABA mediated. J Physiol. 1988;399:389–404. doi: 10.1113/jphysiol.1988.sp017087. [DOI] [PMC free article] [PubMed] [Google Scholar]
- Kasparov S, Davies KA, Patel UA, Boscan P, Garret M, Paton JF. GABAA receptor epsilon-subunit may confer benzodiazepine insensitivity to the caudal aspect of the nucleus tractus solitarii of the rat. J Physiol. 2001;536:785–796. doi: 10.1111/j.1469-7793.2001.00785.x. [DOI] [PMC free article] [PubMed] [Google Scholar]
- Kotak VC, Korada S, Schwartz IR, Sanes DH. A developmental shift from GABAergic to glycinergic transmission in the central auditory system. J Neurosci. 1998;18:4646–4655. doi: 10.1523/JNEUROSCI.18-12-04646.1998. [DOI] [PMC free article] [PubMed] [Google Scholar]
- Kubin L, Alheid GF, Zuperku EJ, McCrimmon DR. Central pathways of pulmonary and lower airway vagal afferents. J Appl Physiol. 2006;101:618–627. doi: 10.1152/japplphysiol.00252.2006. [DOI] [PMC free article] [PubMed] [Google Scholar]
- Kubo T, Kihara M. Evidence for the presence of GABAergic and glycine-like systems responsible for cardiovascular control in the nucleus tractus solitarii of the rat. Neurosci Lett. 1987;74:331–336. doi: 10.1016/0304-3940(87)90319-3. [DOI] [PubMed] [Google Scholar]
- Lachamp P, Balland B, Tell F, Crest M, Kessler JP. Synaptic localization of the glutamate receptor subunit GluR2 in the rat nucleus tractus solitarii. Eur J Neurosci. 2003;17:892–896. doi: 10.1046/j.1460-9568.2003.02494.x. [DOI] [PubMed] [Google Scholar]
- Lachamp P, Balland B, Tell F, Baude A, Strube C, Crest M, Kessler JP. Early expression of AMPA receptors and lack of NMDA receptors in developing rat climbing fibre synapses. J Physiol. 2005;564:751–763. doi: 10.1113/jphysiol.2005.084517. [DOI] [PMC free article] [PubMed] [Google Scholar]
- Li D-P, Yang Q. Membrane and synaptic properties of nucleus tractus solitarius neurons projecting to the caudal ventrolateral medulla. Auton Neurosci. 2007;136:69–81. doi: 10.1016/j.autneu.2007.04.006. [DOI] [PubMed] [Google Scholar]
- Lynch JW. Native glycine receptor subtypes and their physiological roles. Neuropharmacology. 2009;56:303–309. doi: 10.1016/j.neuropharm.2008.07.034. [DOI] [PubMed] [Google Scholar]
- McDougall SJ, Bailey TW, Mendelowitz D, Andresen MC. Propofol enhances both tonic and phasic inhibitory currents in second-order neurons of the solitary tract nucleus (NTS) Neuropharmacology. 2008;54:552–563. doi: 10.1016/j.neuropharm.2007.11.001. [DOI] [PMC free article] [PubMed] [Google Scholar]
- McIntire SL, Reimer RJ, Schuske K, Edwards RH, Jorgensen EM. Identification and characterization of the vesicular GABA transporter. Nature. 1997;389:870–876. doi: 10.1038/39908. [DOI] [PubMed] [Google Scholar]
- Olsen RW, Sieghart W. GABAA receptors: Subtypes provide diversity of function and pharmacology. Neuropharmacology. 2009;56:141–148. doi: 10.1016/j.neuropharm.2008.07.045. [DOI] [PMC free article] [PubMed] [Google Scholar]
- Pfeiffer F, Simler R, Grenningloh G, Betz H. Monoclonal antibodies and peptide mapping reveal structural similarities between the subunits of the glycine receptor of rat spinal cord. Proc Natl Acad Sci U S A. 1984;81:7224–7227. doi: 10.1073/pnas.81.22.7224. [DOI] [PMC free article] [PubMed] [Google Scholar]
- Pilowsky PM, Goodchild AK. Baroreceptor reflex pathways and neurotransmitters: 10 years on. J Hypertens. 2002;20:1675–1688. doi: 10.1097/00004872-200209000-00002. [DOI] [PubMed] [Google Scholar]
- Pimentel FF, Bonagamba LGH, Machado BH. Pressor response to chemoreflex activation before and after microinjection of glycine into the NTS of awake rats. Am J Physiol Regul Integr Comp Physiol. 2003;284:R1000–1009. doi: 10.1152/ajpregu.00310.2002. [DOI] [PubMed] [Google Scholar]
- Potts JT. Neural circuits controlling cardiorespiratory responses: baroreceptor and somatic afferents in the nucleus tractus solitarius. Clin Exp Pharmacol Physiol. 2002;29:103–111. doi: 10.1046/j.1440-1681.2002.03613.x. [DOI] [PubMed] [Google Scholar]
- Potts JT. Inhibitory neurotransmission in the nucleus tractus solitarii: implications for baroreflex resetting during exercise. Exp Physiol. 2006;91:59–72. doi: 10.1113/expphysiol.2005.032227. [DOI] [PubMed] [Google Scholar]
- Rampon C, Luppi PH, Fort P, Peyron C, Jouvet M. Distribution of glycine-immunoreactive cell bodies and fibres in the rat brain. Neuroscience. 1996;75:737–755. doi: 10.1016/0306-4522(96)00278-3. [DOI] [PubMed] [Google Scholar]
- Rinaman L. Visceral sensory inputs to the endocrine hypothalamus. Front Neuroendocrinol. 2007;28:50–60. doi: 10.1016/j.yfrne.2007.02.002. [DOI] [PMC free article] [PubMed] [Google Scholar]
- Rousseau F, Aubrey KR, Supplisson S. The glycine transporter glyT2 controls the dynamics of synaptic vesicle refilling in inhibitory spinal cord neurons. J Neurosci. 2008;28:9755–9768. doi: 10.1523/JNEUROSCI.0509-08.2008. [DOI] [PMC free article] [PubMed] [Google Scholar]
- Russier M, Kopysova IL, Ankri N, Ferrand N, Debanne D. GABA and glycine co-release optimizes functional inhibition in rat brainstem motoneurons in vitro. J Physiol. 2002;541:123–137. doi: 10.1113/jphysiol.2001.016063. [DOI] [PMC free article] [PubMed] [Google Scholar]
- Sabbatini M, Molinari C, Grossini E, Piffanelli V, Mary DASG, Vacca G, Cannas M. GABAA receptors expression pattern in rat brain following low pressure distension of the stomach. Neuroscience. 2008;152:449–458. doi: 10.1016/j.neuroscience.2008.01.008. [DOI] [PubMed] [Google Scholar]
- Sagné C, El Mestikawy S, Isambert M-F, Hamon M, Henry J-P, Giros B, Gasnier B. Cloning of a functional vesicular GABA and glycine transporter by screening of genome databases. FEBS Lett. 1997;417:177–183. doi: 10.1016/s0014-5793(97)01279-9. [DOI] [PubMed] [Google Scholar]
- Saha S, Batten TF, McWilliam PN. Glycine-immunoreactive synaptic terminals in the nucleus tractus solitarii of the cat: ultrastructure and relationship to GABA-immunoreactive terminals. Synapse. 1999;33:192–206. doi: 10.1002/(SICI)1098-2396(19990901)33:3<192::AID-SYN4>3.0.CO;2-K. [DOI] [PubMed] [Google Scholar]
- Saha S, Batten TFC, Mcwilliam PN. Glutamate, gamma-aminobutyric acid and tachykinin-immunoreactive synapses in the cat nucleus tractus solitarii. J Neurocytol. 1995;24:55–74. doi: 10.1007/BF01370160. [DOI] [PubMed] [Google Scholar]
- Saha S, Sieghart W, Fritschy JM, McWilliam PN, Batten TF. γ-Aminobutyric acid receptor (GABAA) subunits in rat nucleus tractus solitarii (NTS) revealed by polymerase chain reaction (PCR) and immunohistochemistry. Mol Cell Neurosci. 2001;17:241–257. doi: 10.1006/mcne.2000.0919. [DOI] [PubMed] [Google Scholar]
- Schmid K, Foutz AS, Denavit-Saubie M. Inhibitions mediated by glycine and GABAA receptors shape the discharge pattern of bulbar respiratory neurons. Brain Res. 1996;710:150–160. doi: 10.1016/0006-8993(95)01380-6. [DOI] [PubMed] [Google Scholar]
- Singer JH, Talley EM, Bayliss DA, Berger AJ. Development of glycinergic synaptic transmission to rat brain stem motoneurons. J Neurophysiol. 1998;80:2608–2620. doi: 10.1152/jn.1998.80.5.2608. [DOI] [PubMed] [Google Scholar]
- Tabata M, Kurosawa H, Kikuchi Y, Hida W, Ogawa H, Okabe S, Tun Y, Hattori T, Shirato K. Role of GABA within the nucleus tractus solitarii in the hypoxic ventilatory decline of awake rats. Am J Physiol Regul Integr Comp Physiol. 2001;281:R1411–1419. doi: 10.1152/ajpregu.2001.281.5.R1411. [DOI] [PubMed] [Google Scholar]
- Talman WT, Robertson SC. Glycine, like glutamate, microinjected into the nucleus tractus solitarii of rat decreases arterial pressure and heart rate. Brain Res. 1989;477:7–13. doi: 10.1016/0006-8993(89)91388-7. [DOI] [PubMed] [Google Scholar]
- Tell F, Bradley RM. Whole-cell analysis of ionic currents underlying the firing pattern of neurons in the gustatory zone of the nucleus tractus solitarii. J Neurophysiol. 1994;71:479–492. doi: 10.1152/jn.1994.71.2.479. [DOI] [PubMed] [Google Scholar]
- Torrealba F, Muller C. Ultrastructure of glutamate and GABA immunoreactive axon terminals of the rat nucleus tractus solitarius, with a note on infralimbic cortex afferents. Brain Res. 1999;820:20–30. doi: 10.1016/s0006-8993(98)01326-2. [DOI] [PubMed] [Google Scholar]
- Travagli RA, Hermann GE, Browning KN, Rogers RC. Brainstem circuits regulating gastric function. Annu Rev Physiol. 2006;68:279–305. doi: 10.1146/annurev.physiol.68.040504.094635. [DOI] [PMC free article] [PubMed] [Google Scholar]
- Vincent A, Tell F. Postnatal changes in electrophysiological properties of rat nucleus tractus solitarii neurons. Eur J Neurosci. 1997;9:1612–1624. doi: 10.1111/j.1460-9568.1997.tb01519.x. [DOI] [PubMed] [Google Scholar]
- Weston M, Wang H, Stornetta RL, Sevigny CP, Guyenet PG. Fos expression by glutamatergic neurons of the solitary tract nucleus after phenylephrine-induced hypertension in rats. J Comp Neurol. 2003;460:525–541. doi: 10.1002/cne.10663. [DOI] [PubMed] [Google Scholar]
- Zafra F, Aragon C, Olivares L, Danbolt NC, Gimenez C, Storm-Mathisen J. Glycine transporters are differentially expressed among CNS cells. J Neurosci. 1995;15:3952–3969. doi: 10.1523/JNEUROSCI.15-05-03952.1995. [DOI] [PMC free article] [PubMed] [Google Scholar]
- Zeilhofer HU, Studler B, Arabadzisz D, Schweizer C, Ahmadi S, Layh B, Bosl MR, Fritschy JM. Glycinergic neurons expressing enhanced green fluorescent protein in bacterial artificial chromosome transgenic mice. J Comp Neurol. 2005;482:123–141. doi: 10.1002/cne.20349. [DOI] [PubMed] [Google Scholar]
- Zhang J, Mifflin SW. Receptor subtype specific effects of GABA agonists on neurons receiving aortic depressor nerve inputs within the nucleus of the solitary tract. J Auton Nerv Syst. 1998;73:170–181. doi: 10.1016/s0165-1838(98)00140-4. [DOI] [PubMed] [Google Scholar]
Associated Data
This section collects any data citations, data availability statements, or supplementary materials included in this article.


