

Abstract
DNA methylation is assumed to be complementary on both alleles across the genome, although there are exceptions, notably in regions subject to genomic imprinting. We present a genome-wide survey of the degree of allelic skewing of DNA methylation with the aim of identifying previously unreported differentially methylated regions (DMRs) associated primarily with genomic imprinting or DNA sequence variation acting in cis. We used SNP microarrays to quantitatively assess allele-specific DNA methylation (ASM) in amplicons covering 7.6% of the human genome following cleavage with a cocktail of methylation-sensitive restriction enzymes (MSREs). Selected findings were verified using bisulfite-mapping and gene-expression analyses, subsequently tested in a second tissue from the same individuals, and replicated in DNA obtained from 30 parent-child trios. Our approach detected clear examples of ASM in the vicinity of known imprinted loci, highlighting the validity of the method. In total, 2,704 (1.5%) of our 183,605 informative and stringently filtered SNPs demonstrate an average relative allele score (RAS) change ≥0.10 following MSRE digestion. In agreement with previous reports, the majority of ASM (∼90%) appears to be cis in nature, and several examples of tissue-specific ASM were identified. Our data show that ASM is a widespread phenomenon, with >35,000 such sites potentially occurring across the genome, and that a spectrum of ASM is likely, with heterogeneity between individuals and across tissues. These findings impact our understanding about the origin of individual phenotypic differences and have implications for genetic studies of complex disease.
Introduction
DNA methylation is a key epigenetic mechanism involved in the developmental regulation of gene expression.1 Alterations in DNA methylation are known to contribute to interindividual phenotypic variation and have been linked to the onset of cancer2 and complex disease phenotypes such as major psychosis.3 Across the majority of the genome, DNA methylation is assumed to be complementary on both alleles, although there are several instances where it can be allele-specific.
First, DNA methylation plays an integral role in regulating the parental-origin-dependent allele-specific expression (ASE) of imprinted loci. Only ∼40–50 genes have been shown to be classically imprinted in humans, but more subtle parental-origin effects on gene expression are speculated to be much more widespread.4 Identifying the specific location of functional elements regulating imprinting is difficult; monoallelic expression is typically regulated by allele-specific DNA methylation (ASM) at discrete imprinting control elements (ICEs), which encompass differentially methylated regions (DMRs) often only a few kb in length. Imprinted genes normally occur in clusters, and monoallelic expression across numerous loci can be controlled by ASM at a single DMR. Traditional approaches to identifying DMRs have focused on known imprinted regions and looked for patterns of completely biphasic DNA methylation. It is likely, however, that many allele-specific effects are relatively subtle, characterized by allelically skewed DNA methylation rather than clear-cut ASM patterns. Even classically imprinted regions of the genome, believed to exhibit monoallelic expression, can show considerable epigenetic heterogeneity in their expression.5 A second, related type of ASM occurs in females, where DNA methylation coordinates the random silencing of either X chromosome to ensure dosage compensation with males in a process called X chromosome inactivation.6 X inactivation in any given cell is typically random and is maintained once established so that the inactivated allele is transcriptionally silenced.
Examples of a third type of ASM have recently been reported, whereby genotype exerts an influence upon DNA methylation in cis.7–9 Such patterns have been postulated to provide a mechanism behind the common ASE differences observed throughout the genome10–15 and provide a functional role for seemingly synonymous DNA sequence changes. Several examples of ASM occurring in cis with genotype have been uncovered on chromosome 21,9,16,17 and recent evidence suggests that genotype-associated ASM is common in both human and mice.7,8 cis effects on gene expression, mediated by ASM, have been widely identified in malignant cells,18 but the degree to which they operate in normal cellular systems has yet to be systematically ascertained.
In this study, we applied an informative enrichment strategy and high-resolution microarrays to assess the full extent of human genomic ASM. We report numerous examples of allelically skewed DNA methylation across the genome. The majority appear to be cis in nature, and we also uncover previously unreported DMRs where ASM is mediated by parental origin. We report several examples of tissue-specific ASM and show that many ASM-associated SNPs are linearly associated with gene expression.
Material and Methods
Samples
The initial sampling frame for our genome-wide ASM screen was the Twins Early Development Study (TEDS), a longitudinal study of behavioral development in a representative sample of twins born in 1994, 1995, and 1996 who have been followed from infancy through adolescence.19 All twins and parents involved in TEDS provide informed consent for each stage of the study. Ethical approval for the TEDS has been provided by the King's College London (UK) ethics committee. From a sample of healthy pairs of 12-year-old monozygotic (MZ) twins, five pairs were selected: four female pairs and one male pair (n = 10). Venous blood samples were obtained from each individual and used to prepare both DNA and RNA using standard protocols. In addition, 3 ml blood was collected from each subject to assess differences in cell subtype compositions that could influence interindividual expression profiles. All cell subtype counts were in the normal range and comparable across subjects. Finally, buccal swabs were obtained from each individual and used to prepare DNA from a second tissue.20
Genome-wide Analysis of ASM
For each individual, Affymetrix SNP 6.0 arrays (Affymetrix; High Wycombe, UK) were used to genotype (1) standard genomic DNA (denoted as G), (2) DNA digested with a cocktail of methylation-sensitive restriction enzymes (MSREs) (denoted as D), and (3) whole-genome-amplified fully unmethylated DNA digested with a cocktail of MSREs (denoted as U) (to control for the effect of SNPs at enzyme cleavage sites). DNA from each individual (1 μg) was digested using a cocktail of three MSREs: HpaII (5′-ĈC G G-3′), HhaI (5′-G C ĜC-3′), and AciI (5′-ĈC G C-3′), which in combination interrogate the methylation status of ∼32.4% of CpG sites in the human genome.21 Unmethylated DNA from each individual was produced by whole-genome-amplifying 100 ng DNA using the QIAGEN REPLI-g kit (QIAGEN; Crawley, UK) following the manufacturer's protocol.
Analysis of ASM Microarray Data
To enable us to quantitatively measure the degree of ASM, we applied novel analytical techniques originally developed to assess SNP allele frequencies in DNA pools,22,23 which allowed us to accurately identify allelic skewing in addition to allelic switching following MSRE digestion. In order to compare arrays hybridized with uncut genomic DNA (G) to those hybridized with MSRE-digested (D) or artificially demethylated and then MSRE-digested (U) DNA, we scaled the raw intensities for each array by a constant to bring the mean of the 0.90–0.95 quantiles to the same value as the mean of these quantiles for the U arrays. The rationale here was that the strongest signals on the U arrays would be from amplicon fragments without MSRE sites, and these should be equal across all arrays. At the same time, the very highest few percentiles could be enriched in artifacts and therefore more variable. Because they are expected to have differing distributions, each of the G, D, and U groups was subsequently individually quantile-normalized. Relative allele score (RAS) values were generated using an updated version of our SNPMaP package (v1.02) in R,22 developed specifically for these analyses and available for download (see Web Resources). RAS is defined as A/(A + B), where A and B are the intensities of the probes for the two alleles for a given SNP, and has been validated as an accurate estimator of allele frequency in pools of DNA.23 For a given SNP in a heterozygous individual, a difference in RAS score between G and D arrays is indicative of ASM.
We applied a highly stringent filtering process to remove SNPs located in noninformative amplicons (Table S1 and Figure S1) and processed artificially unmethylated DNA from each individual in parallel to control for polymorphic MSRE sites. Amplicon fragment coordinates were obtained from the Affymetrix annotation file GenomeWideSNP_6.na27.annot.csv (corresponding to UCSC hg18) downloaded from the Affymetrix website. Fragment sequences were downloaded using Galaxy and searched to identify those with one or more MSRE cut-sites. Because the Affymetrix 6.0 assay involves preparing both NspI and StyI amplicons, SNPs can be on one or two fragments, each of which can have an MSRE site. There are thus five classes of SNPs potentially generated by our approach: a (one amplicon generated [StyI or NspI] with a MSRE cut-site), b (two amplicons generated [StyI and NspI], both containing a MSRE cut-site), c (one amplicon generated [StyI or NspI] with no MSRE cut-site), d (two amplicons generated [StyI and NspI] with neither containing a MSRE cut-site), and e (two amplicons generated [StyI and NspI] with only one containing a MSRE cut-site) (Table S1). As expected, plotting intensity ratios for the five classes of SNP from our normalized microarray data demonstrates that informative SNPs (class a and class b) have different U/G signal ratios compared to noninformative SNPs (class c, class d, and class e) (Figure S1). In addition to selecting only informative SNPs, we also required that SNPs were heterozygous in at least one MZ twin pair, did not show genotype discordance within MZ twin pairs, and passed a standard quality threshold across all arrays. Finally, SNPs yielding a variable U/G ratio (SD > 0.07) across all samples were removed to further control against inaccurate measures of ASM due to possible DNA sequence/copy-number variation polymorphisms. Raw data and a UCSC browser track showing the amplicon fragments and their informativeness in this assay is available for viewing and download from our group website.
Verification of Microarray Data
In order to verify data from the microarray analyses, ten SNPs showing high RAS changes indicative of ASM were subsequently tested using independent SNP-specific genotyping methods. Genomic DNA and unmethylated (whole-genome-amplified) DNA from the same ten individuals was independently digested with MSREs as described above. In addition to whole-blood DNA, we also processed buccal cell DNA from each individual to assess the tissue specificity of any allelically skewed DNA methylation. PCRs were designed to span the SNP and any potentially informative MSRE cut-sites within the NspI and/or StyI amplicons used in the Affymetrix protocol (Table S2). SNP genotype was quantitatively assessed using the ABI SNaPshot Single Nucleotide Primer Extension assay followed by shrimp alkaline phosphatase (SAP) treatment and electrophoresis on an ABI 3300 (Applied Biosystems) using the manufacturer's protocol.
DNA Methylation Analysis across Verified Regions
DNA methylation at MSRE cut-sites located in the Affymetrix PCR amplicons containing the SNPs selected for verification was initially assessed using Methylation-Sensitive Single Nucleotide Primer Extension (MS-SNuPE) as described by Kaminsky et al.24 In brief, 500 ng of genomic DNA was treated with sodium bisulfite as previously described3 and amplified using bisulfite-PCR. The ABI SNaPshot assay was used to quantify the relative proportion of DNA molecules methylated at each potential cut-site using the ABI SNaPshot Single Nucleotide Primer Extension assay followed by SAP treatment and electrophoresis on an ABI 3300 (Applied Biosystems) as described above. All bisulfite-based analyses included fully methylated and fully unmethylated control samples to ensure the validity of our data. Bisulfite primer sequences are presented in Table S2. A number of regions were subsequently selected for in-depth clonal bisulfite sequencing analysis to further verify our findings and determine the precise allele-specific patterns of DNA methylation. Following sodium bisulfite treatment and bisulfite-PCR amplification, amplicons were cloned using the TOPO TA cloning method (Invitrogen; Paisley, UK) and sequenced with BigDye v1.1 sequencing chemistry (Applied Biosystems), with 24–32 clones sequenced per amplicon. Sequencing traces were visualized, quality controlled, and aligned using BiQ Analyzer.25 All data were tested for complete sodium bisulfite conversion, with an overall conversion rate >99.9% estimated by BiQ Analyzer.
Replication of Selected ASM Effects in Independent Samples
We obtained 90 Centre d'Etude du Polymorphisme Humain (CEPH) genomic DNA samples extracted from transformed lymphoblastoid cell lines (Coriell Institute for Medical Research; Camden, NJ). The samples originated from 30 families (n = 30 mothers, n = 30 fathers, and n = 30 offspring), enabling us to infer both parental-origin and cis ASM effects. An aliquot of each sample was digested to completion with a cocktail of MSREs as described above. SNP genotype was quantitatively assessed in both undigested and digested samples using the ABI SNaPshot Single Nucleotide Primer Extension assay followed by SAP treatment and electrophoresis on an ABI 3300 (Applied Biosystems) as described above.
Gene Expression Analysis
Given that DNA methylation is linked to the regulation of gene expression,1 we postulated that ASM-associated SNPs might be linearly associated with the expression of nearby genes. Reliable estimates of gene expression were obtained from the same samples by profiling whole-blood mRNA from each individual four times over a 10 month period.26 Total RNA was obtained using the PAXgene Blood RNA Kit protocol (PreAnalytiX GmbH; Hombrechtikon, Switzerland). Expression profiles were generated by hybridizing cRNA derived from 5 μg total RNA to Affymetrix U133 Plus 2.0 Arrays (Affymetrix; Santa Clara, CA) in accordance with the Affymetrix Eukaryotic One-Cycle protocol with integrated globin reduction. Microarray data are MIAME compliant and available to download at the Gene Expression Omnibus website under the accession number GSE14844.
Results
Methodological Overview
A graphical overview explaining our methodological approach is given in Figure 1, and specific details are given in the Material and Methods section (above). In brief, using whole-blood DNA from ten individuals in five MZ twin pairs, with twins serving as independent genetically identical biological replicates, we employed high-resolution microarrays to quantitatively assess changes in RAS at ∼1 million SNPs following digestion with MSREs. We applied a highly stringent filtering process to remove SNPs located in noninformative amplicons and processed artificially unmethylated DNA from each individual in parallel to control for polymorphic MSRE sites. To enable us to quantitatively measure the degree of ASM, we applied novel analytical techniques originally developed to assess SNP allele frequencies in DNA pools,22,23 allowing us to accurately identify allelic skewing in addition to complete allelic switching across the population of DNA molecules present in each sample following MSRE digestion. In order to confirm data from the microarray analyses, ten SNPs showing high RAS changes indicative of ASM were subsequently tested using independent SNP-specific genotyping methods. Selected findings were independently verified in a second cell type (buccal) from the same individuals and replicated in 90 familial DNA samples obtained from the CEPH pedigrees. DNA methylation across multiple ASM-associated regions was assessed using bisulfite mapping to confirm that our observations resulted from differential methylation. Finally, using RNA samples from the same initial set of subjects, we tested to see whether ASM-associated SNPs are also associated with gene expression changes.
Figure 1.
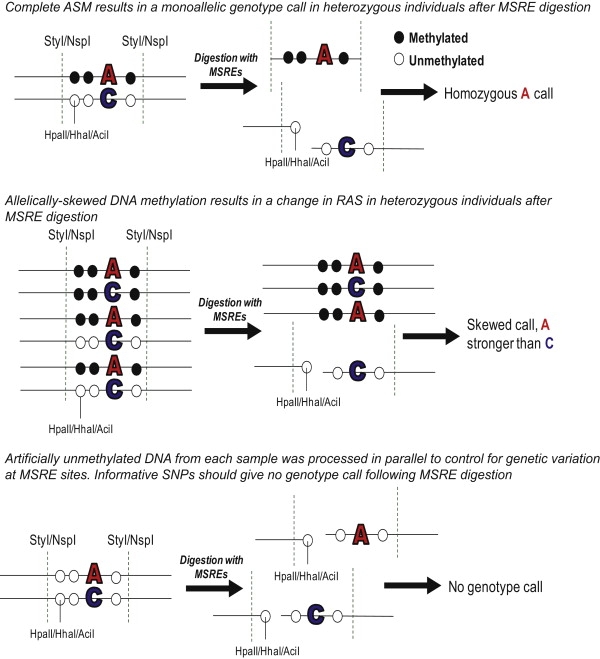
Outline of the Experimental Approach Used to Identify Allele-Specific DNA Methylation
Genomic DNA samples were digested with a cocktail of three methylation-sensitive restriction enzymes (MSREs). In parallel, artificially unmethylated DNA from each individual was digested using the same cocktail of enzymes to act as a control for the effect of genetic variation at MSRE cut-sites. Samples were subsequently genotyped on Affymetrix 6.0 genotyping microarrays with complete allele-specific DNA methylation (ASM), causing a switch from a heterozygous genotype call to a monoallelic genotype call in digested samples. To assess more quantitatively skewed ASM, we assessed relative allele score (RAS) changes in digested samples. Black circles denote methylated CpG dinucleotides. White circles denote unmethylated CpG dinucleotides.
Genome-wide Patterns of ASM
In total, 183,605 informative SNPs, located in amplicons covering 7.6% of the human genome, passed our stringent filtering criteria (see Material and Methods) and gave heterozygous genotype calls in at least one twin pair. A UCSC browser track showing the location of all informative SNP-containing amplicons is available for download from our group website. For each of these SNPs, we calculated the average RAS difference in heterozygous individuals following MSRE digestion and microarray analysis (see Figure S2 for genome-wide distribution). In total, we identified 2704 (1.5%) SNPs with an average RAS change ≥0.10. Extrapolating these findings to the remainder of the genome suggests that >35,000 such ASM-associated sites probably exist. Table 1 lists those SNPs showing the greatest degree of ASM with an average RAS change >0.30. ASM data for each of the samples profiled using this method are available to view as downloadable tracks in the UCSC Genome Browser from our website. In order to estimate the proportion of ASM determined by (1) local genotype (i.e., cis effects) and (2) other factors (i.e., trans effects, parental origin, or stochasticity), we assessed the consistency in direction of RAS change across heterozygous samples. Of the 2704 informative SNPs with a RAS change ≥0.10 for which there are three or more heterozygous genotypes, the majority (90.3%) appear to be associated with cis-acting ASM. This is in broad agreement with a recent study reporting that ASM in mouse strains is primarily determined by cis-acting factors,7 but it is noticeable that at least 9.7% of ASM-associated SNPs in our study show some inconsistency in skewing, indicating they are unlikely to be cis in nature. In reality, this proportion is likely to be higher, given that some non-cis ASM effects will go in the same direction across all heterozygous individuals by chance in the samples we processed.
Table 1.
SNPs Showing Strong Evidence for an Association with ASM as Demonstrated by an Average Change in RAS >0.30 Following MSRE Digestion
| SNP ID | Average RAS Change | Location | Nearest Gene |
|---|---|---|---|
| SNP_A-1844633 (rs7010076) | 0.43 | 8q22.3 | TM7SF4 |
| SNP_A-1795087 (rs8179387) | 0.39 | 1p36.12 | CELA3B |
| SNP_A-4240542 (rs2731826) | 0.38 | 5q15 | TTC37 |
| SNP_A-8327043 (rs17224644) | 0.38 | 20p12.3 | FERMT1 |
| SNP_A-8694024 (rs10518694) | 0.37 | 15q21.2 | ONECUT1 |
| SNP_A-1921713 (rs6760544) | 0.36 | 2q21.1 | RAB6C |
| SNP_A-8528087 (rs4796537) | 0.35 | 17p13.2 | MED31 |
| SNP_A-8590194 (rs12084204) | 0.35 | 1p36.13 | CAPZB |
| SNP_A-1841543 (rs10234308) | 0.34 | 7p15.3 | MGC87042 |
| SNP_A-1932077 (rs220030) | 0.34 | 15q11.2 | SNRPN |
| SNP_A-4258853 (rs4758622) | 0.34 | 11p15.4 | NAP1L4 |
| SNP_A-8638885 (rs10148112) | 0.33 | 14q32.2 | CYP46A1 |
| SNP_A-1898177 (rs8042219) | 0.32 | 15q15.1 | PLA2G4D |
| SNP_A-1899896 (rs4620270) | 0.32 | 8q24.13 | TRMT12 |
| SNP_A-1784536 (rs3821023) | 0.31 | 2p22.1 | GALM |
| SNP_A-1859378 (rs6494120) | 0.31 | 15q22.2 | GCNT3 |
| SNP_A-1871081 (rs629018) | 0.31 | 19q13.11 | LSM14A |
| SNP_A-4235888 (rs4573528) | 0.31 | 1q41 | HHLPI2 |
| SNP_A-8444607 (rs2233287) | 0.31 | 5q33.1 | TNIP1 |
| SNP_A-8444965 (rs4545169) | 0.31 | 9q34.3 | FCN2 |
| SNP_A-8628263 (rs809722) | 0.31 | 14q22.1 | PTGDR |
Verification of Microarray Data and Replication in Additional Samples
We selected ten ASM-associated SNPs from our microarray screen for independent verification and further investigation. Individual examples are discussed in detail in the sections below, but in all cases we were able to confirm the results of the microarray analysis, suggesting that our approach and stringent filtering techniques provide an accurate representation of patterns of ASM across the genome. MS-SNuPE analyses on bisulfite-treated DNA from the same individuals also uncovered patterns of DNA methylation consistent with ASM. Six loci were selected for replication analysis in DNA obtained from 30 CEPH family trios. In each case, we were able to verify the patterns of ASM observed in our initial set of samples. The large number of samples in this replication stage, in conjunction with the availability of parental genotype information, allowed us to determine whether ASM was associated with genomic sequence in cis or was influenced by parental origin. Finally, we performed in-depth clonal bisulfite sequencing, considered the “gold-standard” method for assessing allelic patterns of DNA methylation, across four regions. Again these analyses confirmed the patterns of ASM predicted from our microarray screen and subsequent verification experiments.
Testing the Validity of Our Approach: Confirming ASM at Known Imprinted Regions
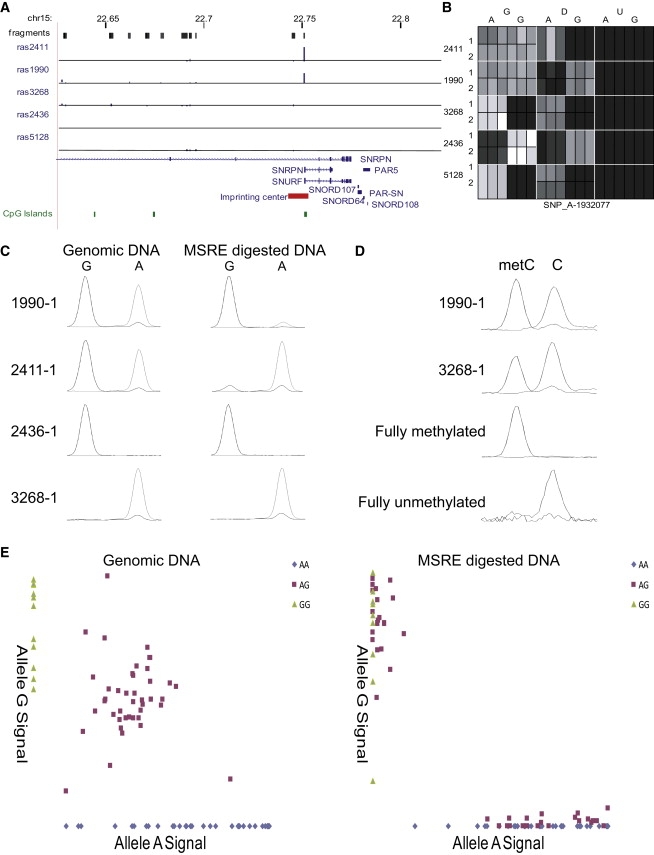
Figure 2 highlights the validity and power of our method for mapping functional DMRs. We observe a large shift in RAS for SNP_A-1932077 (rs220030) located within a known ICE spanning the promoter and first exon of SNRPN (Figures 2A and 2B), known to control monoallelic expression from the paternal allele of a cluster of imprinted genes on 15q11.2.27 Across informative individuals, the average RAS change for this SNP was 0.34, with array results subsequently verified by single-nucleotide primer extension assays (Figure 2C). Sodium bisulfite analysis of CpG sites within MSRE cut-sites present in the amplicon interrogated by the genotyping microarray confirmed a biphasic DNA methylation profile across all samples (Figure 2D), a pattern also observed in buccal cell DNA from the same individuals. Neither DNA methylation at this locus nor expression of SNRPN is associated in cis with genotype, as expected for an imprinted region (Figure S3). Finally, we replicated the pattern of genotype-independent ASM at this region in samples obtained from 30 CEPH family trios, confirming that DNA methylation occurs specifically on the maternally inherited allele (see Figure 2E).
Figure 2.
Strong ASM in the SNRPN Promoter Overlaps with a Region Previously Identified as a DMR Regulating Monoallelic Expression across the 15q11.2 Imprinted Gene Cluster
(A) The location of potentially informative fragments are shown in black, with the average RAS change in each of the five MZ twin pairs for individual SNPs within each fragment shown as blue bars. This figure was adapted from an annotated UCSC Genome Browser track containing all our microarray data, available for download from our laboratory website. Large RAS changes are seen in both twin pairs heterozygous for SNP_A-1932077 (rs220030), located immediately upstream of the SNRPN transcription start site.
(B) Heat map of normalized array signal data for the three probes representing SNP_A-1932077 (rs220030). The genotype (G) demonstrates a clear switch to monoallelic signal in the digested samples (D) for both members of twin pairs 2411 and 1990, who are heterozygous for this polymorphism. A different allele is methylated in each pair, as might be expected in an imprinted locus. The remaining three pairs are homozygous for SNP_A-1932077 (rs220030) and do not change in genotype call with digested DNA (column D), but show reduced signal intensity consistent with the loss of one parental allele. The unmethylated and digested samples (U) show a total loss of signal across all samples assessed, so this pattern is not due to polymorphic MSRE cut-sites.
(C) Verification of the microarray data using SNuPE confirms a switch to monoallelic genotype in digested heterozygous samples. Shown are data from one member of each twin pair, confirming the loss of alternative alleles in each family.
(D) MS-SNuPE analysis of a HhaI MSRE cut-site in the SNP_A-1932077 amplicon confirms this region is hemimethylated.
(E) Data from 90 familial CEPH samples showing complete loss of heterozygosity after MSRE digestion, with a variable direction of ASM across individuals.
Our approach detected clear examples of ASM in the vicinity of other known imprinted loci (Table 2). These include large RAS changes for SNPs located near H19, including several in the vicinity of the H19-DMR located ∼2 kb upstream of the transcriptional start site. This region is known to act as a boundary element, instigating monoallelic expression across a cluster of genes on 11p15 via interactions with the vertebrate insulator protein, CCCTC-binding factor.27 Several other large RAS changes were identified in the 11p15 region, including at SNP_A-4258853 (rs4758622), which provides evidence for strong allelic skewing of DNA methylation in the first intron of NAP1L4. Contradictory evidence exists about whether the mouse ortholog of this gene (Nap1l4) is imprinted,28 and its status in humans is unknown. Intriguingly, our data suggest that the ASM at this region is not due to imprinting but appears to be caused by cis-acting genetic effects (Figure S4).
Table 2.
Examples of Informative ASM-Associated SNPs Located Near Known Imprinted Loci
| Location | SNP ID | Average RAS Change | Nearest Gene(s) | Known Imprinted Genes in Region |
|---|---|---|---|---|
| 2p12 | SNP_A-8486811 (rs11883960) | 0.24 | CTNNA2a- LRRTM1 | LRRTM1 |
| 6q25.3 | SNP_A-2187171 (rs539958) | 0.11 | SLC22A3b | IGF2R, SLC22A2, SLC22A3 |
| 7p12.2 | SNP_A-8615031 (rs12719019) | 0.14 | IKZF1a | DDC, GRB10 |
| 7q21.3 | SNP_A-2262372 (rs1029391) | 0.17 | SLC25A13a | PPP1R9A |
| 11p15.4 | SNP_A-4258853 (rs4758622) | 0.34 | NAP1L4c | H19, IGF2, IGF2AS, INS, KCNQ1, KCNQ10T1, KCNQ1DN, CDKN1C, SLC22A18, PHLDA2, OSBPL5 |
| 11p15.5 | SNP_A-4301486 (rs2107425) | 0.17 | H19 | H19, IGF2, IGF2AS, INS, KCNQ1, KCNQ10T1, KCNQ1DN, CDKN1C, SLC22A18, PHLDA2, OSBPL5 |
| SNP_A-8447191 (rs2735971) | 0.10 | |||
| SNP_A-8613640 (rs4930101) | 0.21 | |||
| SNP_A-8608669 (rs12417375) | 0.19 | |||
| SNP_A-8654762 (rs2735469) | 0.18 | |||
| 11p15.5 | SNP_A-8632218 (rs10840442) | 0.11 | INS-IGF2 | H19, IGF2, IGF2AS, INS, KCNQ1, KCNQ10T1, KCNQ1DN, CDKN1C, SLC22A18, PHLDA2, OSBPL5 |
| 14q32.2 | SNP_A-8638885 (rs10148112) | 0.33 | EML1a | DLK1, GTL2, RTL1 |
| 14q32.31 | SNP_A-8303781 (rs1889364) | 0.15 | DIO3c | DLK1, GTL2, RTL1 |
| 14q32.31 | SNP_A-8417055 (rs10431745) | 0.18 | PPP2R5Ca | DLK1, GTL2, RTL1 |
| 15q11.2 | SNP_A-1932077 (rs220030) | 0.34 | SNURF-SNRPN | MKRN3, MAGEL2, NDN, PWRN1, C15ORF2, SNURF-SNRPN, UBE3A, ATP10A |
| 19q13.41 | SNP_A-8392857 (rs8105870) | 0.22 | ZNF331 | ZNF331 |
| SNP_A-8655708 (rs7248353) | 0.20 | |||
| 19q13.43 | SNP_A-8306238 (rs10412302) | 0.15 | MIMT1, ZIM2-PEG3 | MIMT1, ZIM2, PEG3 |
| 20q13.32 | SNP_A-8660497 (rs3761263) | 0.17 | GNAS | GNAS |
Imprinting status unknown.
Previously shown to exhibit only temporary imprinting, with monoallelic expression limited to the first-trimester placenta.
Known to be imprinted in mouse, but status in humans is unknown.
The utility of our approach for identifying the location of DMRs associated with known imprinted genes is exemplified by evidence for an average RAS change of 0.24 at SNP_A-8486811 (rs11883960). This SNP is located downstream of LLRTM1 on chromosome 2p12, within an intron of CTNNA2 (Figure S5A). Genetic polymorphisms in LLRTM1 have been associated with schizophrenia (MIM 181500) in a parental-origin-specific manner, and the gene was previously shown to be monoallelically expressed, presumably because of imprinting.29 Previous analyses of three CpG islands immediately upstream of the gene failed to detect any ASM, and the location of the DMR associated with monoallelic expression is unknown.29 Although we are unable to conclusively determine that this region is influenced by genomic imprinting, our data provide evidence for a DMR located ∼250 kb downstream of the transcription start site in a region not classically defined as a CpG island. Microarray data suggest that rather than being characterized by total monoallelic DNA methylation, this region shows more subtle allelic skewing of DNA methylation (Figure S5B), a conclusion confirmed by our SNuPE verification experiments with the average G/A allelic ratio switching from 1.9 in heterozygous genomic DNA samples to 2.5 in MSRE-digested heterozygous samples.
One of the loci selected for further investigation demonstrates evidence for parental-origin-mediated ASM in a genomic region not previously known to be imprinted. SNP_A-1782879 (rs17427250), located at 5q34 upstream of ATP10B and downstream of GABRB2, was found to have an average RAS change of 0.30 in heterozygous individuals (Figures 3A and 3B), an observation confirmed by SNuPE analysis (Figure 3C). Interestingly, this ASM appears to be tissue specific; our original analyses on blood DNA highlight almost complete loss of one allele following MSRE digestion in heterozygotes; this is not the case in buccal cell DNA from the same individuals (Figure 3C). Clonal bisulfite sequencing across this region in blood confirms a pattern of biphasic DNA methylation at an AciI cut-site (Figure 3D). Direct bisulfite sequencing found this site to be consistently hemimethylated in blood DNA but fully methylated in buccal DNA obtained from the same individuals (Figure 3E). Loss of heterozygosity following MSRE digestion was confirmed in the 30 CEPH trios, with different alleles being cleaved in different individuals (Figure 3F). Such a pattern of allelic flipping is consistent with genomic imprinting, and we confirmed using parental genotypes that it is the paternally inherited allele that is always cleaved (unmethylated). It has been previously shown that many imprinted regions show marked changes in DNA methylation during development and can acquire tissue-specific ASM.30
Figure 3.
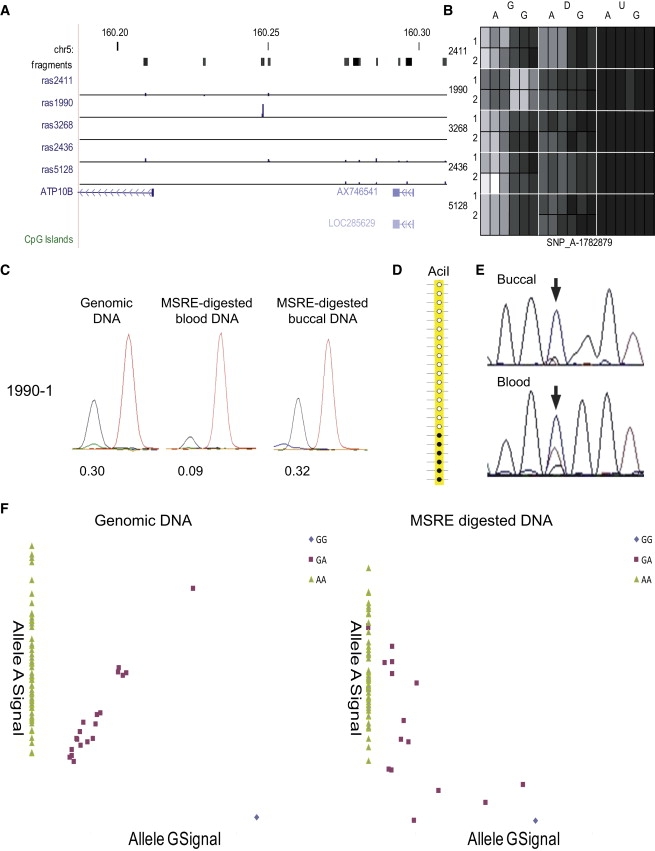
Evidence for Tissue-Specific ASM Associated with Parental Origin at SNP_A-1782879 (rs17427250), Located at 5q34 Upstream of ATP10B
(A and B) Location of the SNP showing an average RAS change of 0.30 in heterozygous individuals corresponding to almost complete loss of signal from one allele following MSRE digestion (B).
(C) These findings were verified using SNuPE in the original blood DNA, but there is no evidence of ASM in buccal cell DNA from the same individuals.
(D) Clonal bisulfite sequencing confirmed this is a DMR, with a biphasic DNA methylation pattern at an informative AciI MSRE cut-site in the Affymetrix SNP amplicon.
(E) Bisulfite sequencing in samples from family 1990 confirms tissue-specific differences in ASM, with blood samples showing a mixture of methylated and unmethylated alleles but buccal samples being fully methylated, including at an informative AciI site in the Affymetrix SNP amplicon.
(F) Analysis of ASM at this SNP in 30 CEPH family trios (n = 90 individuals) demonstrated consistent loss of heterozygosity following MSRE digestion, although the effect was not in cis with genotype and likely due to genomic imprinting.
cis-Regulated ASM Effects
Several examples of ASM at nonimprinted loci, presumably occurring because of cis-acting genotypic effects on DNA methylation, have been previously reported.8,9 We confirmed many of these previously identified examples using our approach, again highlighting the validity of our screening methods (Table 3 and Figure 4). In many instances, the high density of informative SNPs in our study, afforded by the use of multiple MSREs and a high-resolution microarray platform, allowed more specific localization of these previously identified ASM effects. For example, a region located in intron 13 of the LTF gene on chromosome 3p21.31 and within 1 kb of another SNP (rs1042073) reported by Kerkel and colleagues to be associated with strong cis-acting ASM8 was found to contain three additional SNPs with significant average RAS changes in heterozygous individuals following MSRE digestion: SNP_A-1972595 (rs6441990), SNP_A-2149420 (rs6441991), and SNP_A-1876897 (rs6441992) (see Figures 5A and 5B). Genotype-associated ASM at LTF SNPs was confirmed using SNuPE analyses (Figures 5C and 5D) and replicated in the CEPH family DNA from 30 trios (Figures 5E and 5F). At both SNP_A-1972595 (rs6441990) and SNP_A-2149420 (rs6441991) we observe a highly significant change in allele ratio after MSRE digestion in heterozygous individuals, confirming a cis effect on ASM. For SNP_A-1972595, there is a highly significant loss in allele G signal following MSRE digestion: as a proportion of the total genotyping signal, the average level of allele G falls from 0.78 (±0.00) to 0.04 (±0.10) after cleavage (p = 2.7E-29). For SNP_A-2149420 there is complete loss in allele A signal following MSRE digestion: as a proportion of the total genotyping signal, the average level of allele A falls from 0.47 (±0.08) to 0.00 (±0.00) after cleavage (p = 0). Clonal bisulfite sequencing analysis of an amplicon spanning ten CpG sites revealed a clear pattern of ASM associated with the three SNPs. G-A-A haplotypes are associated with lower CpG methylation compared to C-T-T haplotypes (10% versus 72%) across sites 1–4 spanning the three SNPs, including at an informative HpaII site within the Affymetrix genotyping amplicon (Figure 5G). Interestingly, this pattern of ASM only extended to CpG sites in the immediate vicinity of the three SNPs, indicating that cis effects on epigenotype can be very local with discrete boundaries, an observation also reported in other studies of ASM.9
Table 3.
Examples of Informative ASM-Associated SNPs in Regions with Known Parental-Origin-Independent ASM
| Location | SNP ID | Average RAS Change | Nearest Gene(s) | Previous Evidence for Genotype-Associated ASM |
|---|---|---|---|---|
| 3p21.31 | SNP_A-1972595 (rs6441990) | 0.24 | LTF | Another SNP located in exon 13 of this gene was found to show ASM by Kerkel et al.8 |
| 3p21.31 | SNP_A-2149420 (rs6441991) | 0.14 | LTF | See above. |
| 3p21.31 | SNP_A-1876897 (rs6441992) | 0.16 | LTF | See above. |
| 6p21.2 | SNP_A-4250374 (rs9366927) | 0.19 | FGD2-PIM1 | The same SNP was identified as showing ASM in Kerkel et al.8 |
| 13q12.12 | SNP_A-2065646 (rs943049) | 0.23 | LOC374491 (between PARP4 and ATP12A) | The same SNP was identified as showing ASM in Kerkel et al.8 |
| 15q22.2 | SNP_A-1859378 (rs6494120) | 0.31 | GCNT3 | The same SNP was identified as showing ASM in Kerkel et al.8 |
| 19q13.2 | SNP_A-8631787 (rs13382161) | 0.18 | CYP2F1 | Two SNPs in the CYP2 cluster shown to demonstrate ASM in a subsection of samples by Kerkel et al.8 |
| 21q22.3 | SNP_A-2020619 (rs2236472) | 0.27 | COL18A1 | Allele-specific, parental-origin-independent methylation detected upstream of SLC19A1, immediately adjacent to COL18A1.17 |
Examples of informative ASM-associated SNPs located near regions previously shown to demonstrate parental-origin-independent ASM.
Figure 4.
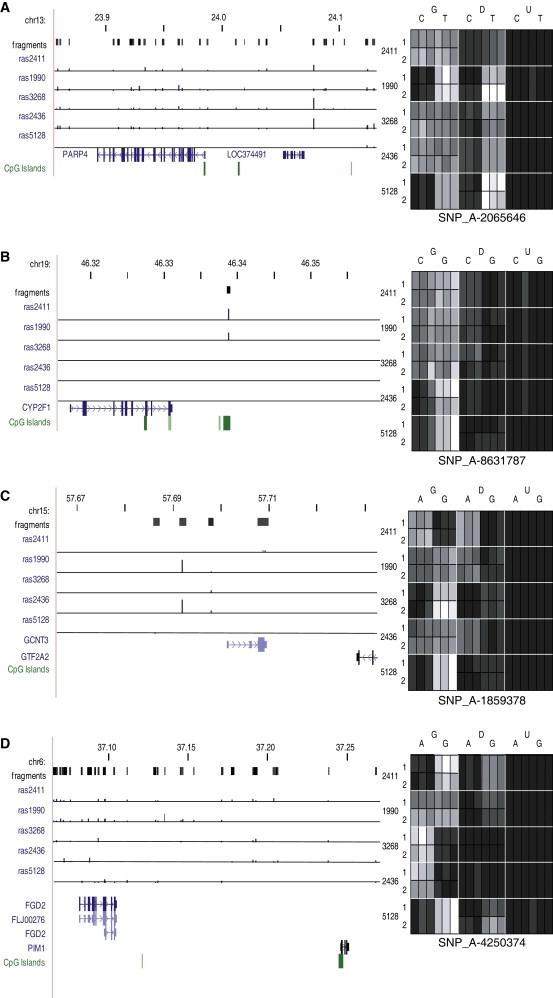
Confirmation of Previously Identified cis-Acting ASM
(A–D) We confirmed several previously identified examples of ASM with large RAS changes following MSRE digestion identified for SNPs near LOC374491 (A), CYP2F1 (B), GCNT3 (C), FGD2-PIM1 (D), and LTF (see Figure 5). See also Table 3.
Figure 5.
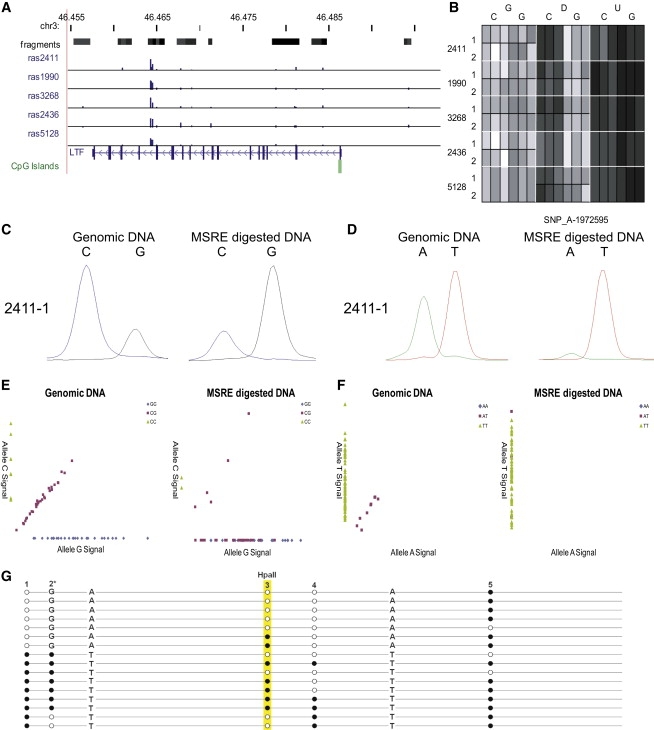
Intron 13 of the LTF Gene Contains Three SNPs Associated with ASM in cis
(A) Location of SNP_A-1972595 (rs6441990), SNP_A-2149420 (rs6441991), and SNP_A-1876897 (rs6441992) with the average RAS change across heterozygous individuals shown as blue bars.
(B) Heat map of normalized array signal data for the three probes representing SNP_A-1972595 (rs6441990), demonstrating a consistent loss of heterozygosity following MSRE digestion.
(C and D) Microarray data were verified using SNuPE analyses. Shown are examples for (C) (SNP_A-1972595 [rs6441990]) and (D) (SNP_A-2149420 [rs6441991]).
(E and F) cis-acting ASM was confirmed in the 30 CEPH family trios. Shown are data for (E) (SNP_A-1972595 [rs6441990]) and (F) (SNP_A-2149420 [rs6441991]).
(G) Clonal bisulfite sequencing confirmed that G-A-A haplotypes are associated with lower DNA methylation (10%) compared to C-T-T haplotypes for four CpG sites spanning the three SNPs, including an informative HpaII site.
From the genome-wide data generated, we selected several previously unreported regions of cis-associated ASM for additional analyses. One of the strongest average RAS changes (0.36) was at SNP_A-1921713 (rs6760544), located ∼43 kb upstream of RAB6C (also known as WTH3) on chromosome 2q21.1 (Figure 6A). After MSRE digestion, individuals heterozygous for this SNP entirely lose the signal from the T allele (Figure 6B). Individuals with a homozygous TT genotype show a loss of all signal following digestion, similar to the artificially unmethylated samples we ran as assay controls. GG homozygotes show no change in their signal intensity, showing that they are fully methylated. These findings were verified using independent SNuPE analyses and replicated in the CEPH family trios (Figure 6C). Across CEPH samples heterozygous for SNP_A-1921713 (rs6760544), there is a highly significant loss in allele T signal following MSRE digestion: as a proportion of the total genotyping signal, the level of allele T falls from 0.31 (±0.05) to 0.07 (±0.09) after cleavage (p = 5.6E-14). Sodium bisulfite analyses of the two MSRE cut-sites in the amplicon containing SNP_A-1921713 confirmed that allele T is associated with unmethylated DNA alleles and allele G with methylated DNA alleles in both blood and buccal cell DNA (Figure 6D). A pattern of near-complete cis-acting ASM across multiple CpG sites in this region was confirmed by clonal bisulfite sequencing (Figure 6E). Strikingly, no CpG sites in phase with allele T are methylated, but 83% of those in phase with allele G are methylated.
Figure 6.
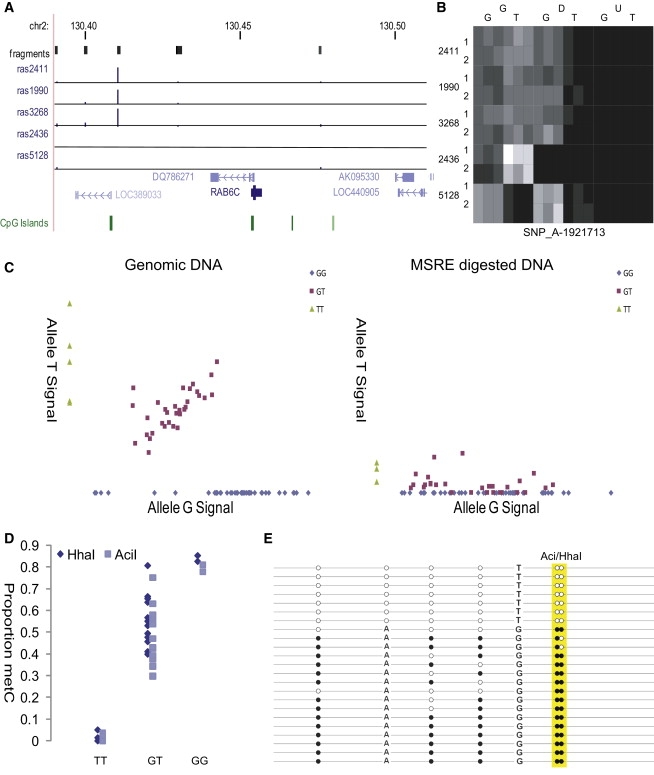
Analysis of SNP_A-1921713 (rs6760544) Located Upstream of RAB6C, which Shows Strong Evidence for a cis-Regulated ASM
(A) Location of the SNP ∼43 kb upstream of RAB6C showing an average RAS change of 0.36.
(B) Heat map of normalized microarray signal data for the three probes representing this SNP. Signals for the G allele do not differ between columns G and D, but the T allele signals are reduced to nearly the levels of the U (unmethylated) column. This complete MSRE digestion shows that the T allele carrying haplotype is unmethylated.
(C) A pattern of cis-acting ASM associated with SNP_A-1921713 (rs6760544) was confirmed in the 30 CEPH family trios.
(D) Bisulfite analysis at the HhaI and AciI MSRE cut-sites in the fragment incorporating rs6760544 confirms that DNA molecules containing allele T are unmethylated and DNA molecules containing allele G are methylated. This pattern is consistent across blood and buccal cell DNA and observed in all samples tested.
(E) Clonal bisulfite sequencing confirmed a clear allelic association with DNA methylation across six CpG sites, including two located in informative MSRE cut-sites contained within the Affymetrix genotyping amplicon.
We verified RAS changes following MSRE digestion for several other SNPs where ASM appears to be associated with genotype in cis, including at SNP_A-8638885 (rs10148112), located between CYP46A1 and EML1 on chromosome 14q32.2 (Figure S6), and SNP_A-1795087 (rs8179387), located between HSPG2 and CELA3B on chromosome 1p36.12 (Figure S7). Another locus, SNP_A-2002432 (rs4936180), located at 11q25 within the OPCML gene (Figure 7A), exemplifies how cis-associated ASM can be heterogeneous between individuals and across tissues. At this SNP, we observe a consistent reduction in allele C signal across all heterozygote (C/T) samples (average RAS change = 0.19) (Figure 7B). The loss of allele C is not absolute in all samples; C/C homozygotes show some residual microarray signal, and loss of heterozygosity is not total in all heterozygotes, an observation confirmed in both our SNuPE verification assays and replication analysis on the 30 CEPH family trios (Figure 7C). Although there is a highly significant loss in allele G signal following MSRE digestion (as a proportion of the total genotyping signal, the level of allele G falls from 0.34 [±0.06] to 0.03 [±0.09] after cleavage in C/T heterozygotes [p = 3.9E-20]), the CEPH data confirm the incomplete nature of ASM at this locus. C/C homozygotes demonstrate a highly significant (p = 9.6E-09) loss of total SNuPE signal intensity following MSRE digestion, but there is considerable variability, with some individuals showing total ablation of signal and other individuals much more modest changes. Sodium bisulfite analysis, via both MS-SNuPE and clonal bisulfite sequencing, demonstrates that there is some residual DNA methylation at an informative AciI cut-site in the SNP_A-2002432 amplicon present on many C alleles (Figure 7D). CC homozygous individuals that don't show a total ablation of signal have an average DNA methylation level of 8% at this MSRE cut-site. We also tested ASM for this SNP in buccal cell DNA, finding evidence for tissue heterogeneity in ASM within individuals; in contrast to blood, no heterozygous buccal samples show a complete loss of the C allele following MSRE digestion, but there is still strong allelic skewing, and some individuals demonstrate stronger skewing in buccal DNA than blood DNA (Figure 7E). Furthermore, C/C homozygote buccal samples do not show the near total loss of signal seen in blood samples following MSRE digestion and are characterized by DNA methylation patterns similar to those seen in heterozygotes. It has been recently demonstrated that tissue-specific cis effects on gene expression are relatively common,13,31 and our data suggest that such heterogeneity could be mediated by epigenetic differences. Evidence to support the notion that the expression of OPCML is regulated by genotype-associated ASM comes from our transcriptomic data on the same set of blood samples; C/C homozygotes show significantly higher expression than C/T heterozygotes (Figure 7F). Interestingly, loss of OPCML expression in ovarian cancer (MIM 167000) has been previously associated with increased CpG methylation in the gene.32
Figure 7.
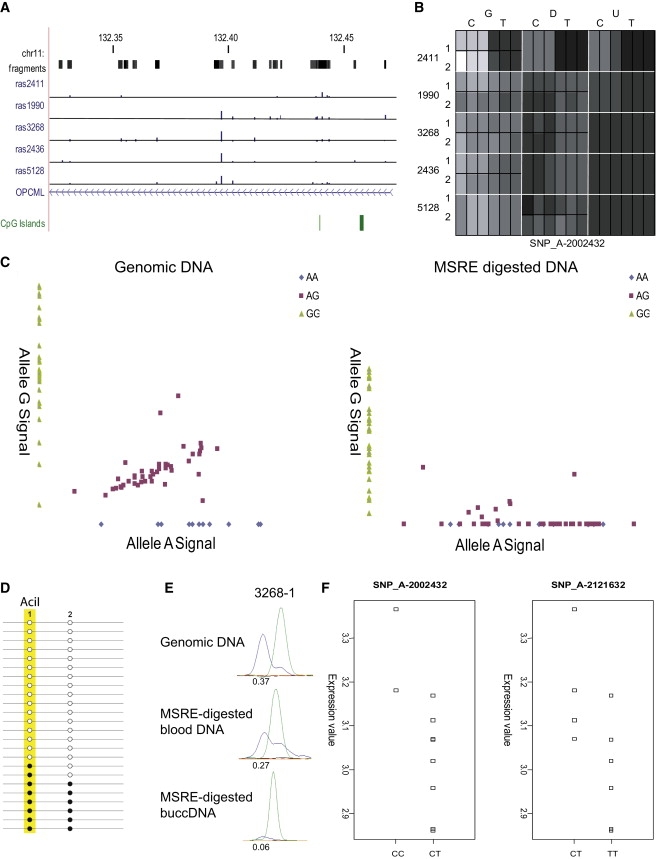
Analysis of SNP_A-2002432 (rs4936180) Located within OPCML, which Shows Evidence of Tissue-Specific cis-Mediated ASM
(A–C) Location of the SNP, which shows an average RAS change of 0.19 across heterozygous individuals and is characterized by reduction of the C allele signal following MSRE digestion in blood DNA (B). The loss of allele C is not always complete; C/C homozygotes show some residual microarray signal, and loss of heterozygosity is not total in all heterozygotes, an observation confirmed in both our SNuPE verification assays and replication analysis (C) on the 30 CEPH family trios.
(D) Bisulfite analysis of an AciI MSRE site support these data and highlight heterogeneity between samples, with some residual DNA methylation present on some C alleles; a biphasic, although not complete, pattern of DNA methylation at this MSRE site is confirmed by clonal bisulfite sequencing.
(E) ASM at this locus is characterized by considerable tissue heterogeneity.
(F) OPCML expression in blood is significantly associated with genotype at both SNP_A-2002432 (p < 0.02) and another nearby ASM-associated locus, SNP_A-2121632 (rs10791256) (p < 0.04), which shows an average RAS change of 0.12 across heterozygous individuals.
ASM-Associated SNPs and Gene Expression
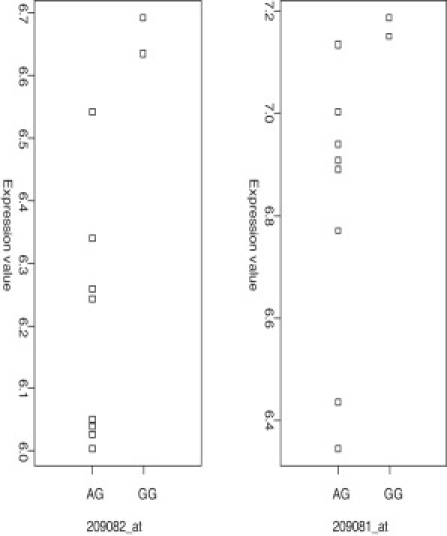
Given that DNA methylation is linked to the regulation of gene expression,1 we postulated that any cis-acting ASM-associated SNPs might be linearly associated with the expression of nearby genes. Reliable estimates of gene expression were obtained from the same samples by profiling whole-blood mRNA from each individual four times over a 10 month period (see Material and Methods). Of the 2704 informative SNPs with a RAS change ≥0.10, 651 map to within 5 kb of a gene expressed at detectable levels in blood. Samples were grouped by genotype for each SNP, and transcript levels across genotype groups were assessed using a linear effects model for each probe set. Because some SNPs are located within 5 kb of more than one gene and each gene can be represented by more than one expression probe set, 1316 such SNP-expression associations were tested. Strikingly, 214 (16.3%) provided evidence for a significant (p < 0.05) linear association between genotype and transcript abundance, confirming the notion that many of the ASM effects we detect correlate with allelic expression differences that are likely to be cis in nature (Table S3). As examples, Figure 8 and Table S4 highlight the five most significant such associations, for SNPs located near CD180, PRUNE2, CHST13, HPCAL1, and C12orf47. Out of the ASM regions detected in our study for which there was previous evidence of ASM (see Table 3 and Figure 4), reliable levels of expression in blood were obtained only for COL18A in which SNP_A-2020619 (rs2236472) has an average RAS change of 0.27 across heterozygous individuals. Interestingly, genotype is significantly associated with transcript abundance (Figure 9), suggesting a cis-acting effect on gene expression that is mediated by ASM. As expected, no consistent relationship between genotype and transcript abundance was observed for ASM-associated SNPs located near known imprinted loci; ASE of imprinted genes is controlled by the parental origin of alleles and not by genotype. The full expression data set for ASM-associated SNPs can be seen online at our group website.
Figure 8.
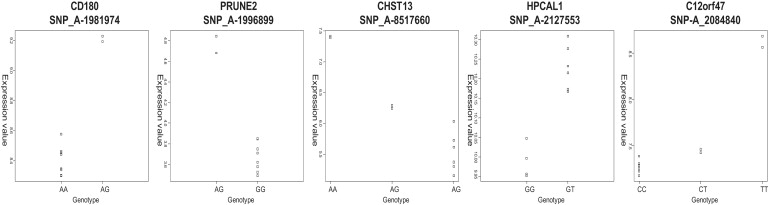
Examples of Association between Genotype at ASM-Associated SNPs and Gene Expression
Genotype was compared with gene expression at nearby (<5 kb) genes using a linear model. An unadjusted p < 0.0001 cutoff was applied. Of the 5 genes presented, 2 are represented by more than one microarray probe set; shown are the most significant probe sets, but in each case the other probes in the same transcript show significant (p < 0.005) expression changes in the same direction (205462_at in HPCAL1 and 64432_at and 1553987_at in C12orf47). In total, >16% of loci demonstrating a change in RAS >0.10 following MSRE digestion, for which reliable expression data are available, show a significant linear association between genotype and transcript abundance.
Figure 9.
cis-Acting ASM Near COL18A1 Is Associated with Gene Expression
The abundance of COL18A1 transcripts, as measured by two Affymetrix gene expression microarray probe sets, is associated with genotype at SNP_A-2020619 (rs2236472), suggesting that ASM at this locus has a direct effect on transcription.
In addition to testing whether patterns of allelic DNA methylation are associated with steady-state mRNA levels from the same tissue, we incorporated data from a recent genome-wide survey of ASE by Ge and colleagues33 into our analysis of ASM. A UCSC track showing ASE data from this study is downloadable from our website. As an example, COL18A (see discussion above) contains a SNP demonstrating highly skewed allelic expression, further supporting the notion that the ASM detected at SNP_A-2020619 (rs2236472) directly mediates ASE. Overall, our 2704 SNPs with a RAS change ≥0.10 correspond to 1565 well-annotated loci34 (see Web Resources), of which 451 (28.8%) contain a SNP with an ASE score >0.10 in the data obtained from Ge and colleagues.33 These genes are available to download from our laboratory website. Permutation analysis randomly sampling SNPs from the ASE data indicated this represents a significant enrichment, suggesting that many of the genes located in the vicinity of ASM-associated SNPs demonstrate allelically skewed expression (p < 0.05, 5000 permutations).
Discussion
Using a comprehensive enrichment strategy, high-resolution microarrays, and a novel analytical approach, we have, to our knowledge, performed the first large-scale quantitative survey of ASM across the genome. Our data show that ASM is widespread and mediated by both parental-origin (imprinting) and cis effects. Furthermore, we show that ASM is often associated with changes in transcript abundance and that there is considerable heterogeneity between individuals and across tissues. Our ASM data are freely available via fully annotated UCSC Genome Browser tracks that provide a valuable resource for the (epi)genetics research community.
Five lines of evidence confirm that our microarray-based screen of allelic changes following MSRE digestion is tagging real allelic differences in DNA methylation. First, as described under Material and Methods, we have taken an extremely stringent approach to data analysis in order to avoid false-positive observations. In addition, we included parallel analyses of fully unmethylated DNA samples from the same individuals to overcome the confounding effect of polymorphic SNPs in MSRE cut-sites. Second, many of the regions identified as showing large changes in RAS following MSRE digestion in our microarray screen are located either in the vicinity of DMRs associated with known imprinted loci or near regions previously nominated as containing cis-acting variants associated with ASM (see Tables 2 and 3). Third, we have succeeded in verifying each of ten selected ASM-associated SNPs using a second quantitative genotyping method on the same samples. Fourth, we replicated these findings in an independent set of 30 CEPH family trios (90 individuals); the relatively large number of replication samples and their familial nature meant we could deduce whether ASM patterns at each locus were due to cis effects of genotype or parental-origin influences (i.e., genomic imprinting). Finally, we directly assessed DNA methylation across relevant MSRE cut-sites contained in the Affymetrix amplicons for each SNP using two sensitive methods of quantitative DNA methylation profiling: (1) MS-SNuPE and (2) the clonal sequencing of bisulfite PCR amplicons. The latter uncovered clear biphasic patterns of DNA methylation, linked to genotype, across each of the amplicons tested.
Our findings have profound implications for genetic studies of complex disease. The most common category of ASM, what we call cis effects, must be due to local sequence features. This provides one mechanism by which noncoding sequence features can have phenotypic effects. For example, DNA methylation displaces the binding of transcription factors and attracts methyl-binding proteins that instigate chromatin compaction and gene silencing. There is a clear quantitative distribution of RAS changes in our data set, and bisulfite sequencing confirms incomplete ASM in many instances. ASM is also heterogeneous between individuals and across tissues. Such heterogeneity in cis effects could be one cause for the small effect sizes and lack of replication often observed in genetic association studies. Additionally, in a substantial number of loci (∼10%), we find evidence that the direction of ASM varies between individuals. This observation suggests that non-cis effects such as genomic imprinting, complex trans-acting factors, or stochasticity are important in determining some instances of ASM. Such non-cis ASM poses a problem for genome-wide association studies (GWAS) and could explain the “missing heritability” associated with most common human diseases;35 it can render loci effectively hemizygous and dilutes or breaks allelic association. The current number of known imprinted human genes (i.e., between 40 and 50) is too low to account for the number of non-cis effects we see. Our data support the notion that parental-origin effects on gene function might be more widespread than traditionally believed,4 exemplified by the pattern of ASM we uncovered at SNP_A-1782879 (rs17427250), which is indicative of genomic imprinting. Finally, risk for complex disease is now recognized as resulting from interactions between both the genome and the environment,36 but the mechanism behind such gene by environment interplay is unknown. Increasing evidence suggests that epigenetic processes such as DNA methylation can be influenced by a range of external environmental factors, including diet, toxins, drugs, and stress.37 Our data, demonstrating that polymorphisms can exert an effect on gene function via epigenetic processes such as ASM occurring in cis, suggest a common pathway behind both genetic and environmental effects and a potential mechanism for gene by environment interaction. Our findings indicate that a comprehensive epigenetic analysis of candidate SNPs and haplotypes is warranted and that integrating genome-wide ASM screens into current GWA strategies will be a useful approach. The ASM data set produced in this study represents an essential first step toward this approach, and the web resource we have developed can be used by the GWA research community to aid in the interpretation of apparently nonfunctional sequence changes that are associated with disease.
To conclude, we performed a systematic screen of ASM across the genome with the aim of identifying previously unreported DMRs associated with either genomic imprinting or DNA sequence variation. We employed high-resolution microarrays and a novel analytical approach to quantitatively assess changes in RAS at ∼1 million SNPs following digestion with MSREs. Taken together, our data show that ASM is widespread (occurring at >35,000 sites across the genome) and likely to be associated with both parental-origin and cis effects on gene expression. Using RNA from the same blood samples, we were able to linearly correlate ASM with gene expression, and using a second source of DNA from each individual, we were able to identify several examples of tissue-specific ASM. Our data suggest that a spectrum of ASM is likely, with heterogeneity between individuals and across tissues. These findings impact our understanding about the origin of individual phenotypic differences and have implications for genetic studies of complex disease and phenotypic variation.
Supplemental Data
Supplemental Data include seven figures and four tables and can be found with this article online at http://www.ajhg.org.
Supplemental Data
Web Resources
The URLs for data presented herein are as follows:
Affymetrix Annotation Files, http://www.affymetrix.com/support/technical/annotationfilesmain.affx
BiQ Analyzer, http://biq-analyzer.bioinf.mpi-sb.mpg.de/
Galaxy, http://main.g2.bx.psu.edu/
Gene Expression Omnibus website, http://www.ncbi.nlm.nih.gov/geo/
Online data set used in this study, http://epigenetics.iop.kcl.ac.uk/ASM/
Online Mendelian Inheritance in Man (OMIM), http://www.ncbi.nlm.nih.gov/Omim/
Acknowledgments
This study was funded by a Royal Society Research Grant to J.M. The authors declare no conflict of interest.
References
- 1.Jaenisch R., Bird A. Epigenetic regulation of gene expression: how the genome integrates intrinsic and environmental signals. Nat. Genet. 2003;33(Suppl):245–254. doi: 10.1038/ng1089. [DOI] [PubMed] [Google Scholar]
- 2.Feinberg A.P. Phenotypic plasticity and the epigenetics of human disease. Nature. 2007;447:433–440. doi: 10.1038/nature05919. [DOI] [PubMed] [Google Scholar]
- 3.Mill J., Tang T., Kaminsky Z., Khare T., Yazdanpanah S., Bouchard L., Jia P., Assadzadeh A., Flanagan J., Schumacher A. Epigenomic profiling reveals DNA-methylation changes associated with major psychosis. Am. J. Hum. Genet. 2008;82:696–711. doi: 10.1016/j.ajhg.2008.01.008. [DOI] [PMC free article] [PubMed] [Google Scholar]
- 4.Luedi P.P., Dietrich F.S., Weidman J.R., Bosko J.M., Jirtle R.L., Hartemink A.J. Computational and experimental identification of novel human imprinted genes. Genome Res. 2007;17:1723–1730. doi: 10.1101/gr.6584707. [DOI] [PMC free article] [PubMed] [Google Scholar]
- 5.Sakatani T., Wei M., Katoh M., Okita C., Wada D., Mitsuya K., Meguro M., Ikeguchi M., Ito H., Tycko B., Oshimura M. Epigenetic heterogeneity at imprinted loci in normal populations. Biochem. Biophys. Res. Commun. 2001;283:1124–1130. doi: 10.1006/bbrc.2001.4916. [DOI] [PubMed] [Google Scholar]
- 6.Hashimshony T., Zhang J., Keshet I., Bustin M., Cedar H. The role of DNA methylation in setting up chromatin structure during development. Nat. Genet. 2003;34:187–192. doi: 10.1038/ng1158. [DOI] [PubMed] [Google Scholar]
- 7.Schilling E., El Chartouni C., Rehli M. Allele-specific DNA methylation in mouse strains is mainly determined by cis-acting sequences. Genome Res. 2009;19:2028–2035. doi: 10.1101/gr.095562.109. [DOI] [PMC free article] [PubMed] [Google Scholar]
- 8.Kerkel K., Spadola A., Yuan E., Kosek J., Jiang L., Hod E., Li K., Murty V.V., Schupf N., Vilain E. Genomic surveys by methylation-sensitive SNP analysis identify sequence-dependent allele-specific DNA methylation. Nat. Genet. 2008;40:904–908. doi: 10.1038/ng.174. [DOI] [PubMed] [Google Scholar]
- 9.Zhang Y., Rohde C., Reinhardt R., Voelcker-Rehage C., Jeltsch A. Non-imprinted allele-specific DNA methylation on human autosomes. Genome Biol. 2009;10:R138. doi: 10.1186/gb-2009-10-12-r138. [DOI] [PMC free article] [PubMed] [Google Scholar]
- 10.Storey J.D., Madeoy J., Strout J.L., Wurfel M., Ronald J., Akey J.M. Gene-expression variation within and among human populations. Am. J. Hum. Genet. 2007;80:502–509. doi: 10.1086/512017. [DOI] [PMC free article] [PubMed] [Google Scholar]
- 11.Lo H.S., Wang Z., Hu Y., Yang H.H., Gere S., Buetow K.H., Lee M.P. Allelic variation in gene expression is common in the human genome. Genome Res. 2003;13:1855–1862. doi: 10.1101/gr.1006603. [DOI] [PMC free article] [PubMed] [Google Scholar]
- 12.Gimelbrant A., Hutchinson J.N., Thompson B.R., Chess A. Widespread monoallelic expression on human autosomes. Science. 2007;318:1136–1140. doi: 10.1126/science.1148910. [DOI] [PubMed] [Google Scholar]
- 13.Zhang K., Li J.B., Gao Y., Egli D., Xie B., Deng J., Li Z., Lee J.H., Aach J., Leproust E.M. Digital RNA allelotyping reveals tissue-specific and allele-specific gene expression in human. Nat. Methods. 2009;6:613–618. doi: 10.1038/nmeth.1357. [DOI] [PMC free article] [PubMed] [Google Scholar]
- 14.Bray N.J., Buckland P.R., Owen M.J., O'Donovan M.C. Cis-acting variation in the expression of a high proportion of genes in human brain. Hum. Genet. 2003;113:149–153. doi: 10.1007/s00439-003-0956-y. [DOI] [PubMed] [Google Scholar]
- 15.Knight J.C. Allele-specific gene expression uncovered. Trends Genet. 2004;20:113–116. doi: 10.1016/j.tig.2004.01.001. [DOI] [PubMed] [Google Scholar]
- 16.Zhang Y., Rohde C., Tierling S., Jurkowski T.P., Bock C., Santacruz D., Ragozin S., Reinhardt R., Groth M., Walter J., Jeltsch A. DNA methylation analysis of chromosome 21 gene promoters at single base pair and single allele resolution. PLoS Genet. 2009;5:e1000438. doi: 10.1371/journal.pgen.1000438. [DOI] [PMC free article] [PubMed] [Google Scholar]
- 17.Yamada Y., Watanabe H., Miura F., Soejima H., Uchiyama M., Iwasaka T., Mukai T., Sakaki Y., Ito T. A comprehensive analysis of allelic methylation status of CpG islands on human chromosome 21q. Genome Res. 2004;14:247–266. doi: 10.1101/gr.1351604. [DOI] [PMC free article] [PubMed] [Google Scholar]
- 18.Milani L., Lundmark A., Nordlund J., Kiialainen A., Flaegstad T., Jonmundsson G., Kanerva J., Schmiegelow K., Gunderson K.L., Lönnerholm G., Syvänen A.C. Allele-specific gene expression patterns in primary leukemic cells reveal regulation of gene expression by CpG site methylation. Genome Res. 2009;19:1–11. doi: 10.1101/gr.083931.108. [DOI] [PMC free article] [PubMed] [Google Scholar]
- 19.Oliver B.R., Plomin R. Twins' Early Development Study (TEDS): a multivariate, longitudinal genetic investigation of language, cognition and behavior problems from childhood through adolescence. Twin Res. Hum. Genet. 2007;10:96–105. doi: 10.1375/twin.10.1.96. [DOI] [PubMed] [Google Scholar]
- 20.Freeman B., Smith N., Curtis C., Huckett L., Mill J., Craig I.W. DNA from buccal swabs recruited by mail: evaluation of storage effects on long-term stability and suitability for multiplex polymerase chain reaction genotyping. Behav. Genet. 2003;33:67–72. doi: 10.1023/a:1021055617738. [DOI] [PubMed] [Google Scholar]
- 21.Schumacher A., Kapranov P., Kaminsky Z., Flanagan J., Assadzadeh A., Yau P., Virtanen C., Winegarden N., Cheng J., Gingeras T., Petronis A. Microarray-based DNA methylation profiling: technology and applications. Nucleic Acids Res. 2006;34:528–542. doi: 10.1093/nar/gkj461. [DOI] [PMC free article] [PubMed] [Google Scholar]
- 22.Davis O.S., Plomin R., Schalkwyk L.C. The SNPMaP package for R: a framework for genome-wide association using DNA pooling on microarrays. Bioinformatics. 2009;25:281–283. doi: 10.1093/bioinformatics/btn587. [DOI] [PMC free article] [PubMed] [Google Scholar]
- 23.Meaburn E.L., Harlaar N., Craig I.W., Schalkwyk L.C., Plomin R. Quantitative trait locus association scan of early reading disability and ability using pooled DNA and 100K SNP microarrays in a sample of 5760 children. Mol. Psychiatry. 2008;13:729–740. doi: 10.1038/sj.mp.4002063. [DOI] [PubMed] [Google Scholar]
- 24.Kaminsky Z.A., Assadzadeh A., Flanagan J., Petronis A. Single nucleotide extension technology for quantitative site-specific evaluation of metC/C in GC-rich regions. Nucleic Acids Res. 2005;33:e95. doi: 10.1093/nar/gni094. [DOI] [PMC free article] [PubMed] [Google Scholar]
- 25.Bock C., Reither S., Mikeska T., Paulsen M., Walter J., Lengauer T. BiQ Analyzer: visualization and quality control for DNA methylation data from bisulfite sequencing. Bioinformatics. 2005;21:4067–4068. doi: 10.1093/bioinformatics/bti652. [DOI] [PubMed] [Google Scholar]
- 26.Meaburn E.L., Fernandes C., Craig I.W., Plomin R., Schalkwyk L.C. Assessing individual differences in genome-wide gene expression in human whole blood: reliability over four hours and stability over 10 months. Twin Res. Hum. Genet. 2009;12:372–380. doi: 10.1375/twin.12.4.372. [DOI] [PMC free article] [PubMed] [Google Scholar]
- 27.Edwards C.A., Ferguson-Smith A.C. Mechanisms regulating imprinted genes in clusters. Curr. Opin. Cell Biol. 2007;19:281–289. doi: 10.1016/j.ceb.2007.04.013. [DOI] [PubMed] [Google Scholar]
- 28.Engemann S., Strödicke M., Paulsen M., Franck O., Reinhardt R., Lane N., Reik W., Walter J. Sequence and functional comparison in the Beckwith-Wiedemann region: implications for a novel imprinting centre and extended imprinting. Hum. Mol. Genet. 2000;9:2691–2706. doi: 10.1093/hmg/9.18.2691. [DOI] [PubMed] [Google Scholar]
- 29.Francks C., Maegawa S., Lauren J., Abrahams B.S., Velayos-Baeza A., Medland S.E., Colella S., Groszer M., McAuley E.Z., Caffrey T.M. LRRTM1 on chromosome 2p12 is a maternally suppressed gene that is associated paternally with handedness and schizophrenia. Mol Psychiatry. 2007;12 doi: 10.1038/sj.mp.4002053. 1129–1139, 1057. [DOI] [PMC free article] [PubMed] [Google Scholar]
- 30.Reik W., Walter J. Genomic imprinting: parental influence on the genome. Nat. Rev. Genet. 2001;2:21–32. doi: 10.1038/35047554. [DOI] [PubMed] [Google Scholar]
- 31.Dimas A.S., Deutsch S., Stranger B.E., Montgomery S.B., Borel C., Attar-Cohen H., Ingle C., Beazley C., Arcelus M.G., Sekowska M. Common regulatory variation impacts gene expression in a cell type-dependent manner. Science. 2009;325:1246–1250. doi: 10.1126/science.1174148. [DOI] [PMC free article] [PubMed] [Google Scholar]
- 32.Chen H., Ye F., Zhang J., Lu W., Cheng Q., Xie X. Loss of OPCML expression and the correlation with CpG island methylation and LOH in ovarian serous carcinoma. Eur. J. Gynaecol. Oncol. 2007;28:464–467. [PubMed] [Google Scholar]
- 33.Ge B., Pokholok D.K., Kwan T., Grundberg E., Morcos L., Verlaan D.J., Le J., Koka V., Lam K.C., Gagné V. Global patterns of cis variation in human cells revealed by high-density allelic expression analysis. Nat. Genet. 2009;41:1216–1222. doi: 10.1038/ng.473. [DOI] [PubMed] [Google Scholar]
- 34.Sherman B.T., Huang da W., Tan Q., Guo Y., Bour S., Liu D., Stephens R., Baseler M.W., Lane H.C., Lempicki R.A. DAVID Knowledgebase: a gene-centered database integrating heterogeneous gene annotation resources to facilitate high-throughput gene functional analysis. BMC Bioinformatics. 2007;8:426. doi: 10.1186/1471-2105-8-426. [DOI] [PMC free article] [PubMed] [Google Scholar]
- 35.Manolio T.A., Collins F.S., Cox N.J., Goldstein D.B., Hindorff L.A., Hunter D.J., McCarthy M.I., Ramos E.M., Cardon L.R., Chakravarti A. Finding the missing heritability of complex diseases. Nature. 2009;461:747–753. doi: 10.1038/nature08494. [DOI] [PMC free article] [PubMed] [Google Scholar]
- 36.Caspi A., Sugden K., Moffitt T.E., Taylor A., Craig I.W., Harrington H., McClay J., Mill J., Martin J., Braithwaite A., Poulton R. Influence of life stress on depression: moderation by a polymorphism in the 5-HTT gene. Science. 2003;301:386–389. doi: 10.1126/science.1083968. [DOI] [PubMed] [Google Scholar]
- 37.Dolinoy D.C., Jirtle R.L. Environmental epigenomics in human health and disease. Environ. Mol. Mutagen. 2008;49:4–8. doi: 10.1002/em.20366. [DOI] [PubMed] [Google Scholar]
Associated Data
This section collects any data citations, data availability statements, or supplementary materials included in this article.