

Abstract
In blind, occipital cortex showed robust activation to nonvisual stimuli in many prior functional neuroimaging studies. The cognitive processes represented by these activations are not fully determined, although a verbal recognition memory role has been demonstrated. In congenitally blind and sighted (10 per group), we contrasted responses to a vibrotactile one‐back frequency retention task with 5‐s delays and a vibrotactile amplitude‐change task; both tasks involved the same vibration parameters. The one‐back paradigm required continuous updating for working memory (WM). Findings in both groups confirmed roles in WM for right hemisphere dorsolateral prefrontal (DLPFC) and dorsal/ventral attention components of posterior parietal cortex. Negative findings in bilateral ventrolateral prefrontal cortex suggested task performance without subvocalization. In bilateral occipital cortex, blind showed comparable positive responses to both tasks, whereas WM evoked large negative responses in sighted. Greater utilization of attention resources in blind were suggested as causing larger responses in dorsal and ventral attention systems, right DLPFC, and persistent responses across delays between trials in somatosensory and premotor cortex. In sighted, responses in somatosensory and premotor areas showed iterated peaks matched to stimulation trial intervals. The findings in occipital cortex of blind suggest that tactile activations do not represent cognitive operations for nonverbal WM task. However, these data suggest a role in sensory processing for tactile information in blind that parallels a similar contribution for visual stimuli in occipital cortex of sighted. Hum Brain Mapp, 2010. © 2010 Wiley‐Liss, Inc.
Keywords: human occipital cortex, magnetic resonance imaging, torelyuch
INTRODUCTION
In congenital/early blind (EB), nonvisual stimulation activates all parts of occipital cortex that have been identified with visual stimulation in normally sighted (NS) [Grill‐Spector and Malach, 2004; Tootell et al., 1996; Van Essen, 2004]. In NS, striate and immediately adjoining extrastriate cortex normally show minimal cross‐modal responsiveness except possibly during visual imagery of nonvisual stimuli. In contrast, several extrastriate areas are multisensory and provide supramodal, abstracted information regardless of input modality [Cattaneo et al., 2008; Pietrini et al., 2004]. In EB, tactile stimulation evokes responses in striate, extrastriate, and larger responses in multisensory extrastriate areas [Burton et al., 2004, 2006]. The cross‐modal activation in striate and lower tier extrastriate areas in blindness suggests functional reorganization [Burton, 2003; Burton and McLaren, 2008; Pascual‐Leone et al., 2005]; activity in multisensory extrastriate areas might indicate supramodal functions in the blind. However, a role for any occipital cortex activity in EB remains unclear despite evidence of a contribution to Braille literacy [Cohen et al., 1997, 1999; Hamilton et al., 2000].
One possibility is that occipital cortex activity in EB supports behavioral adaptations to blindness. For example, EB particularly rely on memory and augmented retention of verbal descriptions [Amedi et al., 2003], which results in adept serial recall of word lists [Raz et al., 2007]. These long‐term verbal recognition processes activate greater positive correlations between response magnitudes in left striate cortex and verbal recognition performance compared to verb generation [Amedi et al., 2003; Raz et al., 2005]. Furthermore, preferential left occipital cortex activation in verbal semantic and recognition tasks parallels left dominance for language in frontal cortex [Amedi et al., 2003].
Equally important for EB is short‐term working memory (WM) of tactile and auditory sensations when navigating the environment. In NS people, WM for visualized environments is crucial in spatial localization. Similarly, EB use spatial WM for touched objects to develop mental images of space [Vecchi, 1998; Vecchi et al., 2004] and spatial parameters of configuration and orientation of these objects. In EB, a tactile version of a spatial WM task activated the same dorsal extrastriate “visual” areas [Bonino et al., 2008] engaged in NS with similar spatial tactile and visual WM paradigms [Ricciardi et al., 2006]. Thus, EB tend to show utilization of the same “where” networks in the dorsal “visual” system for spatial WM engaged by sighted.
A primary aim of the present study was to determine whether a WM task involving tactile vibration stimulation selectively activated any occipital areas in EB. To disambiguate the study of WM processes, the current paradigm was nonverbal, stimuli were unidimensional, and required no tactile spatial processing. Furthermore, no haptic behavior was required because stimulation was passive with completely controlled parameters. A key control was using identical stimulation parameters for the WM and sensory detection tasks. Consequently, activation of striate cortex in EB during a bare essential task may elucidate the role of this cortex in tactile WM. Furthermore, results in multisensory extrastriate areas examine whether a simple tactile WM task is similarly processed by EB and NS in supramodal regions. The issue in extrastriate multisensory areas is whether a simple tactile WM task is sufficient to activate these regions.
A secondary goal was to ascertain whether prefrontal and parietal region contributions to WM and attention to memory (reviewed in Barch and Smith [ 2008], Cabeza and Nyberg [ 2000], Curtis and D'Esposito [ 2003], Duncan and Owen [ 2000], Jonides et al. [ 2008], and Wager and Smith [ 2003]) differed in EB compared to NS. We also examined sensory processing of tactile vibrations in somatosensory and premotor areas for possible group differences. Analyses in these different regions sought to determine whether known superior attention performance in EB [Collignon et al., 2006] might explain activity differences between groups. Better attentional performance in EB could account for better recall of tactile objects [D'Angiulli and Waraich, 2002], which might find neurophysiological expression in response differences in attention and somatosensory areas.
MATERIALS AND METHODS
Participants provided informed consent following guidelines approved by the Human Studies Committee of Washington University. Participants self‐reported no neurological conditions or head trauma, and no contraindication to MRI. Normal brain anatomy was confirmed with structural images. Twelve congenitally blind (Table I, six females; mean age = 41.3 years, SEM = 4.3) provided imaging and behavioral data. Two EB were excluded from imaging analyses due to concurrent inadequate task performance and head movements (Table I, cases Early 14 and 17) leaving 10 EB (five females; mean age = 39.1, SEM = 4.6). Ten NS (four females; mean age = 28.1, SEM = 2.0) provided comparable data.
Table I.
Early blind and normally sighted demographics
| ID number | Age | Sex | % RH | Reading hand | Wpm | Onset age | Light sense | Cause |
|---|---|---|---|---|---|---|---|---|
| Early 1 | 58 | F | 100 | Both | 145 | 0 | None | Retinopathy of prematurity |
| Early 2 | 57 | M | 100 | Left | 152 | 0 | None | Retinopathy of prematurity |
| Early 6 | 32 | M | 63 | Both | 76 | 0 | Some | Retrolental fibroplasia |
| Early 11 | 32 | M | 95 | Left | 58.7 | 0 | Some | Leber's congenital amaurosis |
| Early 14 | 63 | F | 91 | Both | 137 | 0 | Some | Genetic retinal pigmentation |
| Early 16 | 53 | F | 90 | Both | 185.8 | 0 | None | Retrolental fibroplasia |
| Early 17 | 54 | F | 100 | Both | 227.9 | 0 | Some | Retinopathy of prematurity |
| Early 18 | 54 | M | 72 | Both | NA | 0 | Some | Retrolental fibroplasia |
| Early 20 | 27 | F | 100 | Both | >120 | <1 | Some | Retinopathy of prematurity |
| Early 21 | 32 | F | 100 | Left | 104 | 0 | None | Retinoblastoma |
| Early 23 | 22 | M | 100 | Right | >120 | 0 | None | Retinopathy of prematurity |
| Early 24 | 24 | F | 100 | Left | >120 | 0 | None | Retinopathy of prematurity |
| Avg N12 | 42.33 | 92.58 | ||||||
| SEM | ±4.43 | 3.59 | ||||||
| Avg N10 | 39.10 | 92.00 | ||||||
| SEM | ±4.61 | 4.27 | ||||||
| Sighted 1 | 24 | M | 86 | |||||
| Sighted 2 | 26 | M | 92 | |||||
| Sighted 3 | 29 | M | 95 | |||||
| Sighted 4 | 26 | M | 100 | |||||
| Sighted 5 | 31 | M | 100 | |||||
| Sighted 6 | 45 | M | 92 | |||||
| Sighted 7 | 25 | F | 83 | |||||
| Sighted 8 | 25 | F | 0.08 | |||||
| Sighted 9 | 28 | F | 83 | |||||
| Sighted 10 | 22 | F | 100 | |||||
| Average | 28.10 | 83.11 | ||||||
| SEM | ±2.05 | ±9.47 |
Vibrotactile Stimulation Tasks
For each task, identically sequenced matched and balanced vibrotactile stimulation parameters were delivered to the right index fingertip with a MRI‐compatible vibrator [Burton et al., 2004]. Every trial included 1‐s vibration at a constant frequency followed by 5‐s with no stimulation during which participants made a task response. Vibration frequencies varied pseudorandomly from trial to trial, but were the same across tasks. Frequency and amplitude parameters used during imaging were determined for each participant in prior training sessions (Table II).
Table II.
Mean vibrotactile parameters by group
| Frequency one‐back task | ||||||||
|---|---|---|---|---|---|---|---|---|
| Freq | SEM | Min. | Max. | Amp. | SEM | Min. | Max. | |
| Group: EB | ||||||||
| F1 | 21.8 | 1.3 | 18 | 30 | 172.7 | 7.0 | 133 | 198 |
| F2 | 33.2 | 1.5 | 26 | 40 | 124.4 | 4.3 | 106 | 148 |
| F3 | 50 | 50 | 50 | 84 | 84 | 84 | ||
| F4 | 74 | 1.3 | 70 | 80 | 59 | 1.1 | 54 | 62 |
| F5 | 93.7 | 1.1 | 90 | 100 | 38.4 | 1.4 | 30 | 43 |
| Group: NS | ||||||||
| F1 | 22.4 | 0.8 | 20 | 26 | 167.7 | 4.6 | 148 | 181 |
| F2 | 33.8 | 0.9 | 30 | 38 | 122.5 | 2.3 | 111 | 133 |
| F3 | 50 | 50 | 50 | 84 | 84 | 84 | ||
| F4 | 70 | 0.6 | 68 | 73 | 61.8 | 0.4 | 60 | 64 |
| F5 | 90.7 | 1.0 | 86 | 96 | 42.2 | 1.3 | 35 | 48 |
| Ampitude‐change task | ||||||||
| Group: EB | Group: NS | |||||||
| Increase(μm) | SEM | Min. | Max. | Increase (μm) | SEM | Min. | Max. | |
| F1 | 307.9 | 11.2 | 237 | 344 | 291.6 | 5.0 | 266 | 310 |
| F2 | 241.3 | 12.1 | 184 | 290 | 217.5 | 7.7 | 180 | 252 |
| F3 | 142 | 7.5 | 128 | 200 | 129.7 | 1.5 | 122 | 135 |
| F4 | 102.2 | 5.4 | 85 | 143 | 96.1 | 1.3 | 89 | 101 |
| F5 | 68.7 | 2.5 | 62 | 85 | 66.6 | 2.4 | 52 | 80 |
| Decrease | SE | Min. | Max. | Decrease | SE | Min. | Max. | |
| F1 | 95.1 | 3.1 | 77 | 107 | 92.8 | 3.7 | 83 | 122 |
| F2 | 72.4 | 3.5 | 58 | 90 | 70.2 | 2.3 | 60 | 80 |
| F3 | 38.6 | 1.6 | 32 | 50 | 40 | 1.1 | 38 | 50 |
| F4 | 27.9 | 1.2 | 23 | 35 | 30.7 | 0.5 | 29 | 34 |
| F5 | 18.7 | 0.6 | 15 | 21 | 20.3 | 0.4 | 19 | 23 |
Six successive trials were presented during a ∼32‐s block with stimulation ON followed by a 24‐s block with stimulation OFF (Fig. 1A). Each of eight runs contained five ON/OFF blocks; four runs were devoted to each task.
Figure 1.
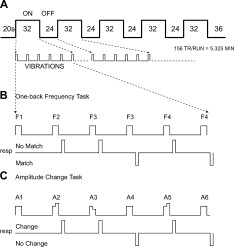
Timing for image sequences and task paradigms. A. Six sequential vibration stimulation trials were presented during 32‐s ON cycles followed by 24‐s OFF cycles. Each On and 20 s during the following OFF cycle was analyzed as a single epoch. Five On/Off cycles were presented during each ∼5.3 min run. B. One‐back vibration frequency task. The question for the one‐back task was whether the frequency in two successive trials matched. C. Amplitude‐change task. A baseline vibration amplitude was maintained (A1, A4, or A6), increased (A2 or A5), or decreased (A3) during an On cycle. The question for the amplitude‐change task was whether vibration amplitude changed during a trial. A button response was required for stimulation trials 2–6. The trial 1 stimulation was attended but not responded to. The button pressed with the middle finger meant “yes” and with the index finger indicated “no” for the questions posed by each task.
The one‐back (WM) task involved deciding whether vibration frequencies matched between the current and prior trial (Fig. 1B; F2 vs. F1 or F3 vs. F3). Matches had a 50% probability. Vibration amplitudes were constant throughout a trial and set to approximate equal intensity sensations [Sinclair and Burton, 1996] across presented frequencies (Table II).
The amplitude‐change (A‐C) task involved detecting whether vibration amplitude persisted or changed during a trial. Changes in amplitude occurred after 0.5 s of stimulation. Equally probable trial types involved constant amplitude (Fig. 1C; A1, A4 or A6) and two amplitudes with an equal number of trials presenting amplitude increases or decreases (Fig. 1C; A2 or A5, A3). Trial types and presented frequencies were pseudorandomized. Applied frequency was irrelevant when detecting amplitude changes.
Participants responded on trials two through six by pressing buttons on a fiberoptic response pad. The question for the WM task was whether the frequency in two successive trials matched. The question for the A‐C task was whether vibration amplitude changed during a trial. For each task the button pressed with the middle finger meant “yes” the frequencies matched or “yes” amplitudes changed; and the button pushed with the index finger indicated “no” matched frequencies or “no” amplitude change. Responses were recorded by software that controlled stimulation timing, which was synchronized to brain volume image acquisitions.
Task difficulty was assessed using trials with hard or more easily discriminated differences. Larger frequency or amplitude differences were easier to discriminate. The frequency or amplitude differences used to assess difficulty were individually specified from prior psychophysical testing in each participant.
Each run exclusively involved one task and difficulty level. Tasks alternated on successive runs, and difficulty levels were switched after each pair of runs, yielding two runs for each task‐difficulty presentation. Task and difficulty level was announced prior to each run.
Image Acquisition, Preprocessing, and Atlas Registration
A vacuum cushion stabilized head position inside a twelve‐element RF head matrix coil. A blindfold covered all participant eyes, but did not completely obscure room lights for NS. Room lights were turned off and all participants closed their eyes during functional scans.
Structural images were acquired from sagittal T1‐weighted magnetization prepared rapid gradient echo (MP‐RAGE) scans (repetition time [TR] = 2,100 ms; echo time [TE] = 3.93 ms; flip angle = 7°; inversion time [TI] = 1,000 ms; resolution = 1 × 1 × 1.25 mm3). Additional T2‐weighted structural images were acquired in‐register with echo‐planar sequence images (EPI) to facilitate aligning functional images to atlas space (TR = 8,430 ms, TE = 98 ms, resolution = 1.33 × 1.33 × 3 mm3).
Functional images based on blood oxygenation level‐dependent (BOLD) contrast responses [Kwong et al., 1992; Ogawa et al., 1990] were acquired using T2* echo‐planar images (EPI) in Siemens 3T scanners (Erlangen, Germany). NS were scanned in an Allegra using a custom, single‐shot asymmetric spin‐echo EPI (TE = 25 ms); EB were scanned in a Trio using a gradient recalled EPI with triple mode sequencing (TE = 27 ms). TR was 2.05 s and flip angle was 90° for both scanners.1 Whole brain coverage was obtained across 32 contiguous, interleaved, bicommissurally aligned axial slices, and 4‐mm3 isotropic voxels.
Locally developed software was used for image preprocessing2 (1) to correct for head motion within and across scans, (2) to adjust for intensity differences due to interleaved slice acquisition, (3) to normalize global mean signal intensity across EPI runs to mode 1000, (4) to compensate for slice‐dependent time shifts using sync interpolation, and (4) to align EPI images to a template [Buckner et al., 2004] that conforms to Talairach and Tournoux atlas space [Talairach and Tournoux, 1988] based on spatial normalization procedures [Lancaster et al., 1995]. Atlas alignment was through 12 parameter affine transformation that linked the first image volume of each EPI run (averaged over all runs after cross‐run realignment) to MP‐RAGE structural images [Burton et al., 2006; Ojemann et al., 1997]. Atlas transformed images were resampled to 2‐mm3 isotropic voxels and spatially smoothed using a 2‐voxel Gaussian kernel (4‐mm FWHM).
Statistical Analyses
A general linear model (GLM) was computed per participant to obtain per voxel estimates of percent MR signal change relative to baseline over the time course for each epoch‐type (i.e., block of six trials for one‐back or A‐C tasks) [Friston et al., 1995, 1998; Miezin et al., 2000]. Initial frames in each run were excluded to achieve magnetization stabilization. BOLD responses were estimated for single long duration epochs (26 frames) that began with 16 frames during six trials of stimulation (ON cycles) and continued into ten frames with no stimulation (OFF cycles; Fig. 1A).3 The GLM included terms for 26 time points for each epoch‐type, a baseline intercept signal, linear trend in MR signal across concatenated runs, and a temporal high‐pass filter (0.014 Hz).
Response magnitudes per epoch‐type were computed by cross‐correlating BOLD responses per voxel with a 26 frame boxcar function. The boxcar function was modeled as a 2 s delayed gamma function for the hemodynamic response [Boynton et al., 1996]. T‐statistics were computed from fitting BOLD and hemodynamic responses4 [Friston et al., 1995; Zarahn et al., 1997] and then transforming to normally distributed z‐scores. Individual volumetric z‐score statistical maps were created in Talairach atlas coordinates [Talairach and Tournoux, 1988].
Difficulty levels were assessed using a repeated‐measure, mixed‐effects ANOVA on whole‐brain volumetric group data. Experimental factors were difficulty (two levels), time (26 frames), and time by difficulty. Participants were treated as a random factor. The dependent variable was percent MR signal change per epoch‐type from each participant. Computed F‐ratios were converted to z‐scores whose degrees of freedom were adjusted for covariance (sphericity correction) and thresholded for significance at P = 0.05 with z = 3.5 and cluster‐size of 24 contiguous voxels using a Monte‐Carlo simulation to correct for multiple comparisons [Forman et al., 1995].
Contrasts between tasks and groups were analyzed after registering volumetric data to a standard cortical surface atlas [Van Essen, 2005]. Registration first involved generating cortical surfaces per hemisphere in each individual [Van Essen, 2005; Van Essen et al., 2001].5 Next, the participant‐specific spherical surface for a hemisphere was aligned to the atlas average spherical coordinate space (PALS‐B12 atlas). Alignments between participant and atlas hemispheres were based on the coordinates for six anatomical landmarks individually identified in a hemisphere [Van Essen, 2005]. Mapping matrices created through deploying a spherical deformation algorithm were subsequently used to register data between surfaces.
Group t‐maps were computed after registering volumetric z‐scores to the surface nodes of the PALS‐B12 atlas. The distribution of cortical activity per task for each group was determined by averaging the uncorrected F‐statistic z‐scores per PALS‐B12 atlas node. A t‐test assessed whether average z‐scores significantly differed from a z‐score population mean of zero [Bosch, 2000].
Time‐course analysis relied on data extracted from previously defined regions of interest (ROI) [Burton et al., 2008a, b].6 Table III lists centers of mass coordinates for all defined ROI. Each ROI contains a unique population of surface nodes. Time‐course data registered to all nodes within an ROI for each participant were extracted and averaged across the nodes. A separate average was computed at each time interval per epoch. Consequently, each participant contributed a single average time course per epoch‐type for each ROI. These selected ROI averages per participant were the dependent values in subsequent statistics. A repeated‐measures, random‐effects MANOVA (PROC GLM, Statistical Analysis System version 9.1, SAS Institute, Carey, NC) of time‐course data was computed per ROI for task or group contrasts. The repeats were based on the number of imaging runs per task7, and participants were treated as a random factor. We contrasted tasks for each group (WM vs. A‐C) and compared groups for each task (EB vs. NS) based on the P values of the exact F‐statistic from Wilks' Lambda. All cited P values for task and group contrasts were multiple comparisons corrected for 11 ROI per hemisphere.
Table III.
Region coordinates for defined regions of interest
| Region | ROI | Area | X | Y | Z | Area | X | Y | Z | |
|---|---|---|---|---|---|---|---|---|---|---|
| Frontal | DLPFC | A | 1,345.8 | −36.7 | 37.4 | 20.1 | 1,774.0 | 35.0 | 32.8 | 28.7 |
| PMv | B | 1707.6 | −43.5 | −1.0 | 35.4 | |||||
| PMd | C | 462.9 | 15.6 | −1.6 | 62.3 | |||||
| Parietal | PCG | D | 798.5 | −48.2 | −31.0 | 41.8 | 1,605.7 | 35.0 | −28.9 | 54.2 |
| OP 1 | E | 438.2 | −52.3 | −27.4 | 19.2 | 352.6 | 48.2 | −25.2 | 22.2 | |
| IPS anterior | F | 704.2 | −43.9 | −51.5 | 41.9 | 501.0 | 40.1 | −46.8 | 45.1 | |
| IPS posterior | G | 598.7 | −28.2 | −61.9 | 46.4 | 858.2 | 25.2 | −60.2 | 49.8 | |
| BA 40 | H | 688.1 | −56.1 | −42.6 | 28.2 | 941.9 | 53.4 | −38.6 | 35.5 | |
| Occipital | V1 | I | 1,051.8 | −6.9 | −83.7 | 2.0 | 1,050.6 | 9.1 | −79.5 | 6.5 |
| V2 | J | 780.0 | −7.3 | −81.6 | 0.3 | 592.3 | 7.6 | −82.2 | 6.0 | |
| V3+V3A+V7 | K | 597.0 | −18.8 | −83.9 | 26.1 | 782.9 | 18.4 | −84.6 | 27.2 | |
| LOC+MT+ | L | 469.5 | −40.0 | −80.1 | −3.3 | 686.4 | 37.9 | −80.3 | 1.0 |
DLPFC, dorsolateral prefrontal cortex; PMd and PMv, dorsal and ventral premotor areas; PCG, postcentral gyrus; OP 1, parietal operculum division 1; IPS, intraparietal sulcal cortex; BA 40, Brodmann area 40; V1, V2, V3, V3A, V7, visual areas; LOC, lateral occipital complex; MT+, middle temporal area.
RESULTS
Task Performance During Imaging
Task performance was better on the A‐C task in both groups. Thus, accuracy was greater and reaction times faster during the A‐C compared to the WM task (Table IV). A two‐way ANOVA of these data found no significant interaction factor of task by group (F = 2.16, df = 1/156, P = 0.14), indicating that the tasks had the same effect on both groups. Furthermore, reaction times on each of the tasks did not differ significantly between groups. Accuracy was also significantly higher on the easy compared to the more difficult trials, but reaction times did not differ with difficulty in each group (Table IV). A two‐way ANOVA for the interaction of difficulty by group was not significant (F = 2.43, df: 1/156, P = 0.12), indicating each group was similarly affected by the two difficulty levels.
Table IV.
Accuracy and reaction times by task and difficulty obtained during imaging
| Group | Task | % Correct | SEM | t‐value, df, P | RT | SEM | t‐value, df, P |
|---|---|---|---|---|---|---|---|
| EB | Amp. | 90.53 | 1.5 | 988.2 | 107.5 | ||
| Freq. | 81.6 | 1.6 | 4, 78, 0.0002 | 1,100.1 | 122.9 | −3.24, 1,998, 0.0012 | |
| NS | Amp. | 88.9 | 1.3 | 800.5 | 94 | ||
| Freq. | 84.2 | 1.3 | 2.5, 78, 0.013 | 888 | 107.9 | −3.1, 1,998, 0.002 | |
| Group | Difficulty | Avg % correct | SEM | t‐value, df, P | Avg RT | SEM | t‐value, df, P |
| EB | Easy | 90.6 | 1.32 | 1,025.2 | 24.3 | ||
| Hard | 81.6 | 1.8 | 4.01, 78, 0.0001 | 972.6 | 21.9 | 1.6, 1,998, 0.11 | |
| NS | Easy | 88.8 | 1.2 | 856 | 20.4 | ||
| Hard | 84.3 | 1.4 | 2.46, 78, 0.016 | 792.8 | 20.2 | 0.82, 1,998, 0.41 |
Group and Task t‐Maps
Overall, in both groups, the two tasks activated comparable bilateral areas in frontal (medial, dorsolateral prefrontal, precentral gyral), insula and parietal cortex (postcentral gyrus, parietal operculum, inferior supramarginal gyrus) (see Fig. 2). Activation in the superior parietal lobule (BA7) was more extensive in posterior IPS of EB individuals (see Fig. 2). The tasks particularly affected occipital cortex in EB; significant activity occurred in medial striate (BA 17), adjacent extrastriate (BA 18, cuneus and lingual gyri), superior occipital/parietal, and middle occipital/temporal cortex (BA 19). In reference to defined visual areas in NS, EB showed activity in V1, V2, VP, V3, V3a, V7, and LOC/MT+. Ventral occipital/temporal cortex along the fusiform gyrus was minimally activated.
Figure 2.
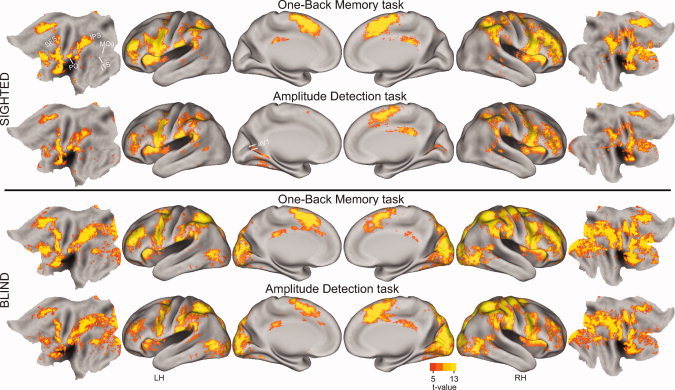
Group t‐maps for each group and task were computed after registering volumetric uncorrected F‐statistic z‐scores to the surface nodes of the inflated and flattened average PALS‐B12 surfaces [Van Essen, 2005; Van Essen and Dierker, 2007]. The distribution of cortical activity per task for each group was determined by averaging the z‐scores per PALS‐B12 atlas node. A t‐test assessed whether average z‐scores per node significantly differed from a z‐score population mean of zero [Bosch, 2000]. Scale shows t‐values for 9 df per node (P values 0.0007–0.0001). IT, inferior temporal cortex; ITS, inferior temporal sulcus; IPS, intraparietal sulcus; MOg, middle occipital gyrus; PH, parahippocampal gyrus; PO, parietal operculum; PCG, postcentral gyrus; SFS, superior frontal sulcus.
Figure 3 shows the ROI with significant response contrasts between groups or tasks in the activated cortex. Both tasks evoked significant BOLD responses across imaging frames 6–22; responses were positive in all but occipital cortex ROI of NS. Average percent MR signal changes from the central frames 8–16 were used in all analyses (Figs. 4, 5, 6).
Figure 3.
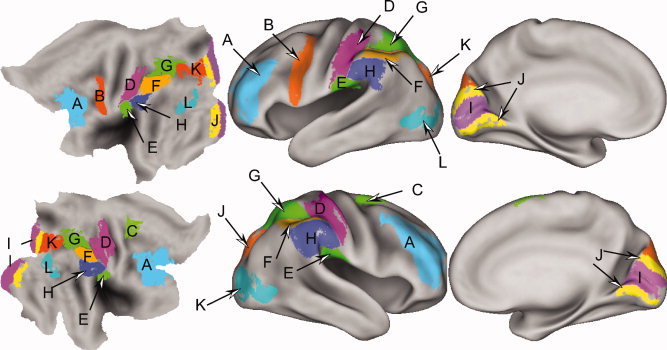
Regions of interest (ROI) indicated on average PALS‐B12 flattened and inflated surfaces. Each ROI contains a unique population of surface nodes. Cortical regions were previously defined and included Brodmann areas [Drury et al., 1999; Van Essen, 2005], parietal opercular subdivisions [Burton et al., 2008a; Eickhoff et al., 2006], selected functional partitions of several Brodmann areas [Burton et al., 2008b], and occipital cortex visuotopic subdivisions [Van Essen, 2005; Van Essen and Dierker, 2007]. Letter tags are identified in Table III.
Figure 4.
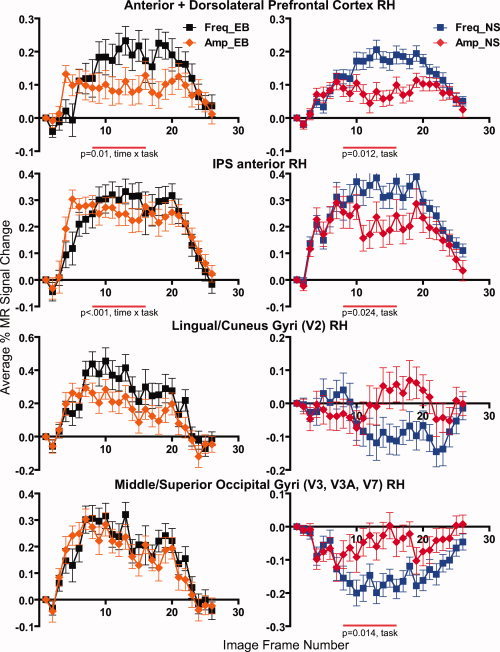
Response time courses during the working memory (Freq) and amplitude‐change (Amp) tasks from defined right hemisphere (RH) ROI in early blind (EB) and normally sighted (NS). Data points show mean and standard error of the mean (SEM) from 10 participants per group. Significant P values for main effects or interactions are shown below graphs.
Figure 5.
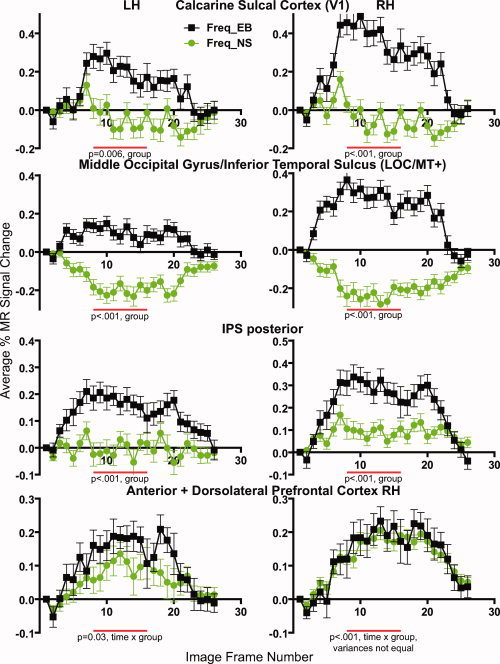
Response time courses during the working memory task (Freq) from defined ROI in both hemispheres and from early blind (EB) and normally sighted (NS). Data points show mean and standard error of the mean (SEM) from 10 participants per group.
Figure 6.
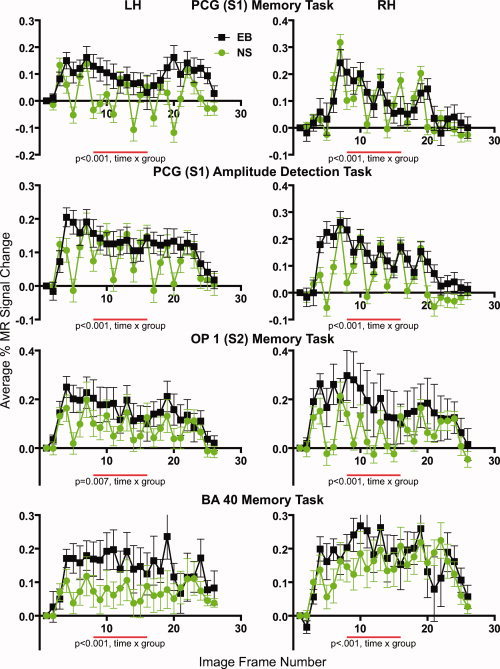
Response time courses during the working memory and amplitude‐change detection tasks from selected parietal cortex ROI in both hemispheres and from early blind (EB) and normally sighted (NS). Data points show mean and standard error of the mean (SEM) from 10 participants per group. PCG, postcentral gyrus; OP 1, parietal operculum subdivision 1; BA 40, Brodmann area 40.
Effect of Task Difficulty
Data across difficulty levels were combined in all analyses, because there were no regional differences in cortical activity related to task difficulty. Thus, neither volumetric ANOVA analyses nor surface‐based statistical maps showed differences between easy and hard tasks for either task or group.
Task Contrasts
Prefrontal cortex
In the right dorsolateral prefrontal cortex (DLPFC), responses during the WM task were significantly larger in both groups (see Fig. 4). In NS, larger responses during the WM task probably accounted for a significant main effect of task (P = 0.012). In EB, the significant factor was the interaction term of time by task (P = 0.01), which suggests that the shape of the response time course differed between tasks. Possibly in EB response magnitude differences between tasks varied with time and only some image frames had larger responses during the WM task. These task related response differences in right DLPFC might have reflected differences in the way participants solved the two tasks; the latter interpretation is suggested by a significant participant factor in the MANOVA (P < 0.001). Both groups showed no differences in the left hemisphere DLPFC, because responses during both tasks completely overlapped (not shown).
Intraparietal sulcal cortex
In anterior IPS on the right, the WM task evoked larger responses in both groups (see Fig. 4). In NS, these larger responses led to a significant main effect for task (P = 0.024). In EB, there was a significant time by task effect (P < 0.001) (see Fig. 4), which suggests waveform shape differences possibly resulting from larger responses during the WM task only during some frames. Only EB showed similar significant effects in posterior IPS (not shown). Both groups showed no significant task response differences in left hemisphere IPS regions (not shown).
Occipital cortex
In EB, striate and all studied extrastriate cortex ROI had comparable overlapping positive responses during both tasks (see Fig. 4).
Responses in NS were more varied. The WM task evoked negative BOLD responses bilaterally; the A‐C task evoked small positive or variable size negative responses depending on the occipital ROI (Fig. 4). WM task responses in striate and other lower tier visual ROI were less negative (Fig. 4, lingual/cuneus gyri); in higher tier extrastriate visual ROI these responses were more negative and sustained (Fig. 4, middle/superior occipital gyri). Task contrasts in lower tier visual areas were not significant in NS, possibly because variances were large and response magnitudes were minimally different despite polarity distinctions. In higher tier visual areas, both tasks evoked negative responses bilaterally. For example, in the middle/superior occipital gyri associated with V3, V3A, and V7, larger negative responses during the WM task resulted in a main effect for task bilaterally in NS. Figure 4 shows these results from the right hemisphere (Fig. 4, P = 0.014); on the left the main effect had P < 0.001. In the more ventral occipital region near the middle occipital gyrus/inferior temporal sulcus that is associated with LOC/MT+, negative responses were generally larger during the WM task, which resulted in a significant main effect of task on the left (P < 0.001). Negative responses from LOC/MT+ in NS are shown in Figure 5.
Group Contrasts
Occipital cortex
The WM task in EB and NS evoked opposing response polarities that resulted in a main effect of group bilaterally with most P values <0.01. Figure 5 shows examples of these differences in V1 and LOC/MT+.
The group contrasts for the A‐C task were more varied because in NS different ROI showed small positive, baseline, or small negative responses, whereas EB showed positive responses in all occipital ROI. On the right larger positive responses in EB compared to NS yielded a significant main effect of group in calcarine sulcal cortex, V1 (P = 0.018), lingual/cuneus gyri, V2 (P = 0.01), and higher tier ROI (P < 0.001). On the left more variable and reduced magnitude positive responses in EB compared to near baseline activity in NS resulted in no significant group effect in V1, a significant time by group effect in V2 (P = 0.0055), and in both tested higher tier visual ROI (P < 0.001).
Intraparietal sulcal cortex
EB had significantly larger responses than NS during each task in the posterior IPS ROI (see Fig. 5). These group magnitude differences were significant (for the WM task, P < 0.001 bilaterally; for the A‐C task on the right, P < 0.001; and on the left, P = 0.0033).
In anterior IPS, EB had more sustained responses compared to small repeating peaks in NS (not shown). The response peaks were less evident than those observed in the somatosensory regions (see below). These response shape differences resulted in significant time by group effects (WM task P < 0.001 on the right and P = 0.055 on the left; A‐C task P < 0.001 on the right).
Prefrontal cortex
The groups showed significant response differences in DLPFC only during the WM task. In EB larger magnitudes and varied shapes resulted in significant time by group effects bilaterally (see Fig. 5). However, on the right, the presence of unequal variances (from test for sphericity) make the significant parametric time by group effect questionable.
Parietal cortex
NS had responses with multiple positive peaks and prominent following troughs (see Fig. 6). EB had more sustained responses with any peaks followed by shallow troughs (see Fig. 6). The ∼6 peaks in the left ROI tracked stimulation trial timing; the ∼5 peaks in the right ROI followed button presses. Peaks were more evident in responses from the PCG (S1) and OP 1 (S2) compared to BA 40. The different response shapes resulted in significant time by group effects bilaterally for both tasks (see Fig. 6).
Premotor cortex
The right PMd showed significantly different sustained responses in EB compared to repeating small peaks in NS during the WM task (P = 0.044) (similar to RH OP1 in Fig. 6). During the amplitude task EB had significantly larger responses than NS (P = 0.001). In this instance EB showed a steady positive response, whereas those in NS hovered near baseline. In left PMv EB had more sustained responses compared to small peaks and shallow troughs in NS (WM, P = 0.0044; amplitude, P < 0.001) (similar to LH OP1 in Fig. 6). Response shape differences in premotor cortex resulted in significant time by group effects.
DISCUSSION
Activity in Occipital Cortex
These findings confirm reports that tactile stimulation activates all lower tier “visual” areas in EB [Burton et al., 2004, 2006; Gizewski et al., 2003; Kujala et al., 1995; Ptito et al., 2005; Röder et al., 1996; Sadato et al., 1996, 2002; Sathian, 2005; Stilla and Sathian, 2008; Uhl et al., 1991]. However, neither striate nor lower tier extrastriate (e.g., V2, VP, etc.) cortex activity differed between WM and vibration A‐C tasks. In contrast, prior reports indicated greater left striate cortex activity in EB during long‐term verbal recognition [Amedi et al., 2003], episodic verbal memory [Raz et al., 2005], or word recall in semantic tasks [Burton et al., 2002a, b, 2003]. Thus, striate and lower tier extrastriate regions similarly showed no preferential role for tactile WM. In the current study, the absence of response differences between tasks possibly occurred because verbal mnemonics were not utilized. The absence of activity in left ventrolateral prefrontal language areas may have reflected the latter. Alternatively, striate cortex in EB only contributes to long‐term memory processes occurring over several minutes rather than seconds. Currently under study is whether a nonverbal, longer‐term tactile recognition task preferentially activates striate cortex in EB.
Prior studies with EB and NS reported that a more dorsal extrastriate occipito‐parietal region overlying the posterior end of the intraparietal sulcus may be specialized for spatial processes involving visual and tactile spatial WM [Bonino et al., 2008; Ricciardi et al., 2006] and/or a variety of spatial parameters [Prather et al., 2004; Stilla et al., 2007; Zangaladze et al., 1999; Zhang et al., 2005]. The current WM paradigm did not support the notion of a nonspatial tactile WM role for this extrastriate region in either group. Indeed, NS showed suppressed activity in this occipito‐parietal region. The current findings possibly arose because the tasks did not involve visual‐type spatial parameters similar to those previously studied in EB and NS [Bonino et al., 2008; Ricciardi et al., 2006; Vecchi, 1998; Vecchi et al., 1995]. These data in EB suggest a general reorganization of this dorsal extrastriate region toward any tactile input as opposed to a novel role in tactile short‐term WM. Alternatively, the findings of a spatial tactile WM role in prior studies were confounded by haptic exploration of tactile objects and the absence of a contrasting non‐WM task based on identical parameters.
The lateral occipital complex (LOC) is another multisensory extrastriate region [Hasson et al., 2002, 2003; Stilla and Sathian, 2008; Yovel and Kanwisher, 2004] associated with the “what” pathway for visual and tactile object recognition [Hasson et al., 2002; Ungerleider and Haxby, 1994]. Prior findings showed that LOC responds during identification of two‐ and three‐dimensional tactile objects/shapes [Amedi et al., 2001, 2002, 2005; James et al., 2002; Pietrini et al., 2004; Prather et al., 2004; Stilla and Sathian, 2008; Stoesz et al., 2003]. The vibrotactile stimuli used in the current tasks lacked the multiple dimensions of objects. Yet, both tasks activated LOC in EB and suppressed responses in NS. Responses were larger on the right in EB. The findings in EB again indicate that the LOC multisensory area processes tactile inputs in general as opposed to some supramodal representation of object category.
The human middle temporal area (hMT+) is a third “visual” multisensory, supramodal region in NS that is thought to extract information about stimulus flow irrespective of whether the motion is across the skin [Burton et al., 2006; Hagen et al., 2002; Ricciardi et al., 2007] or retina [Jiang et al., 1994; Reppas et al., 1997; Tootell et al., 1995]. The vibrotactile stimuli used in the current tasks did not move across the skin. However, as in the other multisensory extrastriate regions, both tasks activated MT+ in EB and suppressed responses in NS. These findings again indicate adaptive, generalized processing of tactile information in EB.
NS showed response suppression in most extrastriate regions. Response suppression has been described previously in a sensory cortical region when attention was directed to a modality different from that normally served by that area of cortex [e.g., Drevets et al., 1995; Gusnard and Raichle, 2001; Haxby et al., 1994; Weaver and Stevens, 2007]. An example of this effect was suppressed activity in visual cortex in NS when they attended the tactile stimuli in both tasks. Greater response suppression occurred during the WM task, which also evoked larger responses in parietal cortex attention areas (see below). Possibly greater visual cortex suppression during WM reflected more resource allocation to touch during this task.
Dorsolateral Frontal Cortex and WM
Both groups showed greater activity in right DLPFC during the WM task, which confirmed a crucial role for DLPFC in WM (reviewed in Curtis and D'Esposito [ 2003], Jonides et al. [ 2008], Petrides [ 2000], Wager and Smith [ 2003], and Zimmer [ 2008]). Response differences in DLPFC possibly indicated distinctions in the types and extent of simple storage and executive processing required by the two tasks. The WM task involved continuous updating of stimulus frequency, which is one of several executive processes engaged by WM [Wager and Smith, 2003]. Continuous updating incorporated encoding a prior vibration frequency, maintaining a representation of the frequency through a 5‐s delay, manipulating the perception of a probe vibration frequency in the next trial against a stored/coded representation of a prior vibration, and then attending to determine whether the stored representation matched the probe vibration frequency in the next trial. In contrast, detecting amplitude change involved an immediate and unitary sensation in a single trial. There was no extended delay interval for remembering vibration amplitudes; there was no updating of any short‐term memory representation of amplitude between trials. Thus, smaller responses in DLPFC during the A‐C task possibly engaged fewer and less complicated cognitive operations.
Attention Effects
EB showed greater activation of prefrontal and parietal regions during the WM task. Thus, during the WM task, EB had larger responses than NS in the right DLPFC, superior bank of IPS, anterior bank of IPS, and more sustained responses in frontal premotor areas (see below). These response differences point to the possibility of greater “attention to memory” effects in EB compared to NS people. This notion is consistent with superior attention performance in EB [Collignon et al., 2006]. Additionally, attention may be enhanced in EB by a posterior shift to occipital cortex of top–down attention processes [Kujala et al., 2000]. Both IPS regions and frontal premotor areas are components of the dorsal attention system [Corbetta and Shulman, 2002; Corbetta et al., 2008; Fox et al., 2006]. Thus, superior attention in EB possibly was responsible for larger and more persistent responses during the WM task in frontal–parietal memory and attention regions. Such response enhancements are characteristic in somatosensory cortex when NS attend tactile stimulation [Burton et al., 1999, 2008b; Burton and Sinclair, 2000].
Larger responses and greater spatial extent of activity during the WM task in components of the dorsal and ventral attention systems [Corbetta and Shulman, 2002; Corbetta et al., 2008; Fox et al., 2006] in intraparietal sulcal and ventral supramarginal cortex, respectively, are consistent with a linkage of this cortex to enhanced activity in DLPFC [Curtis and D'Esposito, 2003]. Thus, posterior parietal cortex shows enhanced responses during working, long‐term, and episodic memory processes (reviewed in Buckner and Wheeler [ 2001], Cabeza [ 2008], and Cabeza et al. [ 2008]). Larger responses in EB might have facilitated “attention to memory” [Cabeza et al., 2008; Ciaramelli et al., 2008; Olson and Berryhill, 2009] of vibration frequency. Responses in the same cortical location during the A‐C task might reflect attention to the attribute of amplitude change [Corbetta and Shulman, 2002]. However, smaller responses in posterior parietal cortex during amplitude change probably were due to lower attention demands when detecting changes in vibration amplitude [Whang et al., 1991].
Similarly, EB showed enhanced responses during the WM task in primary and secondary somatosensory areas of PCG and OP 1, respectively. The principal distinction was repeated peaks in the responses from NS compared to relatively sustained responses in EB. The peaked responses more faithfully followed the six vibration trials on the left and stimulation from five button presses on the right; and the sustained responses bridged delays between stimulation trials. Parts of premotor cortex showed similar response shape differences between groups. There were fewer group differences during the A‐C task, which might have reflected the need for fewer attention resources when detecting changes in tactile stimulation [Sathian and Burton, 1991; Whang et al., 1991]. Whether learned skills at allocating more attention to tactile sensory processing in EB were responsible for more sustained responses is a question for further study.
CONCLUSIONS
The current results showed no disproportionate utilization of any part of occipital cortex in EB for vibrotactile WM. The vibrotactile stimuli lacked verbal, spatial, dimensional, and motion parameters and yet overwhelmingly activated several multisensory, supramodal occipital regions previously studied using more diverse tactile parameters. Most parsimoniously, occipital cortex in EB has a significant role in tactile sensory processing irrespective of its cognitive context. Consequently, temporary [Cohen et al., 1997, 1999] or permanent [Hamilton et al., 2000] lesions of occipital cortex in EB might disrupt tactile sensory processing and in so doing cause Braille agnosia. In NS, similar occipital cortex lesions would interrupt visual processing and thereby disrupt reading text. Because the tactile tasks lacked a verbal component, the present study does not discount prior evidence of blindness induced adaptations for word recognition memory in left striate cortex. Similarly, because the vibrotactile stimuli did not involve spatial or multidimensional object parameters, this study does not argue against a supramodal role for multisensory extrastriate regions in spatial or object cognition. However, deserving further scrutiny is persistent evidence of larger right occipital responses to tactile stimulation; particularly puzzling was activity ipsilateral to the stimulated hand. Additionally, other studies have shown that EB have learned skills for superior attentional performance. The larger responses in frontal and parietal regions particularly involved in “attention to memory” possibly resulted from these attention skills in EB. Better attention to tactile inputs might also underlie the sustained delay‐interval activity between stimulation trials in somatosensory and premotor cortex in EB participants.
Footnotes
Despite collecting data with two different 3T scanners, examples of overlapping response time courses and magnitudes showed comparable images in both groups (e.g., Figs. 5 and 6).
Trials within an ON cycle were separated by 5‐s interval, which was previously determined to be an optimal interval for studying short‐term vibrotactile memory [Sinclair and Burton, 1996]. However, the delayed nature of BOLD response recovery to baseline is longer than 5 s, which compromised modeling responses per trial. Consequently, multiple trials across a single ON cycle were modeled as a single long duration epoch [Ollinger et al., 2001a, b].
The t‐value was computed from the ratio of the cross‐correlation magnitudes (summed dot product) to the standard deviation of the residuals.
Participant surfaces reflected gray and white matter segmentation of brain volumes and surface reconstructions that approximated the unique course of cortical layer IV. However, activity anywhere within the gray matter was probably captured and registered to the surface nodes despite a mid‐cortical/layer IV segmentation boundary, because data was collected in 4‐mm3 voxels, transformed to 2 mm3 and spatially smoothed to 4 mm at FWHM.
Cortical regions included Brodmann areas [Drury et al., 1999; Van Essen, 2005], parietal opercular subdivisions [Burton et al., 2008a; Eickhoff et al., 2006], selected functional partitions of several Brodmann areas as described previously [Burton et al., 2008b], and occipital cortex visuotopic subdivisions [Van Essen, 2005; Van Essen and Dierker, 2007].
The repeated estimates for response time course were obtained from GLMs recomputed for each run, which provided 40 sets of time‐course data for each task. For the amplitude task, we evaluated 40 data sets for each group. During the frequency task NS contributed 40 and blind 37 data sets. The omitted runs were due to excessive movement during two BOLD runs in one EB and poor performance during one BOLD run in another EB.
REFERENCES
- Amedi A, Malach R, Hendler T, Peled S, Zohary E ( 2001): Visuo‐haptic object‐related activation in the ventral visual pathway. Nat Neurosci 4: 324–330. [DOI] [PubMed] [Google Scholar]
- Amedi A, Jacobson G, Hendler T, Malach R, Zohary E ( 2002): Convergence of visual and tactile shape processing in the human lateral occipital complex. Cereb Cortex 12: 1202–1212. [DOI] [PubMed] [Google Scholar]
- Amedi A, Raz N, Pianka P, Malach R, Zohary E ( 2003): Early ‘visual’ cortex activation correlates with superior verbal memory performance in the blind. Nat Neurosci 6: 758–766. [DOI] [PubMed] [Google Scholar]
- Amedi A, von Kriegstein K, van Atteveldt NM, Beauchamp MS, Naumer MJ ( 2005): Functional imaging of human crossmodal identification and object recognition. Exp Brain Res 166: 559–571. [DOI] [PubMed] [Google Scholar]
- Barch DM, Smith E ( 2008): The cognitive neuroscience of working memory: Relevance to CNTRICS and schizophrenia. Biol Psychiatry 64: 11–17. [DOI] [PMC free article] [PubMed] [Google Scholar]
- Bonino D, Ricciardi E, Sani L, Gentili C, Vanello N, Guazzelli M, Vecchi T, Pietrini P ( 2008): Tactile spatial working memory activates the dorsal extrastriate cortical pathway in congenitally blind individuals. Arch Ital Biol 146: 133–146. [PubMed] [Google Scholar]
- Bosch V ( 2000): Statistical analysis of multi‐subject fMRI data: Assessment of focal activations. J Magn Reson Imaging 11: 61–64. [DOI] [PubMed] [Google Scholar]
- Boynton GM, Engel SA, Glover GH, Heeger DJ ( 1996): Linear systems analysis of functional magnetic resonance imaging in human V1. J Neurosci 16: 4207–4221. [DOI] [PMC free article] [PubMed] [Google Scholar]
- Buckner RL, Wheeler ME ( 2001): The cognitive neuroscience of remembering. Nat Rev Neurosci 2: 624–634. [DOI] [PubMed] [Google Scholar]
- Buckner RL, Head D, Parker J, Fotenos AF, Marcus D, Morris JC, Snyder AZ ( 2004): A unified approach for morphometric and functional data analysis in young, old, and demented adults using automated atlas‐based head size normalization: Reliability and validation against manual measurement of total intracranial volume. Neuroimage 23: 724–738. [DOI] [PubMed] [Google Scholar]
- Burton H ( 2003): Visual cortex activity in early and late blind people. J Neurosci 23: 405–411. [DOI] [PMC free article] [PubMed] [Google Scholar]
- Burton H, McLaren D ( 2008): Visual deprivation effects on somatosensory and visual systems: Behavioral and cortical changes In: Basbaum AI, Kaneko A, Shepherd GM, Westheimer G, editors. The Senses: A Comprehensive Reference, Vol. 6: Somatosensation. Oxford, England: Elsevier; pp 363–391. [Google Scholar]
- Burton H, Sinclair RJ ( 2000): Attending to and remembering tactile stimuli: A review of brain imaging data and single neuron responses. J Clin Neurophysiol 17: 575–591. [DOI] [PubMed] [Google Scholar]
- Burton H, Abend NS, MacLeod A‐MK, Sinclair RJ, Snyder AZ, Raichle ME ( 1999): Tactile attention tasks enhance activation in somatosensory regions of parietal cortex: A positron emission tomography study. Cereb Cortex 9: 662–674. [DOI] [PubMed] [Google Scholar]
- Burton H, Snyder AZ, Conturo TE, Akbudak E, Ollinger JM, Raichle ME ( 2002a): Adaptive changes in early and late blind: A fMRI study of Braille reading. J Neurophysiol 87: 589–611. [DOI] [PMC free article] [PubMed] [Google Scholar]
- Burton H, Snyder AZ, Diamond J, Raichle ME ( 2002b): Adaptive changes in early and late blind: A fMRI study of verb generation to heard nouns. J Neurophysiol 88: 3359–3371. [DOI] [PMC free article] [PubMed] [Google Scholar]
- Burton H, Diamond JB, McDermott KB ( 2003): Dissociating cortical regions activated by semantic and phonological tasks to heard words: A fMRI study in blind and sighted individuals. J Neurophysiol 90: 1965–1982. [DOI] [PMC free article] [PubMed] [Google Scholar]
- Burton H, Sinclair R, McLaren D ( 2004): Cortical activity to vibrotactile stimulation: A fMRI study in blind and sighted individuals. Hum Brain Mapp 23: 210–228. [DOI] [PMC free article] [PubMed] [Google Scholar]
- Burton H, McLaren D, Sinclair R ( 2006): Reading embossed capital letters: A fMRI study in blind and sighted individuals. Hum Brain Mapp 27: 325–339. [DOI] [PMC free article] [PubMed] [Google Scholar]
- Burton H, Sinclair R, Wingert J, Dierker D ( 2008a): Multiple parietal operculum subdivisions in humans: Tactile activation maps. Somatosens Mot Res 25: 149–162. [DOI] [PMC free article] [PubMed] [Google Scholar]
- Burton H, Sinclair RJ, McLaren DG ( 2008b): Cortical network for vibrotactile attention: A fMRI study. Hum Brain Mapp 2: 207–221. [DOI] [PMC free article] [PubMed] [Google Scholar]
- Cabeza R ( 2008): Role of parietal regions in episodic memory retrieval: The dual attentional processes hypothesis. Neuropsychologia 46: 1813–1827. [DOI] [PMC free article] [PubMed] [Google Scholar]
- Cabeza R, Nyberg L ( 2000): Imaging cognition II: An empirical review of 275 PET and fMRI studies. J Cogn Neurosci 12: 1–47. [DOI] [PubMed] [Google Scholar]
- Cabeza R, Ciaramelli E, Olson IR, Moscovitch M ( 2008): The parietal cortex and episodic memory: An attentional account. Nat Rev Neurosci 9: 613–625. [DOI] [PMC free article] [PubMed] [Google Scholar]
- Cattaneo Z, Vecchi T, Cornoldi C, Mammarella I, Bonino D, Ricciardi E, Pietrini P ( 2008): Imagery and spatial processes in blindness and visual impairment. Neurosci Biobehav Rev 32: 1346–1360. [DOI] [PubMed] [Google Scholar]
- Ciaramelli E, Grady CL, Moscovitch M ( 2008): Top–down and bottom–up attention to memory: A hypothesis (AtoM) on the role of the posterior parietal cortex in memory retrieval. Neuropsychologia 46: 1828–1851. [DOI] [PubMed] [Google Scholar]
- Cohen LG, Celnik P, Pascual‐Leone A, Corwell B, Faiz L, Dambrosia J, Honda M, Sadato N, Gerloff C, Catalá MD, Hallett M ( 1997): Functional relevance of cross‐modal plasticity in blind humans. Nature 389: 180–183. [DOI] [PubMed] [Google Scholar]
- Cohen LG, Weeks RA, Sadato N, Celnik P, Ishii K, Hallett M ( 1999): Period of susceptibility for cross‐modal plasticity in the blind. Ann Neurol 45: 451–460. [DOI] [PubMed] [Google Scholar]
- Collignon O, Renier L, Bruyer R, Tranduy D, Veraart C ( 2006): Improved selective and divided spatial attention in early blind subjects. Brain Res 1075: 175–182. [DOI] [PubMed] [Google Scholar]
- Corbetta M, Shulman GL ( 2002): Control of goal‐directed and stimulus‐driven attention in the brain. Nat Rev Neurosci 3: 201–215. [DOI] [PubMed] [Google Scholar]
- Corbetta M, Patel G, Shulman GL ( 2008): The reorienting system of the human brain: From environment to theory of mind. Neuron 58: 306–324. [DOI] [PMC free article] [PubMed] [Google Scholar]
- Curtis CE, D'Esposito M ( 2003): Persistent activity in the prefrontal cortex during working memory. Trends Cogn Sci 7: 415–423. [DOI] [PubMed] [Google Scholar]
- D'Angiulli A, Waraich P ( 2002): Enhanced tactile encoding and memory recognition in congenital blindness. Int J Rehabil Res 25: 143–145. [DOI] [PubMed] [Google Scholar]
- Drevets WC, Burton H, Videen TO, Snyder AZ, Simpson JR Jr, Raichle ME ( 1995): Blood flow changes in human somatosensory cortex during anticipated stimulation. Nature 373: 249–252. [DOI] [PubMed] [Google Scholar]
- Drury H, Van Essen D, Corbetta M, Snyder AZ ( 1999): Surface‐based analyses of the human visual cortex In: Toga A, editor. Brain Warping. New York: Academic Press; pp 337–363. [Google Scholar]
- Duncan J, Owen AM ( 2000): Common regions of the human frontal lobe recruited by diverse cognitive demands. Trends Neurosci 23: 475–483. [DOI] [PubMed] [Google Scholar]
- Eickhoff SB, Schleicher A, Zilles K, Amunts K ( 2006): The human parietal operculum. I. Cytoarchitectonic mapping of subdivisions. Cereb Cortex 16: 254–267. [DOI] [PubMed] [Google Scholar]
- Forman SD, Cohen JD, Fitzgerald M, Eddy WF, Mintun MA, Noll DC ( 1995): Improved assessment of significant activation in functional magnetic resonance imaging (fMRI): Use of a cluster‐size threshold. Magn Reson Med 33: 636–647. [DOI] [PubMed] [Google Scholar]
- Fox MD, Corbetta M, Snyder AZ, Vincent JL, Raichle ME ( 2006): Spontaneous neuronal activity distinguishes human dorsal and ventral attention systems. Proc Natl Acad Sci USA 103: 10046–10051. [DOI] [PMC free article] [PubMed] [Google Scholar]
- Friston K, Holmes A, Worsley K, Poline J, Frith C, Frackowiak R ( 1995): Statistical parametric maps in functional imaging: A general linear approach. Hum Brain Mapp 2: 189–210. [Google Scholar]
- Friston KJ, Fletcher P, Josephs O, Holmes A, Rugg MD, Turner R ( 1998): Event‐related fMRI: Characterizing differential responses. Neuroimage 7: 30–40. [DOI] [PubMed] [Google Scholar]
- Gizewski ER, Gasser T, de Greiff A, Boehm A, Forsting M ( 2003): Cross‐modal plasticity for sensory and motor activation patterns in blind subjects. Neuroimage 19: 968–975. [DOI] [PubMed] [Google Scholar]
- Grill‐Spector K, Malach R ( 2004): The human visual cortex. Ann Rev Neurosci 27: 649–677. [DOI] [PubMed] [Google Scholar]
- Gusnard DA, Raichle ME ( 2001): Searching for a baseline: Functional imaging and the resting human brain. Nat Rev Neurosci 2: 685–694. [DOI] [PubMed] [Google Scholar]
- Hagen MC, Franzen O, McGlone F, Essick G, Dancer C, Pardo JV ( 2002): Tactile motion activates the human middle temporal/V5 (MT/V5) complex. Eur J Neurosci 16: 957–964. [DOI] [PubMed] [Google Scholar]
- Hamilton R, Keenan JP, Catala M, Pascual‐Leone A ( 2000): Alexia for Braille following bilateral occipital stroke in an early blind woman. Neuroreport 11: 237–240. [DOI] [PubMed] [Google Scholar]
- Hasson U, Levy I, Behrmann M, Hendler T, Malach R ( 2002): Eccentricity bias as an organizing principle for human high‐order object areas. Neuron 34: 479–490. [DOI] [PubMed] [Google Scholar]
- Hasson U, Harel M, Levy I, Malach R ( 2003): Large‐scale mirror‐symmetry organization of human occipito‐temporal object areas. Neuron 37: 1027–1041. [DOI] [PubMed] [Google Scholar]
- Haxby JV, Horwitz B, Ungerleider LG, Maisog JM, Pietrini P, Grady CL ( 1994): The functional organization of human extrastriate cortex: A PET‐rCBF study of selective attention to faces and locations. J Neurosci 14: 6336–6353. [DOI] [PMC free article] [PubMed] [Google Scholar]
- James TW, Humphrey GK, Gati JS, Servos P, Menon RS, Goodale MA ( 2002): Haptic study of three‐dimensional objects activates extrastriate visual areas. Neuropsychologia 40: 1706–1714. [DOI] [PubMed] [Google Scholar]
- Jiang A, Kennedy D, Woods R, Baker J, Tootell R, Kwong K, Weisskoff R, Belliveau J, Brady T, Rosen B ( 1994): Motion detection and correction in functional MRI. In: Book of Abstracts and Proceedings of the 2nd Meeting of the Society of Magnetic Resonance (SMR), San Francisco, August 6–12, 1994. p 351.
- Jonides J, Lewis RL, Nee DE, Lustig CA, Berman MG, Moore KS ( 2008): The mind and brain of short‐term memory. Ann Rev Psychol 59: 193–224. [DOI] [PMC free article] [PubMed] [Google Scholar]
- Kujala T, Alho K, Kekoni J, Hamalainen H, Reinikainen K, Salonen O, Standertskjold‐Nordenstam CG, Naatanen R ( 1995): Auditory and somatosensory event‐related brain potentials in early blind humans. Exp Brain Res 104: 519–526. [DOI] [PubMed] [Google Scholar]
- Kujala T, Alho K, Naatanen R ( 2000): Cross‐modal reorganization of human cortical functions. Trends Neurosci 23: 115–120. [DOI] [PubMed] [Google Scholar]
- Kwong KK, Belliveau JW, Chesler DA, Goldberg IE, Weisskoff RM, Poncelet BP, Kennedy DN, Hoppel BE, Cohen MS, Turner R, Cheng HM, Brady TJ, Rosen BR ( 1992): Dynamic magnetic resonance imaging of human brain activity during primary sensory stimulation. Proc Natl Acad Sci USA 89: 5675–5679. [DOI] [PMC free article] [PubMed] [Google Scholar]
- Lancaster JL, Glass TG, Lankipalli BR, Downs H, Mayberg H, Fox PT ( 1995): A modality‐independent approach to spatial normalization of tomographic images of the human brain. Hum Brain Mapp 3: 209–223. [Google Scholar]
- Miezin FM, Maccotta L, Ollinger JM, Petersen SE, Buckner RL ( 2000): Characterizing the hemodynamic response: Effects of presentation rate, sampling procedure, and the possibility of ordering brain activity based on relative timing. Neuroimage 11: 735–759. [DOI] [PubMed] [Google Scholar]
- Ogawa S, Lee TM, Kay AR, Tank DW ( 1990): Brain magnetic resonance imaging with contrast dependent on blood level oxygenation. Proc Natl Acad Sci USA 87: 9868–9872. [DOI] [PMC free article] [PubMed] [Google Scholar]
- Ojemann JG, Akbudak E, Snyder AZ, McKinstry RC, Raichle ME, Conturo TE ( 1997): Anatomic localization and quantitative analysis of gradient refocused echo‐planar fMRI susceptibility artifacts. Neuroimage 6: 156–167. [DOI] [PubMed] [Google Scholar]
- Ollinger JM, Corbetta M, Shulman GL ( 2001a): Separating processes within a trial in event‐related functional MRI. I. The method. Neuroimage 13: 210–217. [DOI] [PubMed] [Google Scholar]
- Ollinger JM, Corbetta M, Shulman GL ( 2001b): Separating processes within a trial in event‐related functional MRI. II. Analysis. Neuroimage 13: 218–229. [DOI] [PubMed] [Google Scholar]
- Olson IR, Berryhill M ( 2009): Some surprising findings on the involvement of the parietal lobe in human memory. Neurobiol Learn Mem 91: 155–165. [DOI] [PMC free article] [PubMed] [Google Scholar]
- Pascual‐Leone A, Amedi A, Fregni F, Merabet LB ( 2005): The plastic human brain cortex. Ann Rev Neurosci 28: 377–401. [DOI] [PubMed] [Google Scholar]
- Petrides M ( 2000): The role of the mid‐dorsolateral prefrontal cortex in working memory. Exp Brain Res 133: 44–54. [DOI] [PubMed] [Google Scholar]
- Pietrini P, Furey ML, Ricciardi E, Gobbini MI, Wu WH, Cohen L, Guazzelli M, Haxby JV ( 2004): Beyond sensory images: Object‐based representation in the human ventral pathway. Proc Natl Acad Sci USA 101: 5658–5663. [DOI] [PMC free article] [PubMed] [Google Scholar]
- Prather SC, Votaw JR, Sathian K ( 2004): Task‐specific recruitment of dorsal and ventral visual areas during tactile perception. Neuropsychologia 42: 1079–1087. [DOI] [PubMed] [Google Scholar]
- Ptito M, Moesgaard SM, Gjedde A, Kupers R ( 2005): Cross‐modal plasticity revealed by electrotactile stimulation of the tongue in the congenitally blind. Brain 128: 606–614. [DOI] [PubMed] [Google Scholar]
- Raz N, Amedi A, Zohary E ( 2005): V1 Activation in congenitally blind humans is associated with episodic retrieval. Cereb Cortex 15: 1459–1468. [DOI] [PubMed] [Google Scholar]
- Raz N, Striem E, Pundak G, Orlov T, Zohary E ( 2007): Superior serial memory in the blind: A case of cognitive compensatory adjustment. Curr Biol 17: 1129–1133. [DOI] [PubMed] [Google Scholar]
- Reppas JB, Niyogi S, Dale AM, Sereno MI, Tootell RB ( 1997): Representation of motion boundaries in retinotopic human visual cortical areas. Nature 388: 175–179. [DOI] [PubMed] [Google Scholar]
- Ricciardi E, Bonino D, Gentili C, Sani L, Pietrini P, Vecchi T ( 2006): Neural correlates of spatial working memory in humans: A functional magnetic resonance imaging study comparing visual and tactile processes. Neuroscience 139: 339–349. [DOI] [PubMed] [Google Scholar]
- Ricciardi E, Vanello N, Sani L, Gentili C, Scilingo EP, Landini L, Guazzelli M, Bicchi A, Haxby JV, Pietrini P ( 2007): The effect of visual experience on the development of functional architecture in hMT+. Cereb Cortex 17: 2933–2939. [DOI] [PubMed] [Google Scholar]
- Röder B, Rösler F, Hennighausen E, Näcker F ( 1996): Event‐related potentials during auditory and somatosensory discrimination in sighted and blind human subjects. Cognit Brain Res 4: 77–93. [PubMed] [Google Scholar]
- Sadato N, Pascual‐Leone A, Grafman J, Ibanez V, Deiber MP, Dold G, Hallett M ( 1996): Activation of the primary visual cortex by Braille reading in blind subjects. Nature 380: 526–528. [DOI] [PubMed] [Google Scholar]
- Sadato N, Okada T, Honda M, Yonekura Y ( 2002): Critical period for cross‐modal plasticity in blind humans: A functional MRI study. Neuroimage 16: 389–400. [DOI] [PubMed] [Google Scholar]
- Sathian K ( 2005): Visual cortical activity during tactile perception in the sighted and the visually deprived. Dev Psychobiol 46: 279–286. [DOI] [PubMed] [Google Scholar]
- Sathian K, Burton H ( 1991): The role of spatially selective attention in the tactile perception of texture. Percept Psychophys 50: 237–248. [DOI] [PubMed] [Google Scholar]
- Sinclair RJ, Burton H ( 1996): Discrimination of vibrotactile frequencies in a delayed pair comparison task. Percept Psychophys 58: 680–692. [DOI] [PubMed] [Google Scholar]
- Stilla R, Sathian K ( 2008): Selective visuo‐haptic processing of shape and texture. Hum Brain Mapp 29: 1123–1138. [DOI] [PMC free article] [PubMed] [Google Scholar]
- Stilla R, Deshpande G, LaConte S, Hu X, Sathian K ( 2007): Posteromedial parietal cortical activity and inputs predict tactile spatial acuity. J Neurosci 27: 11091–11102. [DOI] [PMC free article] [PubMed] [Google Scholar]
- Stoesz MR, Zhang M, Weisser VD, Prather SC, Mao H, Sathian K ( 2003): Neural networks active during tactile form perception: Common and differential activity during macrospatial and microspatial tasks. Int J Psychophysiol 50: 41–49. [DOI] [PubMed] [Google Scholar]
- Talairach J, Tournoux P ( 1988): Coplanar Stereotaxic Atlas of the Human Brain. New York: Thieme Medical; 122 p. [Google Scholar]
- Tootell RB, Reppas JB, Kwong KK, Malach R, Born RT, Brady TJ, Rosen BR, Belliveau JW ( 1995): Functional analysis of human MT and related visual cortical areas using magnetic resonance imaging. J Neurosci 15: 3215–3230. [DOI] [PMC free article] [PubMed] [Google Scholar]
- Tootell RB, Dale AM, Sereno MI, Malach R ( 1996): New images from human visual cortex. Trends Neurosci 19: 481–489. [DOI] [PubMed] [Google Scholar]
- Uhl F, Franzen P, Lindinger G, Lang W, Deecke L ( 1991): On the functionality of the visually deprived occipital cortex in early blind persons. Neurosci Lett 124: 256–259. [DOI] [PubMed] [Google Scholar]
- Ungerleider LG, Haxby JV ( 1994): ‘What’ and ‘where’ in the human brain. Curr Opin Neurobiol 4: 157–165. [DOI] [PubMed] [Google Scholar]
- Van Essen DC ( 2004): Organization of visual areas in Macaque and human cerebral cortex In: Chalupa L, Werner JS, editors. The Visual Neurosciences. Cambridge, MA: MIT Press; pp 507–521. [Google Scholar]
- Van Essen DC ( 2005): A population‐average, landmark‐ and surface‐based (PALS) atlas of human cerebral cortex. Neuroimage 28: 635–662. [DOI] [PubMed] [Google Scholar]
- Van Essen DC, Dierker DL ( 2007): Surface‐based and probabilistic atlases of primate cerebral cortex. Neuron 56: 209–225. [DOI] [PubMed] [Google Scholar]
- Van Essen DC, Drury HA, Dickson J, Harwell J, Hanlon D, Anderson CH ( 2001): An integrated software suite for surface‐based analyses of cerebral cortex. J Am Med Inform Assoc 8: 443–459. [DOI] [PMC free article] [PubMed] [Google Scholar]
- Vecchi T ( 1998): Visuo‐spatial imagery in congenitally totally blind people. Memory 6: 91–102. [DOI] [PubMed] [Google Scholar]
- Vecchi T, Monticellai ML, Cornoldi C ( 1995): Visuo‐spatial working memory: Structures and variables affecting a capacity measure. Neuropsychologia 33: 1549–1564. [DOI] [PubMed] [Google Scholar]
- Vecchi T, Tinti C, Cornoldi C ( 2004): Spatial memory and integration processes in congenital blindness. Neuroreport 15: 2787–2790. [PubMed] [Google Scholar]
- Wager D, Smith E ( 2003): Neuroimaging studies of working memory: A meta‐analysis. Cogn Affect Behav Neurosci 3: 255–274. [DOI] [PubMed] [Google Scholar]
- Weaver KE, Stevens AA ( 2007): Attention and sensory interactions within the occipital cortex in the early blind: An fMRI study. J Cogn Neurosci 19: 315–330. [DOI] [PubMed] [Google Scholar]
- Whang KC, Burton H, Shulman GL ( 1991): Selective attention in vibrotactile tasks: Detecting the presence and absence of amplitude change. Percept Psychophys 50: 157–165. [DOI] [PubMed] [Google Scholar]
- Yovel G, Kanwisher N ( 2004): Face perception: Domain specific, not process specific. Neuron 44: 889–898. [DOI] [PubMed] [Google Scholar]
- Zangaladze A, Epstein CM, Grafton ST, Sathian K ( 1999): Involvement of visual cortex in tactile discrimination of orientation. Nature 401: 587–590. [DOI] [PubMed] [Google Scholar]
- Zarahn E, Aguirre G, D'Esposito M ( 1997): A trial‐based experimental design for fMRI. Neuroimage 6: 122–138. [DOI] [PubMed] [Google Scholar]
- Zhang MM, Mariola E, Stilla R, Stoesz M, Mao H, Hu XP, Sathian K ( 2005): Tactile discrimination of grating orientation: fMRI activation patterns. Hum Brain Mapp 25: 370–377. [DOI] [PMC free article] [PubMed] [Google Scholar]
- Zimmer HD ( 2008): Visual and spatial working memory: From boxes to networks. Neurosci Biobehav Rev 32: 1373–1395. [DOI] [PubMed] [Google Scholar]