

Abstract
The fronto‐striato‐thalamic circuit has been implicated in the pathomechanism of Tourette Syndrome (TS). To study white and gray matter comprehensively, we used a novel technique called Tract‐Based Spatial Statistics (TBSS) combined with voxel‐based analysis (VBA) of diffusion tensor MR images in children with TS as compared to typically developing controls. These automated and unbiased methods allow analysis of cerebral white matter and gray matter regions. We compared 15 right‐handed children with TS (mean age: 11.6 ± 2.5 years, 12 males) to 14 age‐matched right‐handed healthy controls (NC; mean age: 12.29 ± 3.2 years, 6 males). Tic severity and neurobehavioral scores were correlated with FA and ADC values in regions found abnormal by these methods. For white matter, TBSS analysis showed regions of increased ADC in the corticostriatal projection pathways including left external capsule and left and right subcallosal fasciculus pathway in TS group compared to NC group. Within the TS group, ADC for the left external capsule was negatively associated with tic severity (r= −0.586, P = 0.02). For gray matter, VBA revealed increased ADC for bilateral orbitofrontal cortex, left putamen, and left insular cortex. ADC for the right and left orbitofrontal cortex was highly correlated with internalizing problems (r = 0.665; P = 0.009, r = 0.545; P = 0.04, respectively). Altogether, this analysis revealed focal diffusion abnormalities in the corticostriatal pathway and in gray matter structures involved in the fronto‐striatal circuit in TS. These diffusion abnormalities could serve as a neuroimaging marker related to tic severity and neurobehavioral abnormalities in TS subjects. Hum Brain Mapp, 2010. © 2010 Wiley‐Liss, Inc.
Keywords: DTI, Tourette syndrome, TBSS, Corticostriatal pathway, ADC
INTRODUCTION
Tourette syndrome (TS) is a complex neuropsychiatric disorder manifested by motor and vocal tics generally first appearing in childhood [Kramer and Daniels, 2004]. The tics typically follow a waxing and waning pattern of severity and usually peak during the early part of the second decade of life with many subjects showing a marked reduction of severity by late adolescence. However, a small proportion of children (20%) continue to persist with tic symptoms into adulthood. TS is often associated with other comorbid neuropsychiatric conditions such as obsessive compulsive disorder (OCD) and attention deficit hyperactivity disorder (ADHD) [Como, 2001].
The etiopathogenesis of TS is still unclear, although it has long been suspected that this is a heritable condition [Eapen et al., 1993; Pauls, 2003]. However, other mechanisms related to autoimmunity and beta‐hemolytic streptococcal infections have also been implicated as a causative mechanism [Mell et al., 2005; Pauls, 2003; Swedo et al., 1998]. There is much evidence in the literature to implicate the involvement of a dysfunctional fronto‐striato‐thalamic‐cortical (FSTC) circuitry in this tic disorder [Harris and Singer, 2006]. Several imaging studies have also demonstrated a pivotal role of this circuitry in TS [Jeffries et al., 2002; Ludolph et al., 2006; Makki et al., 2008; Peterson et al., 1998], as well as abnormal volume in component gray matter regions of the FSTC circuitry [Peterson et al., 2001, 2003). However, translation of these findings to useful clinical treatment approaches has been slow and hindered by the lack of suitable noninvasive methodologies to study the disorder. Indeed, conventional clinical magnetic resonance imaging (MRI) typically are read as normal in patients with TS [Frey and Albin, 2006].
Using positron emission tomography (PET) of tryptophan metabolism, we have reported four patterns of abnormal tryptophan uptake in frontal cortex, striatum, and thalamus, indicating abnormal serotonin neurotransmission in the pathophysiology of this disorder [Behen et al., 2007]. In a subsequent study, using diffusion tensor MRI (DT‐MRI), we showed a significant increase of diffusivity in the bilateral putamen and right thalamus, as well as a reversed asymmetry of fractional anisotropy (FA) in the thalamus [Makki et al., 2008]. There was also a significant positive correlation between right thalamic diffusivity and tic severity. These findings support the hypothesis that microstructural abnormalitis measured by DT‐MRI in component regions of the FSTC circuit might reflect the underlying pathophysiological process associated with TS.
Recent advances in DT‐MRI [Basser et al., 1994] allow individual tracts to be isolated and their diffusion properties measured. In the “deterministic” tractography approach [e.g., FACT; Mori et al., 1999], an initial seed region selection is used for isolation of a tract. However, the isolated tract is inhomogeneous in its specificity for a particular white matter pathway because other pathways may be included in the tract. A major reason for the lack of pathway specificity of the tractographic procedure is that it is mainly based on the primary diffusion direction of the tensor calculated at the voxel level. Although diffusion measurements in other directions (secondary and tertiary eigenvalues) hold some information about other crossing pathways, these pieces of information are never used in conventional tractographic methods [Behrens et al., 2007; King et al., 2009]. However, these problems do not play a major role in large pathways such as corpus callosum or corticospinal tracts where axonal crossing is minimal, but they are important factors when studying minor tracts which are present exclusively in small islets of regions spread along its course. To overcome these problems and to improve the accuracy of identifying diffusion abnormalities in minor tracts, a voxel‐based method with high spatial resolution is needed. Unfortunately, voxel‐based techniques that use considerable spatial smoothing, such as those used by SPM, are not appropriate to the study of the white matter structures [Smith et al., 2006].
Tract‐Based Spatial Statistics (TBSS) is a specialized technique for the study of cerebral white matter which makes use of the intrinsic anisotropic property of the white matter [Smith et al., 2006]. This technique greatly reduces the total number of voxel comparisons and avoids the spatial smoothing used in the other voxel‐based techniques. In this study, we used this unbiased TBSS method to identify diffusion abnormalities in the corticostriatal pathway in children with TS. In addition, we also used voxel‐based analysis (VBA) to measure the overall diffusion values (ADC) from cortical and subcortical regions involved in the fronto‐striato‐thalmo‐cortical circuitry assumed to be involved in subjects with TS.
METHODS
Fifteen right‐handed children (age range: 7.9–17.2 years, mean age: 11.6 ± 2.5 years, 12 males and 3 girls) diagnosed with TS were included in this study (Table I). These subjects were compared to 14 right‐handed age‐matched healthy control children (age range: 7.2–17.5 years, mean age: 12.3 ± 3.2 years, 6 males and 8 girls). Comparison of age between these two groups showed no difference (P = 0.54). The inclusion criteria for the TS group were current diagnosis of TS according to the DSM‐IV TR criteria, and with absence of major medical illness. For the controls, the inclusion criteria included intellectual functioning within normal limits (FSIQ > 85), and absence of major medical illness. For all the children with TS, the tic severity during the 1 week prior to MRI scan was assessed along with quantification of neurobehavioral problems (hyperactivity, attention, externalizing, internalizing, and obsessive and compulsive problems) (Table I). The assessment of tics involved administration of the Tic Symptom Self‐Report measure to obtain motor and vocal tic scores; subsequently, a composite tic severity score was calculated and used as the index of tic severity [Cohen et al., 1988]. Seven of the TS subjects were using psychoactive medication during the MRI scan, three had used psychoactive medication in the past but not at the time of the scan, and five subjects had never used any such medications. No sedation was used in any of the subjects during MRI. The study protocols for both TS and normal control subjects were approved by the Wayne State University Institutional Review Board and written informed consent of parents/guardian as well as assents of children older than 13 years were obtained. The authors report no conflict of interest.
Table I.
Demographic and neurobehavioral profile
| TS | Controls | |||
|---|---|---|---|---|
| Number of subjects | 15 | 14 | ||
| Age (mean ± SD, years) | 11.6 ± 2.5 | 12.3 ± 3.2 | ||
| Age range (years) | 7.9–17.2 | 7.2–17.5 | ||
| Gender (boys:girls) | 12:3 | 6:8 | ||
| Neurobehavioral scores | Mean | SD | Mean | SD |
| Verbal comprehension index | 107.8 | 14.7 | 110 | 12.5 |
| Percept organization index | 103.3 | 11.8 | 107 | 15.5 |
| Freedom from distractibility index | 103.6 | 18.9 | 106 | 13.4 |
| Processing speed index | 108.3 | 20.0 | 106 | 18.6 |
| Hyperactivity problems | 59.7 | 16.8 | ||
| Attention problems | 56.3 | 16.3 | ||
| Externalizing behavioral problems | 57.8 | 19.2 | ||
| Internalizing behavioral problems | 58.8 | 11.7 | ||
| Obsessive behavioral problems | 10.3 | 4.8 | ||
| Compulsive behavioral problems | 11.4 | 4.9 | ||
| Tic severity (motor + vocal)a | 13.7 | 11.2 | ||
| Medication | ||||
| Current use (case 2, 3, 6, 8, 9, 12, and 15) | Methylphenidate, risperidone, guanfacine, risperidone, aripiprazole, risperidone and levetiracetam, respectively | |||
| Use in the past (case 5, 11, and 14) | Amphetamine and dextroamphetamine, risperidone and methylphenidate, respectively | |||
Composite tic severity score of motor and vocal tics.
MRI scans were performed using a GE system with a 3‐T magnet. Diffusion tensor images (spin‐echo echo‐planar imaging sequence) were acquired in the axial plane with diffusion sensitization gradients applied in six noncollinear directions with b‐value of 1,000 s/mm2. The same imaging parameters were applied to acquire T2 weighted (b ∼ 0 s/mm2) images to use as a reference image for signal attenuation measurement. All image volumes were acquired using six repetitions in each of the six optimized directions to increase the signal‐to‐noise ratio, to reproduce more diffusion directionalities and reduce image artifacts. Parallel imaging (ASSET factor of 2) was applied to reduce image distortion inherent in EPI. The echo time was 87 ms, and the repetition time was 11 s. A set of minimum 34 axial slices of 3‐mm thickness without gap, covering the whole brain including the cerebellum, was acquired with matrix size 128 × 128 and reconstructed in 256 × 256. The field of view was 240 mm × 240 mm, and the approximate scanning time for the DTI acquisition was 9 min.
Procedure
Tensor calculation and TBSS
The entire image sets were visually inspected and affine corrected for motion and other imaging artifacts. Images that could not be corrected were excluded from the study. The tensor calculation of the DTI images was performed using DtiStudio software provided by Dr. Susumu Mori at Johns Hopkins University [Jiang et al., 2006]. The native T2W images, and the FA and ADC images derived from the tensor calculation were saved and transferred to a Linux‐based workstation for further processing. The next step involved extraction of the brain matter on the T2W images, using the Brain Extraction Tool (BET) available with the FSL software; a fractional intensity threshold of 0.35 was used for this step. These extracted T2W images were applied as a mask to both the FA and ADC images of all the participants and used as the input images for TBSS processing [Smith et al., 2006].
The initial step of TBSS analysis consisted of voxel‐wise nonlinear registration of all participants to a target MR image provided by the FSL software. The transformed FA images of all participants were combined to create a group specific mean FA image. This group specific mean FA image was then used to create a skeleton image of the white matter tracts using a protocol which searches and labels the skeleton voxels with maximum FA intensity along the perpendicular direction (breath) of a white matter tract. An FA threshold of 0.2 was used to segment gray and white matter. The mean skeleton, derived from the mean FA image, was identified at the exact median of the white matter tract. This mean skeleton was later applied to the registered FA image of individual participants. Following the search for the maximum FA value along the width of the white matter tract, perpendicular to the skeleton voxel, the maximum FA values were then projected on to the skeleton voxel for further statistical analysis. In a separate process using the FA image derived skeleton, the maximum values along the direction perpendicular to the tract of the ADC image were also projected to a separate skeleton image.
TBSS statistical analysis
Voxel‐wise statistical analysis of individual skeleton images of both controls and TS children for both contrasts (controls > TS) and (controls < TS) was performed using nonparametric permutation test. Since studies have shown age and gender related diffusion changes [Hsu et al., 2008; Qiu et al., in press] and since the gender ratio differed between the TS and control groups, age and gender were included as covariates for the TBSS analyses. The threshold for cluster size threshold was >3, and p‐value was <0.05 for significance, after correcting for multiple comparisons. Skeletal voxels that were significantly different between the groups were isolated and labeled; these voxels were then expanded to include the full width of the white matter tract which was then used as a mask permitting calculation of the mean FA and ADC values for the width of the tract for individual participants. The mean values from these tracts were correlated with tic severity and neurobehavioral scores. Correlation analysis was performed using SPSS version 15.
Voxel based analysis
VBA is a fully automated, unbiased technique in which MRIs are processed and analyzed to test for regional structural differences between groups of subjects [Ashburner and Friston, 2000]. The first step in this procedure requires correction of residual eddy‐current and field inhomogeneity distortions. Nondiffusion images (T2W) were warped to EPI using an algorithm based on Markov random fields. ADC map was warped to the resulting nondiffusion set, and a template was created from the 29 subjects [Good et al., 2001]. Each image was spatially normalized to the EPI template, then averaged and the resulting image was smoothed with an 8‐mm Gaussian kernel to create a template. To correct for global shape difference, spatial normalization was performed [Ashburner et al., 1999]. It includes affine transformation and linear combination of smooth basis functions that model non linear differences in shape. The normalized, and unmodulated images were smoothed using a 12‐mm FWHM isotropic Gaussian kernel. Standard predefined regions for various cortical (orbitofrontal (ORB_FRN), dorsofrontal (DOR_FRN), sensory motor, insular, and anterior cingulate), and subcortical (caudate, pallidum, putamen, and thalamus) structures were later applied on to the transformed ADC images to extract the ADC values.
VBA statistical analysis
In addition the ADC values from the gray matter, cortical and subcortical structures were analyzed using repeated measure with side (right and left), group (TS and control) and regions (DOR_FRN, ORB_FRN, sensor_motor, insular, anterior_cingulate, caudate, putamen, pallidum, and thalamus), and age and gender as a covariate. The mean ADC values from the regions significantly differed between the TS and control groups were correlated with tic severity and neurobehavioral scores. Statistical analysis was performed using SPSS version 15.
RESULTS
TBSS Analysis
The results from the TBSS analysis of DTI images from the 15 TS subjects showed regions with significant (p‐value of <0.05 for significance, after correcting for multiple comparisons) increase in water diffusivity (ADC) in parts of the left external capsule (EC) and left and right subcallosal fasciculus (SC) (Figs. 1 and 2) compared to the typically developing control subjects. No other region showed decreased or increased FA or ADC values.
Figure 1.

The abnormal corticostriatal projection tracts (red‐yellow, L‐SC: left subcallosal fasciculus, R‐SC: right subcallosal fasciculus, and EC: left external capsule) of the TS subjects with increased ADC values compared to the controls. Green: skeleton voxels. [Color figure can be viewed in the online issue, which is available at wileyonlinelibrary.com.]
Figure 2.

Box plot (A) shows the differences in the ADC values for the three regions (L‐SC: left subcallosal fasciculus, R‐SC: right subcallosal fasciculus, and L‐EC: left external capsule) between the two groups (TS and controls). Scatter plot (B–D) shows the distribution of ADC values with age in all the three regions (L‐SC, L‐EC, and R‐SC, respectively) for both the groups.
Correlation with tic severity scores
The mean ADC values measured from EC of the TS group showed a negative partial correlation with the tic severity score (r = −0.586, p = 0.028, with age as covariate) measured for the week prior to the MRI scan (Fig. 3).
Figure 3.

Partial correlation plot of the ADC values form the left External Capsule (L‐EC) and Tic severity scores (r = −0.586, p = 0.028).
TBSS analysis with medication
Seven TS subjects were taking medication (Table I); therefore, to rule out the effect of medication on the measured diffusion values, we compared the ADC values between TS subjects on medication and those without medication. Our results showed no significant difference between these two groups (left SC: p = 0.69, right SC: p = 0.79, and left EC: p = 0.238).
VBA
Using VBA, diffusion values measured from the gray matter regions showed a significant three‐way interaction between regions × side × group (F = 2.4, and p = 0.05). Following this, the follow‐up test for individual regions showed increased diffusivity in left and right orbitofrontal cortex (p = 0.035, p = 0.025), left insular cortex (p = 0.023), and left putamen (p = 0.014) (Fig. 4). Left pallidum (p = 0.052), and right insular cortex (p = 0.052) showed a trend towards increased diffusivity compared to controls. The overall group difference (between TS and controls) for all the regions of both the sides combined together showed a trend toward significance (p = 0.077) with increased ADC value in the TS group compared to controls. In addition, the ADC measurements from right and left orbitofrontal cortices showed significant positive partial correlation with internalizing problem scores (r = 0.665; p = 0.009, r = 0.545; p = 0.044, respectively (Fig. 5).
Figure 4.

Shows the (estimated marginal mean) ADC value of cortical and subcortical gray matter structures with significant three‐way interaction between regions × side × group (F = 2.4 and p = 0.05). The follow‐up test for individual regions showed increased diffusivity in left and right orbitofrontal (p = 0.035, p = 0.025), left putamen (p = 0.014), and left insular cortex (p = 0.023) compared to the controls. ORB_FRN: orbitofrontal cortex, DOR_FRN: dorsal frontal cortex, Cingulum: anterior cingulate cortex. The error bars denote the standard error of the estimated marginal mean values.
Figure 5.
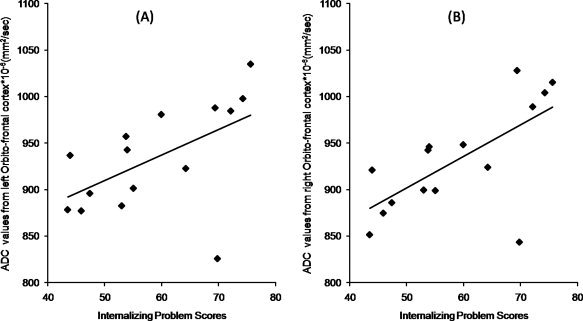
The partial correlation plot between the ADC values of the left (A) (r = 0.545; p = 0.044) and right (B) (r = 0.665; p = 0.009) orbitofrontal cortex with the Internalizing problem scores with controlling for age.
DISCUSSION
The major findings in the present study were increased ADC values in the corticostriatal projection pathways, including both the medial right and left SC, and the lateral EC pathways in children with TS versus typically developing children. ADC values derived from the left EC pathway also showed a significant negative correlation with the tic severity scores. In addition, the ADC values obtained from gray matter structures also showed overall increased ADC values with significant differences in the bilateral orbitofrontal, right insular cortex, and left putamen, in children with TS as compared to controls. Finally, the ADC values from right and left orbitofrontal cortex showed a significant positive correlation with internalizing behavioral problems.
Methodological Issues
Although our methodology of image analysis was automated and unbiased, still this method is relatively new and more validation is needed. The skeletonization procedure appears conceptually simple and straightforward but, in practice, there are a number of issues that complicate the process. For example, this process applies the concept of gradient anisotropy from the center to the periphery of the white matter tract. In a given white matter tract the anisotropic value is at the maximum at its center and gradually decreases with distance away from the center. However, this assumption is not always true and is complicated by the fact that in several regions of white matter tract junction two or more crossing fiber tracts may converge or diverge. Under these circumstances, a more sophisticated FA projection technique is required [Smith et al., 2006]. This is particularly true in a small fiber bundle such as the SC due to its close proximity to the genu of the corpus callosum, at the posterior superior part of SC where the skeletonization protocol might have intermixed fibers from both these tracts. In addition, the morphology of the derived skeleton might also be altered in tracts which are close to the ventricle (e.g., fornix or posterior aspect of cingulum) because of the partial volume effect of cerebrospinal fluid. Thus, in this study, although we report small regions of ADC abnormality, there may be relatively large abnormal regions not identified by this method.
In this study, no sedation was used during the scanning procedure of both the TS and control subjects. Although rigorous quality control was used for motion correction and other imaging artifacts, it is still possible that some imaging artifacts might have confounded our results. In addition, although some TS subjects were taking medication, the ADC values between TS subjects on medication and those without medication showed no significant difference; however, a larger study controlling for specific medications would address potential effects of medications on DTI measurements.
Corticostriatal Pathway
Fibers from the various cortical regions project in a topographical manner to the corresponding mosaic surface of the striatum. In the cerebral white matter, these projecting axons form the various cortical regions converge into two separate pathways, the medial SC (Muratoff bundle), and the lateral EC and these pathways are separated by the anterior limb of internal capsule [Schmahmann and Pandya, 2006]. The SC consists of fibers that arise from mostly the dorsal and medial cortical areas (dorso‐lateral and dorso‐medial prefrontal area, supplementary motor area, cingulate gyrus, and dorsal and medial parietal lobe) and run parallel with the fronto‐occipital fibers, rostral to the genu of corpus callosum. After aggregating as the SC, it terminates in the head and body of the caudate nucleus. The EC appears to be strictly a corticostriatal fiber system and carries projections from the ventral and medial prefrontal cortex, ventral premotor cortex, precentral gyrus, the rostral superior temporal region, and the inferotemporal and preoccipital regions to terminate in a topographic manner mainly in the putamen but also in the head, genu, and tail of the caudate nucleus. Projections conveyed by the EC from the primary motor cortex are directed exclusively to the putamen.
Neuroimaging Findings
Many studies using various types of imaging have demonstrated a pivotal role of the basal ganglia in the pathophysiology of tics. For example, functional MRI studies have shown that during active tic suppression, the putamen, globus pallidus, and bilateral thalamus were activated [Peterson et al., 1998]. Several other neuroimaging studies have also shown involvement of both caudate and lentiform nuclei (striatum) in TS [Jeffries et al., 2002; Ludolph et al., 2006; Peterson et al., 2001, 2003]. However, no study has convincingly demonstrated direct involvement of white matter pathways linking the striatum with cortical regions in this disorder. This study, which used a noninvasive and unbiased method, has shown direct involvement of the corticostriatal projection tracts (SC and EC) along with the associated cortical regions in TS.
In this study, although both pathways (SC and EC) showed significant differences in the ADC values across groups, only ADC values from the left EC showed a significant correlation with tic severity scores. Lack of correlation between tic severity and ADC values of SC could be related to significant interference of this tract with the adjacent fronto‐occipital tract and the large corpus callosal fiber tracts. Similarly, the EC lies in close proximity to the extreme capsule and the projected skeleton values might have been significantly affected by it. This could account for our finding that only the anterior component of EC was identified as abnormal, and the posterior EC might have lost its exclusivity of containing only the cortostriatal projection fibers due to interference with the extreme capsule. On the other hand, the anterior component of the EC contains more corticostriatal projection fibers from the limbic cortex (ventro‐cortical surface) than the posterior EC component, which receives most of its projections from the superior‐temporal and other posterior cortical regions. Similarly, SC also contains mostly projection fibers form the dorsal cortical regions. In this study, ADC values measured from bilateral ventral frontal cortex, (orbit‐frontal cortex) and the left putamen of the TS subjects showed the most significant and extensive abnormal ADC values. Therefore, we suggest that the ventral frontal cortex, the putamen and the white matter pathway connecting these two gray matter regions, and the anterior EC are the most affected regions in TS subjects.
However, several studies have more specifically suggested involvement of dorsal cortical regions, and the caudate [Bohlhalter et al., 2006; Fahim et al., in press] while other studies have suggested involvement of ventral cortical surfaces and the putamen [Jeffries et al., 2002; Ludolph et al., 2006; Makki et al., 2008] or both [Peterson et al., 1998]. The corticostriatal projection fibers from dorsal cortical surfaces travel mostly through the medial SC white matter pathway. Although, in this study, the ADC values derived from dorsal cortical, caudate, and SC regions were not significantly correlated with tic symptoms like the ventral cortical regions and EC, we cannot totally exclude the possibility of involvement of SC and the associated dorsal cortical and caudate regions in the involvement of tic pathology—the lack of findings here may be related to methodological considerations. Indeed, axons from SC and EC pathways significantly cross over through the anterior limb of the internal capsule to end in caudate and putamen making it difficult to study it apart from EC. Furthermore, from Figure 4, it can be seen that the ADC values of caudate, dorso‐frontal, and cingulate gray matter regions were increased compared to the controls, albeit the difference did not reach significance. The most likely reason for the lack of between group differences in these gray matter regions is that the image co‐registration procedure in the VBA analysis may be suboptimal, and for regions especially such as caudate, the close proximity of the ventricles could severely affect the measured ADC values.
One of the possible mechanisms postulated in tic generation is dysfunction of the cortico‐striato‐thalamo‐cortical pathway. In the normal state, the frontal cortex exhibits tonic action on the striatum through the corticostriatal projections that serve to control striatal activity [Singer and Minzer, 2003]. In subjects with TS, the tonic action from the frontal lobe may be disturbed, leading to abnormal activity in the striatum resulting in pathological activation of the striato‐thalamo‐cortical pathway manifesting as tic symptoms. This notion is supported by findings of this study which show that diffusion abnormality in the corticostriatal projection from the frontal cortex was directly affected and correlated with tic symptoms. These abnormalities may be related to some specific neuronal injury in the frontal cortex affecting the axons from these neurons. These affected axons could undergo distal changes which we have measured as diffusion abnormalities in the white matter pathways. On the other hand, diffusion abnormalities were also seen in striatum mainly involving putamen (and possibly in caudate) suggesting that the changes in the distal axons were not only related to the frontal cortex, but also to the target striatum.
ADC Changes With Tic Severity
In our findings, the ADC values were abnormally increased in the distal part of the corticostriatal projection pathway compared to the controls. However, the correlation of the ADC values with the tic symptom in the TS subjects is negative, meaning the higher the ADC the less severe the symptom, and the lower the ADC the more severe the symptom. This apparently contradictory observation may be related to acute inflammation during a period of exacerbation of tic symptoms. As is well documented [Singer and Minzer, 2003; Swain et al., 2007], the tic symptoms have a chronic history and have a waxing and waning pattern. These repeated events over time could potentially cause a change in white matter tissue, causing the increased ADC findings in the TS subjects compared to the controls [Gass et al., 2001; Sener, 2000; Tievsky et al., 1999]. However, during a period of waxing, relatively lower ADC might result [Szabo et al., 2005; Yu and Tan, 2008]. It is also well known that patients with TS can voluntarily suppress their tics for brief periods. Therefore, in cases with severe tics, increased electrical activity and increased action of glutamate in the terminals of the corticostriatal projection could conceivably cause such decreases in ADC due to cellular swelling, as has been previously demonstrated [Sotak, 2004; Vargova et al., 2001]. Future studies are needed to determine whether the lower ADC is related to exacerbation of symptoms.
Acknowledgements
We thank Rosalie and Bruce Rosen for their generosity in supporting these studies. We also thank Dr. Diane Chugani, PhD and Dr. Csaba Juhasz, MD, PhD for their guidance in this study.
REFERENCES
- Ashburner J, Andersson JL, Friston KJ ( 1999): High‐dimensional image registration using symmetric priors. Neuroimage 9: 619–628. [DOI] [PubMed] [Google Scholar]
- Ashburner J, Friston KJ ( 2000): Voxel‐based morphometry—The methods. Neuroimage 11: 805–821. [DOI] [PubMed] [Google Scholar]
- Basser PJ, Mattiello J, LeBihan D ( 1994): Estimation of the effective self‐diffusion tensor from the NMR spin echo. J Magn Reson B 103: 247–254. [DOI] [PubMed] [Google Scholar]
- Behen M, Chugani HT, Juhasz C, Helder E, Ho A, Maqbool M, Rothermel RD, Perry J, Muzik O ( 2007): Abnormal brain tryptophan metabolism and clinical correlates in Tourette syndrome. Mov Disord 22: 2256–2262. [DOI] [PubMed] [Google Scholar]
- Behrens TE, Berg HJ, Jbabdi S, Rushworth MF, Woolrich MW ( 2007): Probabilistic diffusion tractography with multiple fibre orientations: What can we gain? Neuroimage 34: 144–155. [DOI] [PMC free article] [PubMed] [Google Scholar]
- Bohlhalter S, Goldfine A, Matteson S, Garraux G, Hanakawa T, Kansaku K, Wurzman R, Hallett M ( 2006): Neural correlates of tic generation in Tourette syndrome: An event‐related functional MRI study. Brain 129( Part 8): 2029–2037. [DOI] [PubMed] [Google Scholar]
- Cohen DJ, Brun RD, Leckman JF ( 1988): Tourette Syndrome and Tic Disorders: Clinical Understanding and Treatment. New York: Wiley. [Google Scholar]
- Como PG ( 2001): Neuropsychological function in Tourette syndrome. Adv Neurol 85: 103–111. [PubMed] [Google Scholar]
- Eapen V, Pauls DL, Robertson MM ( 1993): Evidence for autosomal dominant transmission in Tourette's syndrome. United Kingdom cohort study. Br J Psychiatry 162: 593–596. [DOI] [PubMed] [Google Scholar]
- Fahim C, Yoon U, Das S, Lyttelton O, Chen J, Arnaoutelis R, Rouleau G, Sandor P, Frey K, Brandner C, Evans AC: Somatosensory‐motor bodily representation cortical thinning in Tourette: Effects of tic severity, age and gender. Cortex (in press) doi:10.1016/j.cortex.2009.06.008. [DOI] [PubMed] [Google Scholar]
- Frey KA, Albin RL ( 2006): Neuroimaging of Tourette syndrome. J Child Neurol 21: 672–677. [DOI] [PubMed] [Google Scholar]
- Gass A, Niendorf T, Hirsch JG ( 2001): Acute and chronic changes of the apparent diffusion coefficient in neurological disorders—Biophysical mechanisms and possible underlying histopathology. J Neurol Sci 186 ( Suppl 1): S15–S23. [DOI] [PubMed] [Google Scholar]
- Good CD, Johnsrude IS, Ashburner J, Henson RN, Friston KJ, Frackowiak RS ( 2001): A voxel‐based morphometric study of ageing in 465 normal adult human brains. Neuroimage 14( 1 Pt 1): 21–36. [DOI] [PubMed] [Google Scholar]
- Harris K, Singer HS ( 2006): Tic disorders: Neural circuits, neurochemistry, and neuroimmunology. J Child Neurol 21: 678–689. [DOI] [PubMed] [Google Scholar]
- Hsu JL, Leemans A, Bai CH, Lee CH, Tsai YF, Chiu HC, Chen WH ( 2008): Gender differences and age‐related white matter changes of the human brain: A diffusion tensor imaging study. Neuroimage 39: 566–577. [DOI] [PubMed] [Google Scholar]
- Jeffries KJ, Schooler C, Schoenbach C, Herscovitch P, Chase TN, Braun AR ( 2002): The functional neuroanatomy of Tourette's syndrome: An FDG PET study III: Functional coupling of regional cerebral metabolic rates. Neuropsychopharmacology 27: 92–104. [DOI] [PubMed] [Google Scholar]
- Jiang H, van Zijl PC, Kim J, Pearlson GD, Mori S ( 2006): DtiStudio: Resource program for diffusion tensor computation and fiber bundle tracking. Comput Methods Programs Biomed 81: 106–116. [DOI] [PubMed] [Google Scholar]
- King MD, Gadian DG, Clark CA ( 2009): A random effects modelling approach to the crossing‐fibre problem in tractography. Neuroimage 44: 753–768. [DOI] [PubMed] [Google Scholar]
- Kramer H, Daniels C ( 2004): Pioneers of movement disorders: Georges Gilles de la Tourette. J Neural Transm 111: 691–701. [DOI] [PubMed] [Google Scholar]
- Ludolph AG, Juengling FD, Libal G, Ludolph AC, Fegert JM, Kassubek J ( 2006): Grey‐matter abnormalities in boys with Tourette syndrome: Magnetic resonance imaging study using optimised voxel‐based morphometry. Br J Psychiatry 188: 484–485. [DOI] [PubMed] [Google Scholar]
- Makki MI, Behen M, Bhatt A, Wilson B, Chugani HT ( 2008): Microstructural abnormalities of striatum and thalamus in children with Tourette syndrome. Mov Disord 23: 2349–2356. [DOI] [PubMed] [Google Scholar]
- Mell LK, Davis RL, Owens D ( 2005): Association between streptococcal infection and obsessive‐compulsive disorder, Tourette's syndrome, and tic disorder. Pediatrics 116: 56–60. [DOI] [PubMed] [Google Scholar]
- Mori S, Crain BJ, Chacko VP, van Zijl PC ( 1999): Three‐dimensional tracking of axonal projections in the brain by magnetic resonance imaging. Ann Neurol 45: 265–269. [DOI] [PubMed] [Google Scholar]
- Pauls DL ( 2003): An update on the genetics of Gilles de la Tourette syndrome. J Psychosom Res 55: 7–12. [DOI] [PubMed] [Google Scholar]
- Peterson BS, Skudlarski P, Anderson AW, Zhang H, Gatenby JC, Lacadie CM, Leckman JF, Gore JC ( 1998): A functional magnetic resonance imaging study of tic suppression in Tourette syndrome. Arch Gen Psychiatry 55: 326–333. [DOI] [PubMed] [Google Scholar]
- Peterson BS, Staib L, Scahill L, Zhang H, Anderson C, Leckman JF, Cohen DJ, Gore JC, Albert J, Webster R ( 2001): Regional brain and ventricular volumes in Tourette syndrome. Arch Gen Psychiatry 58: 427–440. [DOI] [PubMed] [Google Scholar]
- Peterson BS, Thomas P, Kane MJ, Scahill L, Zhang H, Bronen R, King RA, Leckman JF, Staib L ( 2003): Basal Ganglia volumes in patients with Gilles de la Tourette syndrome. Arch Gen Psychiatry 60: 415–424. [DOI] [PubMed] [Google Scholar]
- Qiu M, Li Q, Liu G, Xie B, Wang J: Voxel‐based analysis of white matter during adolescence and young adulthood. Brain Dev 2000. (in press) doi:10.1016/j.braindev.2009.08.006. [DOI] [PubMed] [Google Scholar]
- Schmahmann JD, Pandya DN ( 2006): Fiber Pathways of the Brain. New York: Oxford University Press. [Google Scholar]
- Sener RN ( 2000): Rasmussen's encephalitis: Proton MR spectroscopy and diffusion MR findings. J Neuroradiol 27: 179–184. [PubMed] [Google Scholar]
- Singer HS, Minzer K ( 2003): Neurobiology of Tourette's syndrome: Concepts of neuroanatomic localization and neurochemical abnormalities. Brain Dev 25 ( Suppl 1): S70–S84. [DOI] [PubMed] [Google Scholar]
- Smith SM, Jenkinson M, Johansen‐Berg H, Rueckert D, Nichols TE, Mackay CE, Watkins KE, Ciccarelli O, Cader MZ, Matthews PM, Behrens TE ( 2006): Tract‐based spatial statistics: Voxelwise analysis of multi‐subject diffusion data. Neuroimage 31: 1487–1505. [DOI] [PubMed] [Google Scholar]
- Sotak CH ( 2004): Nuclear magnetic resonance (NMR) measurement of the apparent diffusion coefficient (ADC) of tissue water and its relationship to cell volume changes in pathological states. Neurochem Int 45: 569–582. [DOI] [PubMed] [Google Scholar]
- Swain JE, Scahill L, Lombroso PJ, King RA, Leckman JF ( 2007): Tourette syndrome and tic disorders: A decade of progress. J Am Acad Child Adolesc Psychiatry 46: 947–968. [DOI] [PubMed] [Google Scholar]
- Swedo SE, Leonard HL, Garvey M, Mittleman B, Allen AJ, Perlmutter S, Lougee L, Dow S, Zamkoff J, Dubbert BK ( 1998): Pediatric autoimmune neuropsychiatric disorders associated with streptococcal infections: Clinical description of the first 50 cases. Am J Psychiatry 155: 264–271. [DOI] [PubMed] [Google Scholar]
- Szabo K, Poepel A, Pohlmann‐Eden B, Hirsch J, Back T, Sedlaczek O, Hennerici M, Gass A ( 2005): Diffusion‐weighted and perfusion MRI demonstrates parenchymal changes in complex partial status epilepticus. Brain 128 ( Part 6): 1369–1376. [DOI] [PubMed] [Google Scholar]
- Tievsky AL, Ptak T, Farkas J ( 1999): Investigation of apparent diffusion coefficient and diffusion tensor anisotrophy in acute and chronic multiple sclerosis lesions. Am J Neuroradiol 20: 1491–1499. [PMC free article] [PubMed] [Google Scholar]
- Vargova L, Jendelova P, Chvatal A, Sykova E ( 2001): Glutamate, NMDA, and AMPA induced changes in extracellular space volume and tortuosity in the rat spinal cord. J Cereb Blood Flow Metab 21: 1077–1089. [DOI] [PubMed] [Google Scholar]
- Yu JT, Tan L ( 2008): Diffusion‐weighted magnetic resonance imaging demonstrates parenchymal pathophysiological changes in epilepsy. Brain Res Rev 59: 34–41. [DOI] [PubMed] [Google Scholar]