

Abstract
The Bacillus fragment, belonging to a class of high-fidelity polymerases, demonstrates high processivity (adding ∼115 bases per DNA binding event) and exceptional accuracy (1 error in 106 nucleotide incorporations) during DNA replication. We present analysis of structural rearrangements and energetics just before and during the chemical step (phosphodiester bond formation) using a combination of classical molecular dynamics, mixed quantum mechanics molecular mechanics simulations, and free energy computations. We find that the reaction is associative, proceeding via the two-metal-ion mechanism, and requiring the proton on the terminal primer O3′ to transfer to the pyrophosphate tail of the incoming nucleotide before the formation of the pentacovalent transition state. Different protonation states for key active site residues direct the system to alternative pathways of catalysis and we estimate a free energy barrier of ∼12 kcal/mol for the chemical step. We propose that the protonation of a highly conserved catalytic aspartic acid residue is essential for the high processivity demonstrated by the enzyme and suggest that global motions could be part of the reaction free energy landscape.
Keywords: DNA polymerase, DNA replication, umbrella sampling, collective modes, quantum mechanics molecular mechanics
Introduction
The accurate replication and repair of DNA are vital to all organisms. DNA polymerases are critical enzymatic effectors of these processes, yet a detailed description of the molecular mechanisms of their fidelity with native and damaged DNA templates remains incomplete. The fidelity mechanisms in polymerases have a direct bearing on formation of mutational hot spots in the genome and have immense biomedical implications for cancers, neurological aberrations, and premature aging.1
DNA polymerases serve a dual role: efficiency/versatility in handling different nucleotides and fidelity in incorporating the correct nucleotide, which necessitates the use of subtle and complex molecular paradigms in their machinery. Closed and open conformations of polymerases have been recorded in structural studies based on which an induced-fit mechanism2,3 between the DNA-bound polymerase and the correct incoming nucleotide substrate is thought to lead to a “closed” tightly bound complex which is catalytically competent for a phosphodiester bond formation4; on the other hand, an incorrect incoming nucleotide is thought to lead to a DNA/polymerase complex with misaligned components.
DNA polymerase I large fragment from a thermostable strain of Bacillus stearothermophilus (Bacillus fragment or BF, shown in Fig. 1) is a highly processive replicative polymerase (112 nucleotides incorporated per DNA binding event) showing extensive structural homology with the Klenow fragment from E. coli.5 It lacks the 5′→3′ exonuclease and 3′→5′ proofreading exonuclease activities. BF polymerase–DNA structures have been solved for up to 6 base pair extensions for correct6 and incorrect mismatch7 extensions, which serve as reliable starting points for modeling studies. In addition to its extensive structural characterization, BF has the ability to misincorporate nucleotides with comparable efficiency to correct incorporation when encountering an oxidative lesion. This makes BF a well-characterized yet important system for study, as an in-depth analysis of the lesion-bypass mechanisms in BF can prove to be important for our understanding of lesion bypass in error-prone eukaryotic polymerases.
Figure 1.
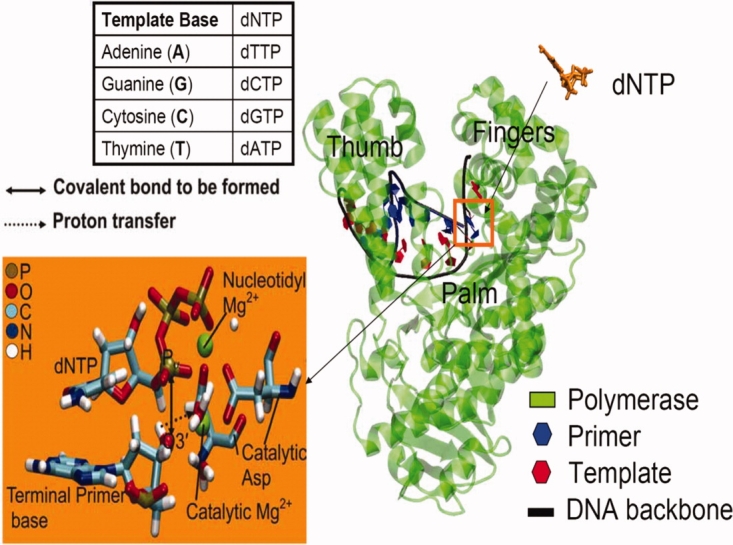
The bacillus fragment (BF) complexed with its DNA substrate and incoming deoxynucleotide triphosphate (dNTP); we study the incorporation of dCTP opposite a guanine (G) template base. The inset shows a magnified view of the catalytic site. The phosphoryl transfer reaction involves the formation of a covalent bond (solid line) between the α-phosphorous (Pα) of the incoming dNTP and O3′ oxygen of the terminal primer base, before which a proton present on O3′ has to transfer (dashed line) possibly to a highly conserved aspartic acid residue. [Color figure can be viewed in the online issue, which is available at http://www.interscience.wiley.com.]
Here, we propose to computationally delineate how the molecular machinery of the BF polymerase system operates during the chemical step, that is, along the reaction pathway of phosphoryl transfer during nucleotide incorporation. Nucleotide incorporation via the “two-metal-ion” catalyzed phosphoryl transfer mechanism is common to several DNA and RNA polymerases8; at the catalytic site of BF (see inset of Fig. 1), one divalent metal (Mg2+) ion coordinates the three phosphates (nucleotide binding) of the incoming dNTP. A second metal (Mg2+) ion positioned between the α-phosphate (Pα) of the incoming nucleotide and the hydroxyl terminus (O3′H3T) of the DNA primer facilitates the inline nucleophilic attack on Pα. Computational study by Fostergill suggests that the two Mg2+ ions collectively serve a crucial role of electrostatic stabilization of the active site9 and together with three acidic residues, which are highly conserved in polymerases (D830, D653, and D865 in BF), stabilize the catalytic site geometry in the reaction-competent closed or active state. There is clear experimental and theoretical evidence that the resulting attack of the nucleophilic oxygen anion (O3′) on the target phosphorous (Pα) proceeds via a trigonal-bipyramidal transition state.8,10,11 Indeed the conformation close to the trigonal-bipyramidal geometry (referred to as the “ideal two-metal-ion geometry”) has been recently captured in structural studies,10,11 which is saliently characterized by a distance between the nucleophilic oxygen and the target phosphorous of ∼2 Å.
Computational delineations of transition state structures and reaction intermediates for DNA pol I,9 T7 DNA pol,12 correct incorporations in the X-family polymerase β,13–17 incorrect incorporations in polymerase β,13,18,19 the Y-family, low fidelity polymerase Dpo4,20 hammerhead ribozyme,21 and the F1-ATPase22,23 have provided detailed mechanistic insights on the associative mechanism for the phosphoryl transfer pathway. The method we have used in this work (see Section “Materials and Methods”) also uses quantum mechanics molecular mechanics (QMMM) simulations like the majority of the works described earlier. However, our approach is closest to that described in Ref. 21 in that we have relied on a delineation of the free energy landscape of the chemical step using QMMM umbrella sampling simulations and considered the effect of delocalized modes in shaping the free energy landscape using classical umbrella sampling simulations.
The significance of our approach can be appreciated by noting that in addition to catalytic-site dynamics, long range (delocalized) motions of the enzyme and substrates could couple to define the free energy landscape.24–27 There is evidence that such a coupling of fast and slow dynamical modes may play a significant role in DNA polymerase mechanisms. Pioneering single molecule studies of polymerases replicating DNA stretched under differing tensions28,29 showed that the replication rate is sensitive to forces exerted on the template strand. That the applied force on the DNA affects the rate limiting step highlights the importance of coupling between polymerase and DNA degrees of freedom. Indeed, in recent studies, we identified such coupled motions of the enzyme–substrate complex with significant correlations between fluctuations of the catalytic reactive distances and delocalized collective modes involving the DNA motions and hypothesized that the coupling could exert a significant influence on the reaction free energy landscape.30,31 Hence, the focus of this article is on delineating the pathways and the energetics associated with the chemical step of correct nucleotide incorporation catalyzed by BF, the effect of protonation states on the reaction pathways, and the involvement of collective modes in defining the reaction free energy landscape.
Results
Effect of protonation states on the active-site geometry
Based on our recent report on the free energy landscape for preorganization of the catalytic site for DNA replication in BF,30 we derived conformations corresponding to the active state of a ternary complex of BF/DNA/dCTP (where the incoming nucleotide dCTP pairs with a guanine base of the DNA template strand) and subjected them to quantum mechanics molecular mechanics (QMMM) simulations (see Section “Materials and Methods”). Table S1 in Supporting Information compares the ground state QMMM geometries with the MM results and the crystal structure. The catalytic site geometry in the ground state resulting from the QMMM simulations is better organized in comparison to that resulting from classical molecular mechanics (MM), with reductions in the O3′-Pα and O3′-catalytic Mg2+ distances, (see inset in Fig. 1). An alignment of the terminal primer hydroxyl hydrogen (H3T) to within 2.83 Å from D830:O1δ and 3.16 Å of dCTP:O1α suggests two possible routes for deprotonation of O3′ oxyanion before inline nucleophilic attack. Constrained QMMM optimizations which further reduce the O3′-Pα and O3′-catalytic Mg2+ distances to ∼2.0 Å indicated a shift in orientation of H3T toward the O1δ oxygen of D830, suggesting a pathway of proton abstraction by the conserved catalytic aspartic acid residue. Such possibilities along with deprotonation to aqueous solution were examined in three recent simulation studies of polymerases12–14: in T7 DNA pol,12 energetic analysis showed the most likely pathway for the proton transfer was from O3′ to one of the catalytic aspartic acid residues with an activation barrier of 11 kcal/mol. For pol β, a similar proton transfer pathway was illustrated to occur from O3′ either directly or mediated by two water molecules to one of the catalytic aspartic acid residues.13,14,16,17 Based on the exploration of the protonation states of titratable side chains in the catalytic site, namely D653, D830, and D865 (see Supporting Information Section S1.2), we focused on two models to compute the reaction paths: Model I (O3′ protonated, D830 unprotonated), and Model III (O3′ protonated, D830 protonated) of the BF/DNA/dCTP ternary complex.
Protonation state-dependent multiple pathways for phosphoryl transfer
To describe the sequence of events including the associated free energy landscape during the phosphoryl transfer reaction for models I and III of the BF/DNA/dCTP, we carried out umbrella sampling simulations using QMMM MD trajectories and using multiple reaction coordinates (see Section “Materials and Methods”). The choice of multiple reaction coordinates including some that describe proton transfer was motivated by recent studies.21,32 We obtained complete reaction pathways for both models along with the identification of transient intermediates and the transition states; the schematics of the reaction pathways as obtained from our umbrella sampling studies for both models are depicted in Figure 2. For both pathways, the H3T proton attached to the A: O3′ transfers to the nearest aspartic acid residue D830 spontaneously (i.e., without explicit constraints on the H3T proton). Based on this, we rule out the alternative possibility of H3T proton transferring to dCTP:O1α. In both models, the final step of A:O3′-dCTP: Pα bond formation and cleavage of the dCTP:Pα-dCTP:O3α bond to liberate the pyrophosphate product takes place only after the H3T proton is transferred to the dNTP tail. In model III, the transfer is indirect as it is the extra proton on D830 which transfers to the dNTP tail while the H3T proton is transferred to D830. In model I, the H3T proton itself transfers to the dNTP tail after hopping to D830 as an intermediate step. We next describe the free energy surfaces for both models. The reaction pathway in model III (the most stable model for the ground state of BF) was seen to be more energetically favorable relative to model I and will be described first.
Figure 2.
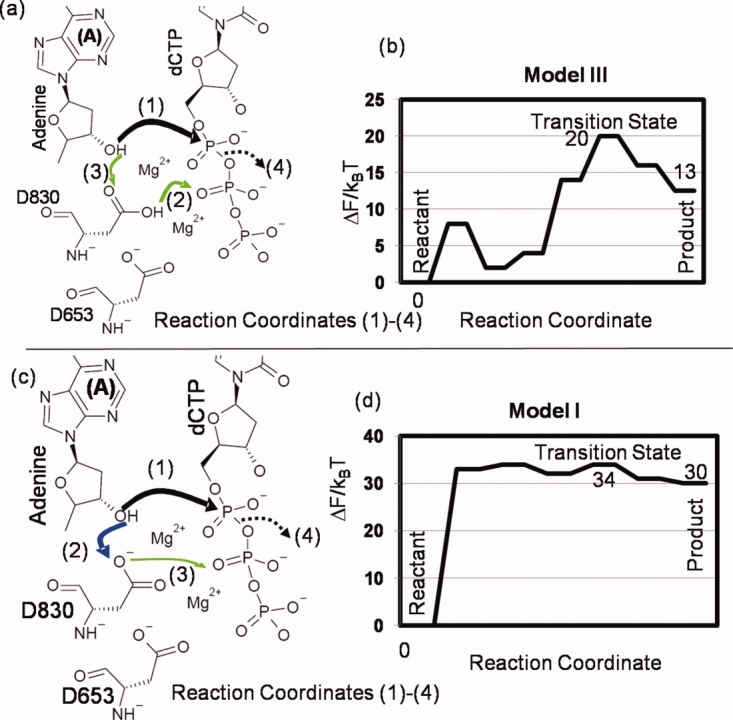
Schematics of the reaction pathway for catalysis (a) and (c). An effective 1-d free energy landscape along a generalized coordinate defined along the minimum free energy path (b) and (d) for two different models: model III (top row) and model I (bottom row). In (a) and (c), the newly forming O3′-Pα bond and cleaving Pα-O3α bond are illustrated by solid and dashed black lines, respectively. The other arrows indicate different proton transfer steps. [Color figure can be viewed in the online issue, which is available at http://www.interscience.wiley.com.]
The free energy surfaces for phosphoryl transfer in model III are depicted in Figure 3. For the reactant state: the A:O3′-dCTP:Pα distance is 2.75 Å, both the D830:O2δ and A:O3′ oxyanions are protonated and the dCTP:Pα-dCTP: O2β distance is 1.7 Å. As the O3′-Pα distance reduces to 2.3 Å, there is a transfer of the proton from the D830:O2δ position to the O2β oxygen in the dCTP phosphate tail. Both steps proceed concurrently and the 2-d free energy landscape is shown in Figure 3(a). A further lowering of the O3′-Pα distance [Fig. 3(b)] triggers the shift of the H3T proton on the terminal primer hydroxyl to the D830:O1δ oxygen [Fig. 3(c)] and an increase in the nucleophilic attack angle O3δ-Pα-O3′ from 172 to 180° leading to the formation of the transition state (TS), that is, the trigonal-bipyramidal geometry and the perfect in-line attack geometry corresponding to an associative mechanism of phosphoryl transfer (see Supporting Information Fig. S1 and caption); we classify this mechanism as associative based on geometry alone, that is, the O3′-Pα and Pα-O3α distances at the transition state are in the range 1.9–2.1  . The product is formed when the pyrophosphate group (PPi) dissociates [Fig. 3(d)]. The reaction free energies depicted in shaded boxes in Figure 3 indicate the free energy changes relative to the reactant state, as one travels along the reaction coordinate. The overall free energy barrier of the chemical step is 20 kBT and the free energy of the product relative to the reactant is +12.5 kBT. We note that the transfer of the H2δ proton to PPi creates an additional positive charge on the dNTP pyrophosphate moiety, weakening the O3α-Pα bond and coupled to the close proximity of the attacking primer O3′ nucleophile, leads to the cleavage and subsequent formation of the PPi. The barrier of 20 kBT is lower than the barrier for the overall nucleotide incorporation step inferred from enzyme kinetics (25 kBT) which is consistent with the notion that for the correct incorporation, the chemical step is not rate limiting. The free energy of the product relative to the reactant is positive because our calculations do not include the closed to open conformational change and the PPi dissociation: these steps are expected to reduce the free energy to make the overall reaction cycle favorable.
Figure 3.
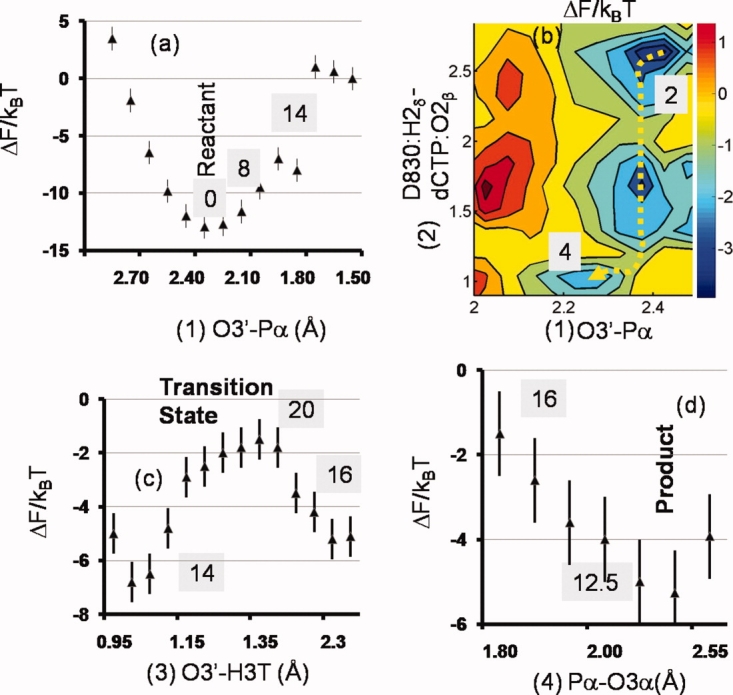
1-d and 2-d free energy surfaces for model III obtained from umbrella sampling simulations. The surfaces are labeled in chronological order (a)–(d) as the reaction proceeds from reactant to product. [Color figure can be viewed in the online issue, which is available at http://www.interscience.wiley.com.]
The free energy surfaces for model I are shown in Figure 4. For the reactant state: the A:O3′-dCTP:Pα distance is 2.75 Å, the A:O3′ oxyanions are protonated and the dCTP:Pα-dCTP: O2β distance is 1.7 Å. As the nucleophilic attack (O3′-Pα) distance is decreased below 2.0 Å [Fig. 4(a)], the terminal primer hydroxyl group deprotonates and the H3T proton transfers to the proximal aspartic acid residue D830:O1δ [Fig. 4(b)]. At this stage, the release of constraints results in the return of the system to the reactant state, (i.e., the proton transfers back to the terminal primer A) suggesting that the system has not surpassed the TS. With further slight reductions in O3′-Pα distance, the H3T proton migrates first to D830:O1δ and then to dCTP:O1β. This signifies the formation of the TS (see Supporting Information Fig. S1 and caption) corresponding to an associative mechanism of phosphoryl transfer as in model III. The H3T proton subsequently transfers to the O2β oxygen of the dissociating pyrophosphate (PPi). In the landscape for model I, the overall free energy barrier of the chemical step is 35 kBT, and the free energy of the product relative to the reactant is +30 kBT. The barrier of 35 kBT is significantly higher than the barrier for the overall nucleotide incorporation step inferred from enzyme kinetics (25 kBT), strongly suggesting that the pathway in model I and the associated protonation state of BF are not the preferred pathway/state of BF catalysis of correct nucleotide incorporation.
Figure 4.
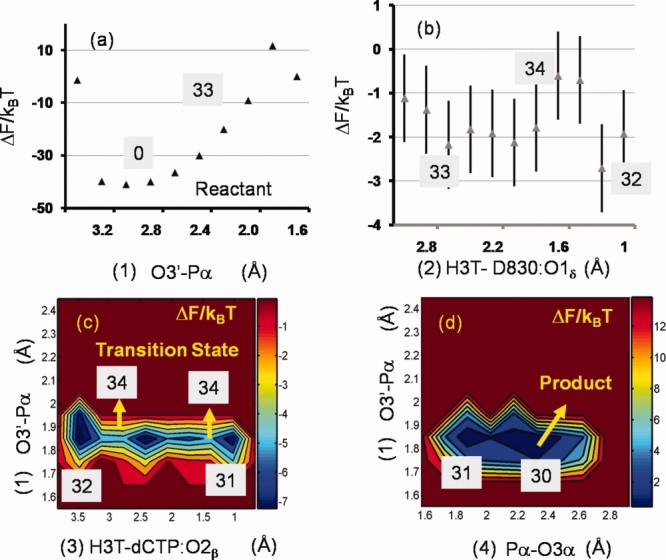
1-d and 2-d free energy surfaces for model I obtained from umbrella sampling simulations. The surfaces are labeled in chronological order (a)–(d) as the reaction proceeds from reactant to product. Error bars, when not visible, are smaller than the size of the symbols. [Color figure can be viewed in the online issue, which is available at http://www.interscience.wiley.com.]
Influence of collective modes on the reaction free energy landscape
We note that the coordinates we have chosen are, at best, approximate surrogates to the exact reaction coordinate, which is very complex and multi (high) dimensional, and hence, our choices can lead to over or underestimation of the barrier height.32 Indeed, in previous work,30,31 we showed that for correct nucleotide incorporation several delocalized modes of the protein–DNA complex characterized in particular by the top three principal component (PC) eigenvectors ξm, m = 1, 2, 3, are strongly correlated with catalytic site reactive distances da (O3′-Pα distance) and db (O3′- catalytic Mg2+ distance). To illustrate that such coupling can influence the free energy landscape of the chemical step, we compare the free energy cost of reducing the reactive distances da and db by traveling along the principal modes ξ1, ξ2, and ξ3 to that obtained by directly reducing da and db in the context of MM simulations. The latter results (shown in Fig. 5 bottom left) were already available from our previous work.30
Figure 5.

(a) A comparison of free energy change with displacement a1 along principal component mode ξ1 as obtained from umbrella sampling simulations (blue) and using the spring constant K1 resulting from quasiharmonic analysis (black). (b) Free energy surface (ΔUUMB in units of kBT) obtained from classical umbrella sampling runs using the O3′-Pα and O3′-catalytic Mg2+ distances as reaction coordinates. The lines of filled green, yellow, and red squares represent the change in the two reaction coordinates for a displacement along the top three PC modes ξ1,ξ2, and ξ3, respectively. The reference geometry is the minimum free energy state (white square marked 1.5 kBT) and each mode is displaced by amplitudes yielding the maximum simultaneous reduction of both reaction coordinates (white squares marked 5.1 kBT, 3.4 kBT and 6.1 kBT). (c) Free energy change ΔUPC with displacement an (n = 1, 2, 3) along the top three PC modes ξ1,ξ2, and ξ3 as obtained using their respective spring constants K1, K2, and K3 (resulting from quasiharmonic analysis). (d) comparison of free energy change ΔUUMB to ΔUPC for achieving the same reduction in distances da and db.
Each eigenvector ξm is a unit-normal vector representing a collective mode of motion in the active site region of the ternary complex, with a quasiharmonic spring constant Km = kBT/λm,33 where λm is the eigenvalue for mode m. Displacing ξm with an amplitude am will lead to a change in the geometry R(0) of the active site region31 given by R(am) − R(0) = amξm, and with an associated free energy cost of 0.5*Km*(am).2 We validate this estimate by performing umbrella sampling along the slowest mode ξ1, wherein the amplitude of the mode a1 is varied so as to decrease da from 3.62 Å to 3.17 Å. Figure 5(a) shows a plot of free energy change ΔUPC as a function of the amplitude along ξ1. The energy change for a harmonic oscillator with spring constant K1 = 2.17*10−2 kcal/mol/Å2 is given by the solid black curve, which is in excellent agreement with the trend obtained through umbrella sampling. Therefore, we calculate the free energy cost of traversing the reaction coordinates da and db for modes ξm (m = 1, 2, 3) directly using their respective quasiharmonic spring constants, see Figure 5(b). The lines of filled green, yellow, and red squares in Figure 5(b), superimposed on the classical free energy landscape of reaction coordinates da and db, show the change in da and db for a displacement along the top three principal modes, whereas the white square boxes show the initial values of da and db at am = 0 (m = 1, 2, 3) and final values corresponding to amplitudes a1 = −24 Å, a2 = −16 Å, a3 = +11 Å, marked by vertical dashed lines in Figure 5(c); also shown are the corresponding free energies UUMB at these coordinates. Figure 5(b) compares ΔUUMB, the free energy change expected for a direct reduction of da and db, (i.e., from the free energy landscape in Figure 5(b) without the inclusion of the principal modes) with ΔUPC, the free energy change to achieve the same degree of catalytic site reorganization specified in terms of the distances da and db by moving along a PC mode. The free energy change obtained by traversing modes 1 and 2 is comparable to the corresponding change by reducing da and db, directly; however, mode 3 reduces the barrier for preorganization significantly, by 3.1 kBT or 1.86 kcal/mol. In general, a linear combination of PCs will provide an optimal lowering of the free energy barrier, and hence, the analysis we have presented in this section is simplistic. Nevertheless, our results imply that collective modes can exert a significant influence in defining the reaction free energy landscape.
Discussion
Using free energy studies based on a combination of classical molecular dynamics (MD) and mixed quantum mechanics molecular mechanics simulations, we have presented analysis of the energetics and structural rearrangements involved in the correct nucleotide incorporation by BF, just before and during, the chemical step. Based on the protonation states of conserved aspartic acid residues at the catalytic site, we considered reaction pathways in two models (models I and III). The pathways in both models were found to proceed through an associative two-metal-ion mechanism (based on the geometry of the transition state) involving a direct in-line attack, requiring the proton on the terminal primer O3′ to transfer to the pyrophosphate tail of the incoming nucleotide before the formation of the pentacovalent transition state with a perfect trigonal-bipyramidal geometry (see Supporting Information snapshots in Fig. S1). We compute the overall free energy barrier of the chemical step to be 20 kBT (as reflected in calculations involving model III), which is lower than the barrier for the overall nucleotide incorporation step inferred from enzyme kinetics (25 kBT). This is consistent with the notion that for the correct incorporation, the chemical step is not rate limiting; indeed, as described by pioneering enzymology studies of Benkovic et al., the rate-limiting step involves the precatalytic conformational change that brings the polymerase system from an inactive (open) to an active (closed) state.3,34 Nevertheless, the energetics of the chemical step in model III is comparable to that for T7 DNA pol computed by Warshel and coworkers12 and reflects the ability of BF to catalyze nucleotide incorporation even in a crystal. In contrast, the overall free energy barrier of the chemical step for model I is 35 kBT, (significantly higher than the 25 kBT barrier for the overall nucleotide incorporation), strongly suggesting that the pathway in model I is not preferred for correct nucleotide incorporation. The overall mechanism we have delineated in BF is consistent with the large body of mechanisms proposed in other related polymerase systems established through both theoretical and experimental studies.3,12–21,35,36
From a design perspective, we reason that the mechanism in model III is optimal: for a processive enzyme such as BF, which can incorporate up to 115 nucleotides per DNA binding event, it would appear that protonation/deprotonation of the conserved D830 and subsequent transfer of the proton to the departing pyrophosphate will hamper the efficiency of the repeated cycles of nucleotide incorporation as the proton diffusion and cycling can become rate limiting. The pathway in model III provides an elegant respite by replenishing the proton on D830 (through the proton transfer from the O3′ of the terminal primer to D830) as the protonated D830 loses its proton to the departing PPi.
Using classical free energy simulations, we have explored the influence of collective DNA-polymerase modes on the free energy landscape for traversing along the in-line attack distance in the active site and suggest that a complete depiction of the free energy landscape likely involves collective modes. Based on PCA on the active site, we further infer that the atomic motions in the DNA primer and template strands which constitute the top PC modes are strongly coupled to motions of atoms in the two O-helices belonging to the polymerase finger domain (see Supporting Information Fig. S2 and Table S3). Three of the polymerase residues, R615, Q797, and H829, which show significant correlation with DNA primer and template strands (see Supporting Information Table S3), have been shown in previous studies to participate in the catalytic activity of the polymerase,37 with a mutation of any one of these residues greatly reducing polymerase–DNA binding. Experiments have proposed a role for a fourth residue, Y714, in stabilizing the template strand base paired opposite the incoming nucleotide in the closed (active) state of the polymerase,38 which intriguingly enough, also shows significant correlations with the DNA template strand (Supporting Information Table S3). The presence of significant correlation between the polymerase residues and the DNA (as identified in Supporting Information Table S3) coupled with stacking interactions between the adjacent base pairs, provide a molecular basis for the possible coupling between the polymerase fingers and the catalytic site. Hence, it is reasonable to speculate that the polymerase uses a linear combination of such collective modes to preorganize the catalytic site and optimizes the free energy landscape during the catalytic step resulting in a lower free energy cost of reaching the transition state in comparison to the computed value of 20 kBT we have reported. A quantitative estimate of the reduction in the free energy cost can only be obtained by including the slow modes in QMMM calculations using efficient long-time sampling approaches,39–43 which we have not attempted.
The suggested coupling machinery can be validated using force-spectroscopy experiments.31 The predicted effects of protonation states on the reaction pathway can be validated using pH titration and NMR experiments. The paradigms highlighting the significance of the chemical environment (i.e., protonation states) and the role of the delocalized modes can help provide additional molecular insight into the residues critical for DNA replication in cognate settings. Role of such factors in noncognate environments such as incorrect incorporation or incorporation past damaged DNA bases is very important because the chemical step indeed becomes rate limiting in such scenarios.3,31 Thus, this study sets the stage for interesting avenues for future theoretical and experimental work in noncognate systems with important biomedical consequences.
Materials and Methods
MD and quantum mechanics molecular mechanics simulations
A ternary complex of BF/DNA/dNTP (explicitly solvated) with correct dCTP opposite guanine G (or G:dCTP) was constructed as reported in our prior studies,30,31 see Supporting Information Sections S1.1–1.4 and Table S1 in Supporting Information methods for a more detailed description. Protonation states of distal titratable residues were chosen simply based on individual pKa values in aqueous solution at a pH 7.0 (see Supporting Information Section S1.1), while those for the conserved catalytic site aspartic acid residues and the nucleophilic group in the active site (D653, D865, D830, and O3′ of the terminal base of the DNA primer strand) were determined using a Poisson–Boltzmann approach (see Supporting Information Section S1.2). We constructed different model systems for different protonation states of the aspartic acid residues (in these models, the terminal base of the primer strand was always capped as O3′H) — Model I: all three aspartic acid residues unprotonated; Model II: D653 protonated; Model III: D830 protonated; and Model IV: D865 protonated. Our calculations revealed that Models I and III were most stable (see Supporting Information Section S1.2).
Classical MD production trajectories (10 ns) were obtained for these two systems after equilibration protocols and the last 5 ns was used for further analysis. Starting structures for the quantum mechanics molecular mechanics (QMMM) calculations were obtained from the last 5 ns of classical MD production runs of solvated BF/DNA/dNTP ternary complexes. The system size was reduced to ∼15,000 atoms by excluding all solvent (water) molecules greater than 3.0 Å away from the protein, dNTP, and MG2+ ions. The quantum (QM) region includes the pyrophosphate moiety of the dNTP, the sugar of the terminal primer A, parts of the catalytic aspartic acid residues (D830 and D653), MG2+ ions, and two bound water molecules at the catalytic site, a total of 64 atoms (including 6 link atoms, see below). This region was treated using DFT (B3LYP functional). We used the Gaussian basis set 6–31G for all equilibration runs and 6–31G* for the umbrella sampling runs, see Section “Influence of collective modes on the reaction free energy landscape.” The MM region was treated using the CHARMM27 force field.44 As the boundary between the QM and MM regions cuts through covalent bonds, we used the single link atom procedure to satisfy valences of broken bonds. Electrostatic terms involving the MM host atoms that connect to the QM region were excluded from the Hamiltonian. We have extensively explored this choice of the QMMM region (including sensitivity to the size of the QM region, and the functional/basis set combination in our prior studies of closely related systems13,21,45; others have validated the choice of the link atom.46 The system was first subjected to 1200 steps of the adopted basis Newton-Raphson (ABNR) minimization and subsequently 10 ps constant temperature production run using 1 fs timestep of integration.
Umbrella sampling
As model III (O3′ protonated, D830 protonated) shows the most stable ground state followed by model I (O3′ protonated, D830 unprotonated), see Supporting Information Section 1.2 and Table S2, we focused on these two models to compute the reaction paths. The free energy profile for the phosphodiester bond formation in models I and III was explored using multidimensional umbrella sampling. Through several restrained dynamics simulations harvested with a QMMM Hamiltonian (a higher 6–31G* basis set was used for the QM region here to describe the phosphorous chemistry), we performed umbrella sampling and explored a set of five distances as reaction coordinates for each model. For model I: terminal primer adenine O3′-dCTP Pα (da); terminal primer adenine O3′-Catalytic Mg2+ (db); proton H3T-dCTP:O1α (dc); proton H3T-dCTP:O2β (dd); and dCTP:O3α-dCTP Pα (de). For Model 3, terminal primer adenine O3′-dCTP Pα (da); O3′-catalytic Mg2+ (db); proton D830:H2δ-dCTP:O2β (dc); O3′-proton H3T (dd); and dCTP:O3α-dCTP Pα (de). We apply a harmonic restraint to each reaction coordinate di which adds a new potential bias 0.5*Ki*(di − di0)2 to the QMMM Hamiltonian. Here Ki is the force constant of the coordinate di and di0 are the reference value around which the coordinate di is restrained. By varying the offset of the restrained potential in steps of 0.1–0.5 Å and the force constant Ki, (see Supporting Information Section S1.3 for a detailed description as we introduced variability in our choice of Ki in certain windows), such as to obtain overlapping windows, we effected the transition of the system from reactant to the product. At each window, we performed 100 steps of energy minimization using the steepest-descent (SD) method followed by 1.3 ps of Langevin dynamics at 300 K of which 0.5–1 ps of data obtained using Ki = 20 kcal/mol/Å2 was used in the actual processing of the free energy depending on convergence of the sample in the window. Data from the different simulation windows were then combined to construct unbiased probability distributions and free energy surfaces by using the WHAM algorithm.47 The error bars were estimated by running four independent runs for a few representative windows.
For each model, the total number of windows ranged from 40–50, and hence, the aggregate length of the QMMM trajectories amounted to ∼50–80 ps per model. As we harvested these trajectories in a parallel environment of 32–64 processors running Linux (each node with a clock speed of 3.2 GHz), we logged a throughput of 1 ps/day for our system. Hence, the total CPU hours for the production runs of the umbrella sampling amounted to 75,000–1,00,000 per model and the wall clock time amounted to ∼50–70 days per model. Data from the different windows of the umbrella sampling runs were combined using the weighted histogram analysis method (WHAM)47 to project the potential of mean force (free energy density) along the a priori chosen set of reaction coordinates from which free energy changes were calculated by numerical integration.
Umbrella sampling along the PCs
Principal component analysis (PCA)48 of the MD simulations was performed on a subsystem of the protein–DNA complex to obtain a set ξ= (ξ1, ξ2,…,ξ3N−6) of orthogonal eigenvectors (or PCs) with eigenvalues λ= (λ1, λ2,…,λ3N−6) sorted in descending order, that is, λ1>λ2,…,λ3N−7>λ3N−6. The subsystem included the region around the catalytic geometry (denoted as the active site region) which included all heavy atoms of the incoming dNTP, six residues of the DNA template strand (including the template G of the nascent base pair), four residues of the DNA primer strand (including the terminal A), the two Mg2+ ions, two aspartic acid residues D830 and D653 which coordinate the Mg2+ ions and bound waters at the catalytic site.
Displacement along a PC eigenvector ξm with amplitude am transforms the structure according to the relationship R(am) = R(0) + am*ξm. To obtain free energy profiles for displacement of the system along a eigenvector, for each PC the amplitude was scanned in N steps of unit displacements am = 0,1,2,...,N and corresponding structures of the active site region R(0), R(1), R(2),…,R(N) were obtained. The chosen eigenvectors show significant correlations with the catalytic site reaction coordinates da and db, (see Section “Umbrella Sampling”). When am = 0, da and db have values which correspond to average values from the 5 ns classical MD runs and the number of steps N is chosen for appropriate reductions in da and db for comparisons with free energy calculations with direct reductions of these coordinates. For each unit displacement window along the PC corresponding to amplitude am, the WHAM algorithm mentioned earlier was applied to the snapshots from the constrained simulations to obtain the unbiased probability distribution and the free energy as a function of root mean square deviation (RMSD) with respect to geometry R(am), see details in Supporting Information Section S1.4. We emphasize that the WHAM was applied to each window independently as the reference geometry R(am) around which the system is constrained changes from window to window. Subsequently, we constructed a 1-d free energy landscape as a function of amplitude am along the mth PC.
Acknowledgments
The authors thank Dr. Casim Sarkar and Dr. Lorena Beese for help with research design and Ms. Yingting Liu for help with pKa calculations.
Glossary
Abbreviations and Symbols:
- BF
bacillus fragment
- dNTP
deoxy-nucleoside-triphosphate
- MD
molecular dynamics
- PC
principal components
- PCA
principal component analysis
- QMMM
quantum mechanics molecular mechanics
- WHAM
weighted histogram analysis method.
References
- 1.Friedberg EC. DNA damage and repair. Nature. 2003;421:436–439. doi: 10.1038/nature01408. [DOI] [PubMed] [Google Scholar]
- 2.Koshland DE. The key-lock theory and the induced fit theory. Angew Chem Int Ed. 1995;33:2375–2378. [Google Scholar]
- 3.Joyce CM, Benkovic SJ. DNA polymerase fidelity: kinetics, structure, and checkpoints. Biochemistry. 2004;43:14317–14324. doi: 10.1021/bi048422z. [DOI] [PubMed] [Google Scholar]
- 4.Joyce CM, Steitz TA. Function and structure relationships in DNA polymerases. Annu Rev Biochem. 1994;63:777–822. doi: 10.1146/annurev.bi.63.070194.004021. [DOI] [PubMed] [Google Scholar]
- 5.Kiefer JR, Mao C, Braman JC, Beese LS. Visualizing DNA replication in a catalytically active Bacillus DNA polymerase crystal. Nature. 1998;391:304–307. doi: 10.1038/34693. [DOI] [PubMed] [Google Scholar]
- 6.Johnson SJ, Taylor JS, Beese LS. Processive DNA synthesis observed in a polymerase crystal suggests a mechanism for the prevention of frameshift mutations. Proc Natl Acad Sci USA. 2003;100:3895–3900. doi: 10.1073/pnas.0630532100. [DOI] [PMC free article] [PubMed] [Google Scholar]
- 7.Johnson SJ, Beese LS. Structures of mismatch replication errors observed in a DNA polymerase. Cell. 2004;116:803–816. doi: 10.1016/s0092-8674(04)00252-1. [DOI] [PubMed] [Google Scholar]
- 8.Steitz TA. A mechanism for all polymerases. Nature. 1998;391:231–232. doi: 10.1038/34542. [DOI] [PubMed] [Google Scholar]
- 9.Fothergill M, Goodman MF, Petruska J, Warshel A. Structure-energy analysis of the role of metal ions in phosphodiester bond hydrolysis by DNA polymerase I. J Am Chem Soc. 2002;117:11619–11627. [Google Scholar]
- 10.Lahiri SD, Zhang GF, Dunaway-Mariano D, Allen KN. The pentacovalent phosphorus intermediate of a phosphoryl transfer reaction. Science. 2003;299:2067–2071. doi: 10.1126/science.1082710. [DOI] [PubMed] [Google Scholar]
- 11.Stahley MR, Strobel SA. Structural evidence for a two-metal-ion mechanism of group I intron splicing. Science. 2005;309:1587–1590. doi: 10.1126/science.1114994. [DOI] [PubMed] [Google Scholar]
- 12.Florian J, Goodman MF, Warshel A. Computer simulation of the chemical catalysis of DNA polymerases: discriminating between alternative nucleotide insertion mechanisms for T7 DNA polymerase. J Am Chem Soc. 2003;125:8163–8177. doi: 10.1021/ja028997o. [DOI] [PubMed] [Google Scholar]
- 13.Radhakrishnan R, Schlick T. Correct and incorrect nucleotide incorporation pathways in DNA polymerase β. Biochem Biophys Res Commun. 2006;350:521–529. doi: 10.1016/j.bbrc.2006.09.059. [DOI] [PMC free article] [PubMed] [Google Scholar]
- 14.Lin P, Pedersen LC, Batra VK, Beard WA, Wilson SH, Pedersen LG. Energy analysis of chemistry for correct insertion by DNA polymerase beta. Proc Natl Acad Sci USA. 2006;103:13294–13299. doi: 10.1073/pnas.0606006103. [DOI] [PMC free article] [PubMed] [Google Scholar]
- 15.Rittenhouse RC, Apostoluk WK, Miller JH, Straatsma TP. Characterization of the active site of DNA polymerase beta by molecular dynamics and quantum chemical calculation. Proteins. 2003;53:667–682. doi: 10.1002/prot.10451. [DOI] [PubMed] [Google Scholar]
- 16.Alberts IL, Wang Y, Schlick T. DNA polymerase beta catalysis: are different mechanisms possible? J Am Chem Soc. 2007;129:11100–11110. doi: 10.1021/ja071533b. [DOI] [PubMed] [Google Scholar]
- 17.Bojin MD, Schlick T. A quantum mechanical investigation of possible mechanisms for the nucleotidyl transfer reaction catalyzed by DNA polymerase beta. J Phys Chem B. 2007;111:11244–11252. doi: 10.1021/jp071838c. [DOI] [PubMed] [Google Scholar]
- 18.Lin P, Batra VK, Pedersen LC, Beard WA, Wilson SH, Pedersen LG. Incorrect nucleotide insertion at the active site of a G:A mismatch catalyzed by DNA polymerase beta. Proc Natl Acad Sci USA. 2008;105:5670–5674. doi: 10.1073/pnas.0801257105. [DOI] [PMC free article] [PubMed] [Google Scholar]
- 19.Sucato CA, Upton TG, Kashemirov BA, Batra VK, Martinek V, Xiang Y, Beard WA, Pedersen LC, Wilson SH, Mckenna CE, Florián J, Warshel A, Goodman MF. Modifying the beta, gamma leaving-group bridging oxygen alters nucleotide incorporation efficiency, fidelity, and the catalytic mechanism of DNA polymerase beta. Biochemistry. 2007;46:461–471. doi: 10.1021/bi061517b. [DOI] [PubMed] [Google Scholar]
- 20.Wang Y, Schlick T. Quantum mechanics/molecular mechanics investigation of the chemical reaction in Dpo4 reveals water-dependent pathways and requirements for active site reorganization. J Am Chem Soc. 2008;130:13240–13250. doi: 10.1021/ja802215c. [DOI] [PMC free article] [PubMed] [Google Scholar]
- 21.Radhakrishnan R. Coupling of fast and slow modes in the reaction pathway of the minimal hammerhead ribozyme cleavage. Biophys J. 2007;93:2391–2399. doi: 10.1529/biophysj.107.104661. [DOI] [PMC free article] [PubMed] [Google Scholar]
- 22.Dittrich M, Hayashi S, Schulten K. On the mechanism of ATP hydrolysis in F1-ATPase. Biophys J. 2003;85:2253–2266. doi: 10.1016/s0006-3495(03)74650-5. [DOI] [PMC free article] [PubMed] [Google Scholar]
- 23.Dittrich M, Schulten K. Zooming in on ATP hydrolysis in F1. J Bioenerg Biomembr. 2005;37:441–444. doi: 10.1007/s10863-005-9487-7. [DOI] [PMC free article] [PubMed] [Google Scholar]
- 24.Hammes-Schiffer S, Benkovic SJ. Relating protein motion to catalysis. Annu Rev Biochem. 2006;75:519–541. doi: 10.1146/annurev.biochem.75.103004.142800. [DOI] [PubMed] [Google Scholar]
- 25.Agarwal PK, Billeter SR, Rajagopalan PT, Benkovic SJ, Hammes-Schiffer S. Network of coupled promoting motions in enzyme catalysis. Proc Natl Acad Sci USA. 2002;99:2794–2799. doi: 10.1073/pnas.052005999. [DOI] [PMC free article] [PubMed] [Google Scholar]
- 26.Yang LW, Bahar I. Coupling between catalytic site and collective dynamics: a requirement for mechanochemical activity of enzymes. Structure. 2005;13:893–904. doi: 10.1016/j.str.2005.03.015. [DOI] [PMC free article] [PubMed] [Google Scholar]
- 27.Whitford PC, Onuchic JN, Wolynes PG. Energy landscape along an enzymatic reaction trajectory: hinges or cracks? HFSP. 2008;2:61–64. doi: 10.2976/1.2894846. [DOI] [PMC free article] [PubMed] [Google Scholar]
- 28.Wuite GJL, Smith SB, Young M, Keller D, Bustamante C. Single-molecule studies of the effect of template tension on T7 DNA polymerase activity. Nature. 2000;404:103–106. doi: 10.1038/35003614. [DOI] [PubMed] [Google Scholar]
- 29.Maier B, Bensimon D, Croquette V. Replication by a single DNA polymerase of a stretched single-stranded DNA. Proc Natl Acad Sci USA. 2000;97:12002–12007. doi: 10.1073/pnas.97.22.12002. [DOI] [PMC free article] [PubMed] [Google Scholar]
- 30.Venkatramani R, Radhakrishnan R. The effect of oxidative damage on active site pre-organization during nucleotide incorporation in DNA by a high fidelity polymerase from Bacillus stearothermophilus. Proteins. 2008;71:1360–1372. doi: 10.1002/prot.21824. [DOI] [PMC free article] [PubMed] [Google Scholar]
- 31.Venkatramani R, Radhakrishnan R. A computational study of the force dependence of phosphoryl transfer during DNA synthesis by a high fidelity polymerase. Phys Rev Lett. 2008;100:088102. doi: 10.1103/PhysRevLett.100.088102. [DOI] [PMC free article] [PubMed] [Google Scholar]
- 32.Rosta E, Woodcock HL, Brooks BR, Hummer G. Artificial reaction coordinate “tunneling” in free-energy calculations: the catalytic reaction of RNase H. J Comput Chem. 2009;30:1634–1641. doi: 10.1002/jcc.21312. [DOI] [PMC free article] [PubMed] [Google Scholar]
- 33.Andricioaei I, Karplus M. On the calculation of entropy from covariance matrix of atomic fluctuations. J Chem Phys. 2001;115:6289–6292. [Google Scholar]
- 34.Dahlberg ME, Benkovic SJ. Kinetic mechanism of DNA polymerase I (Klenow fragment): identification of a second conformational change and evaluation of the internal equilibrium constant. Biochemistry. 1991;30:4835–4843. doi: 10.1021/bi00234a002. [DOI] [PubMed] [Google Scholar]
- 35.Rothwell PJ, Waksman G. Structure and mechanism of DNA polymerases. Adv Protein Chem. 2005;71:401–440. doi: 10.1016/S0065-3233(04)71011-6. [DOI] [PubMed] [Google Scholar]
- 36.Radhakrishnan R, Arora K, Wang Y, Beard WA, Wilson SH, Schlick T. Regulation of DNA repair fidelity by molecular checkpoints: “Gates” in DNA polymerase beta's substrate selection. Biochemistry. 2006;45:15142–15156. doi: 10.1021/bi061353z. [DOI] [PMC free article] [PubMed] [Google Scholar]
- 37.Singh K, Modak MJ. Presence of 18-A long hydrogen bond track in the active site of Escherichia coli DNA polymerase I (Klenow fragment). Its requirement in the stabilization of enzyme-template-primer complex. J Biol Chem. 2003;278:11289–11302. doi: 10.1074/jbc.M211496200. [DOI] [PubMed] [Google Scholar]
- 38.Loh E, Loeb LA. Mutability of DNA polymerase I: implications for the creation of mutant DNA polymerases. DNA Rep. 2005;4:1390–1398. doi: 10.1016/j.dnarep.2005.09.006. [DOI] [PubMed] [Google Scholar]
- 39.Brooks CL, Case DA. Theory and simulation—the control and timescale of structure and reactivity in biological systems: from peptide folding to cellular networks. Curr Opin Struct Biol. 2003;13:143–145. [Google Scholar]
- 40.Elber R, Cárdenas A, Ghosh A, Stern H. Bridging the gap between long time trajectories and reaction pathways. Adv Chem Phys. 2003;126:93–129. [Google Scholar]
- 41.Chu J-W, Trout BL, Brooks BR. A super-linear minimization scheme for the nudged elastic band method. J Chem Phys. 2003;119:12708–12717. [Google Scholar]
- 42.Bolhuis PG, Chandler D, Dellago C, Geissler PL. Transition path sampling: throwing ropes over rough mountain passes, in the dark. Ann Rev Phys Chem. 2002;53:291–318. doi: 10.1146/annurev.physchem.53.082301.113146. [DOI] [PubMed] [Google Scholar]
- 43.Ren W, Vanden-Eijnden E, Maragakis P, Weinan E. Transition pathways in complex systems: application of the finite-temperature string method to the alanine dipeptide. J Chem Phys. 2005;123:134109. doi: 10.1063/1.2013256. [DOI] [PubMed] [Google Scholar]
- 44.Foloppe N, Mackerell AD. All-atom empirical force field for nucleic acids. I. Parameter optimization based on small molecule and condensed phase macromolecular target data. J Comp Chem. 2000;21:86–104. [Google Scholar]
- 45.Radhakrishnan R, Schlick T. Fidelity discrimination in DNA polymerase beta: differing closing profiles for a mismatched (G:A) versus matched (G:C) base pair. J Am Chem Soc. 2005;127:13245–13253. doi: 10.1021/ja052623o. [DOI] [PMC free article] [PubMed] [Google Scholar]
- 46.Das D, Eurenius KP, Billings EM, Sherwood P, Chatfield DC, Hodoscek M, Brooks BR. Optimization of quantum mechanical molecular mechanical partitioning schemes: Gaussian delocalization of molecular mechanical charges and the double link atom method. J Chem Phys. 2002;117:10534–10547. [Google Scholar]
- 47.Roux B. The calculation of the potential of mean force using computer-simulations. Comp Phys Comm. 1995;91:275–282. [Google Scholar]
- 48.Amadei A, Linssen ABM, Berendsen HJC. Essential dynamics of proteins. Proteins. 1993;17:412–425. doi: 10.1002/prot.340170408. [DOI] [PubMed] [Google Scholar]