

Abstract
We tested the hypothesis that segmental differences in the responsiveness and time course of vasodilation to metabolic signals putatively involved in rapid onset vasodilation (ROV) at the start of exercise exist within the skeletal muscle vasculature. Cannulated first-order (1As) and third-order arterioles (3As) of the rat gastrocnemius (G) muscle were exposed to cumulative doses of KCl, acetylcholine (Ach) or adenosine (Ado). In addition, time course and magnitude of vasodilation to localized application of these agonists were determined. 1As and 3As dilated similarly to incremental doses of the agonists. Continuous monitoring of internal diameter revealed a fast and transient dilatory response to microinjections of the agonists, with an average time delay (TD) before the onset of vasodilation of 2.8±0.2s (1As: 3.0±0.3s and 3As:2.6±0.3s) and time-to-peak (TP) of 8.2±0.7s (1As:10.3±1s and 3As:5.7±0.5s). No significant differences were detected for all parameters between 1As and 3As for KCl or Ado application, while 1As had a significantly longer TP and greater peak dilation than 3As to Ach. These findings demonstrate that 1As and 3As from the rat G muscle appear to have similar responsiveness to vasoactive agonists. Furthermore, the average TD before vasodilation supports a role for metabolic signals as contributors to the ROV.
Keywords: exercise hyperemia, microcirculation, vasodilation, skeletal muscle
INTRODUCTION
The prompt increase in skeletal muscle perfusion during the onset of exercise is thought to be pivotal for the proper maintenance of the oxygen pressure gradient between the microcirculation and the contracting striated myocytes (31). In the first few seconds of skeletal muscle contraction, when the oxygen demand is increasing at its fastest rate, disruption of the mechanisms associated with the rapid hyperemic response, such as seen with aging (7, 30) and in chronic diseases (3, 12), might unfavorably affect metabolic control in skeletal muscle and increase the oxygen deficit (31). Accordingly, a lucid understanding of the signals initiating and/or contributing to exercise hyperemia, especially during the early transitional period, is highly desirable.
Mounting evidence indicates that the rapid hyperemia following the onset of contractions results from the combined action of the muscle pump and an immediate dilatory response of undetermined origin (2, 8, 31, 37). A matter of considerable debate is whether mechanical forces (9) or metabolic factors (2, 27) are the putative major signals triggering the rapid vasodilation during muscle contractions. Proponents of the first hypothesis argue the time required for any contraction-derived metabolite to be released, diffuse to the vasculature and accumulate in a concentration capable of causing vasodilation is theoretically too long to explain the early dilatory events (8, 40). Indeed, experiments by Wunsch and co-workers (40) in rat isolated first-order arterioles demonstrated that it takes at least 4 seconds before any vasodilation can be seen after application of substances that are thought to contribute to immediate exercise hyperemia. Counteracting this proposal, Mihok et al (24) and Armstrong et al (2) demonstrated that in a model in which only a few muscle fibers are stimulated to contract in the hamster cremaster muscle and therefore the action of mechanical factors is minimized, vasodilation in terminal arterioles initiates within 1 s (24). Furthermore, this group of investigators also found recently that blocking the action of potassium, a likely candidate to be involved in these early dilatory events, reduces significantly the magnitude of vasodilation to striated muscle contraction in the same model (2).
Apart from differences in experimental models, a potential reconciliatory factor for these contrasting findings is the fact that different portions of the vasculature were studied in these experiments (first-order vs. terminal arterioles). Evidence from intravital studies in contracting skeletal muscle clearly show that exercise-induced rapid vasodilation is non-uniform within the arteriolar network, starting at distal, smaller segments and spreading upstream (13, 22, 38). Of particular relevance, it has been demonstrated in some vascular beds that distal, smaller arterioles are more sensitive to vasoactive substances associated with metabolic activation and in skeletal muscle these vessels are more prone to metabolic-related inhibition of sympathetic activity (1, 11). Thus, it is conceivable that during the onset of exercise, changes in metabolite levels are first sensed by distal arterioles, meaning that the time course of vasodilation to these agents would be faster in smaller arterioles as compared to larger arterioles. To date, however, no study has investigated the impact of branching order on the dynamic profile of vasodilation to metabolic mediators in skeletal muscle.
Accordingly, this study examined the sensitivity to putative vasodilators involved in exercise hyperemia (potassium, acetylcholine and adenosine) in rat isolated, pressurized arterioles. Two distinct arteriolar segments within the size range suitable for cannulation (namely, first-order (1As) and third-order arterioles (3As)) were selected from the rat gastrocnemius (G) arteriolar network. The hypothesis was tested that 3As are more sensitive than the larger 1As to these metabolic mediators and dilate faster and to a greater extent in response to local applications of these substances. Along this line, we therefore anticipated that time delay before vasodilation in 3As would be shorter than previously reported (i.e. <4s).
METHODS
Animals
Male Sprague-Dawley rats (300–400g) were housed in a temperature – controlled room (24°C) with a 12:12-h light-dark cycle. Food and water were provided ad libitum. The Institutional Animal Care and use Committee of the University of Missouri approved the experimental protocol.
Isolation and Cannulation of Gastrocnemius Arterioles
Rats were anesthetized with pentobarbital sodium (100mg/kg) and the gastrocnemius-soleus-plantaris muscle group was removed and placed in ice-cold (4°) physiological saline solution (PSS). PSS contained (mM) 145.0 NaCl, 4.7 KCl, 2.0 CaCl2, 1.17 MgSO4, 1.2 NaH2PO4, 5.0 glucose, 2.0 pyruvate, 0.02 EGTA, and 25.0 MOPS (pH=7.4). Under a dissecting microscope, first-order arterioles (1A) supplying both the red and white portions and third-order arterioles (3A) within the red portion of the gastrocnemius muscle medial head were carefully isolated from the surrounding tissue (32). Besides the noticeable distinction in size, the choice of these segments was based on the premise that substantial differences in the vasodilatory kinetic profile to contractions exist between neighboring arterioles (4, 13). 1As were defined as the first arteriolar segment within the epimisyum (32). 3As were defined as the first branches off the second 2A in the red portion of the muscle (see Figure 1). The arterioles were transferred to a Lucite chamber containing cold-PSS and one end was cannulated with a glass micropipette (1A~ 85 μm OD and 3A~ 30 μm OD) filled with albumin-supplemented (10g/L) PSS (PSSA) and secured with nylon suture. After gently flushing the arteriole with PSSA, the other end was cannulated and secured. Following cannulation, the microvessel chamber was transferred to the stage of an inverted microscope (MicroscOptics IV 900 Series) coupled with a CCD camera (Pulnix TM-200, 768 × 494 pixel). The video was digitized using a monochrome video board and processed as previously described (10). Vessel internal and external diameters were tracked continuously (30Hz) by an automated tracking system (10) and the signal was acquired by a data acquisition system (PowerLab/Macintosh).
Figure 1.

Schematic diagram of the proximal section of the rat gastrocnemius muscle (medial head) arteriolar tree. First-order arterioles (1As) supplying both the red and white portions and third-order arterioles (3A) within the red portion of the muscle (enclosed segments) were studied. See the text and reference 24 for details.
Arterioles were then pressurized (1A: 85cmH2O and 3A: 53cmH2O (18)) with two-independent fluid reservoirs containing PSSA and checked for leaks. The intraluminalpressures were estimated based on in vivo measurements of pressure in rat skeletal muscle arterioles of similar size and branch order (6, 23, 41). Leak-free arterioles were warmed to 37°C and allowed to develop spontaneous tone during a 50–60 min equilibration period. The bathing solution was replaced every 15 min. Vessels that did not develop at least 20% spontaneous tone were discarded. The rate of success in this experiment was approximately 50%. Only one vessel per rat was studied.
Experimental protocol
Segmental differences in arteriolar reactivity were evaluated in two sequential experiments. First, cumulative dose-response curves for 1) potassium (2.5– 15mM, in 2.5mM increments) or 2) in a randomized order, acetylcholine (Ach) (10−9 to 10−4M) or adenosine (Ado) (10−10 to 10−4M), were constructed by adding incremental doses every 3 min to the bath. 15–20 min after the completion of the dose-response curves, localized applications of the agonists were performed to study the time course and magnitude of the vasodilatory responses. This strategy, as opposed to administration of a fixed, large volume into the bath (40), was chosen because it allows for the precise determination of the time of injection and likely minimizes the time required for the drug to reach the arteriolar wall (see supplemental movies). Glass micropipettes filled with 1) 30mM potassium (13–15 μm OD pipettes) or 2) 1 × 10⁻⁵M Ach and 1 × 10⁻⁴M Ado (5 μm OD pipettes) were connected to a pressure ejection system (Picospritzer II, General Valve Corporation) and carefully positioned in the vicinity of the arteriolar wall (~133±4 μm) with the aid of a micromanipulator (World Precision Instruments). The pipette tip sizes were chosen to give the largest tip that did not produce a basal diameter change due to leakage. A brief pressure pulse (~20 psi) was given for application of the drugs. At this pressure the estimated volume delivery is approximately 0.6μL. To exclude the possibility that mechanical distortion of the vessel associated with the pressure ejection can independently induce diameter changes, control experiments were performed in which a vehicle solution (warm saline solution) was given. In experiments where more than one drug was tested (i.e. Ach/Ado) the bath solution was replaced and a 10min interval was allowed between drug applications. After conclusion of the experiments, vessels were incubated in calcium-free PSS solution plus 10−2M sodium nitroprusside (SNP) for 45–60 min, with the solution changed every 10 min.
Data analysis
Arteriolar diameters were expressed as percentage of maximum passive diameter according to the formula: [(D − DI)/(DP − DI)] × 100, where D is the measured diameter, DI is the initial diameter before the drug application and DP is the maximal passive diameter obtained after incubation in Ca-free PSS. In the localized drug application experiments, the time-delay before the onset of vasodilation (TD) was calculated by means of a computer aided linear breakpoint analysis (SigmaPlot 8.0, Systat Software, CA,USA), where the parameters providing the least residual sum of squares for two regression lines were chosen as representative of the best fit. Goodness of fit was confirmed based on 1) visual inspection of the data and 2) the r2 value. Furthermore, the time to 50, 63, 75 and 95% of the overall dilatory amplitude was calculated independent of modeling strategies.
Baseline characteristics of the 1A and 3A arterioles and the time course and magnitude of the local responses were compared by Student’s t-test or the Mann-Whitney Rank Sum Test, when appropriate. Dose-response curves for the three agonists were compared using a mixed procedure for two-factors in SAS (SAS Institute Inc., Cary, NC, USA). Options were used to allow for different variances between the two groups of arterioles. All values are presented as means ± SE. Significance was defined as P<0.05.
RESULTS
Vessel characteristics
The characteristics of first and third-order arterioles are listed in Table 1. Third-order arterioles tended to develop more spontaneous tone than first order arterioles (1As: 31±2% vs. 3As: 43±9%) but no statistical significance was detected (p=0.1).
Table 1.
Characteristics of first-order (1As) and third-order (3As) arterioles isolated from the rat gastrocnemius muscle
| First-order arterioles (1As) | Third-order arterioles (3As) | |
|---|---|---|
| Number of arterioles | 14 | 13 |
| Baseline diameter (μm) | 175 ± 7 | 49 ± 4* |
| Baseline diameter (relative) | 68 ± 2 | 56 ± 5 |
| Spontaneous tone (%) | 31 ± 2 | 43 ± 5 |
| Passive diameter (μm) | 255 ± 7 | 89 ± 3* |
Values are as mean ± SE.
p<0.05 1A’s vs. 3A’s.
Vasodilatory responses (dose-response curves)
Exposure to cumulative doses of potassium chloride led to rapid, often transient dilation in both groups of arterioles. In first-order arterioles the frequency and magnitude of oscillations in diameter tended to be intensified at the higher doses, while third-order arterioles displayed a more sustained dilation. Peak dilation was reached at the 12.5mM dose (1A: 33±8% vs. 3A: 29±14%) and no significant differences where found between 1As and 3As (Figure 2, Panel A). Incremental doses of Ach produced robust dilation in both 1As and 3As (Figure 2, panel B). 3As demonstrated slightly reduced responses compared to 1As (peak dilation 1A: 75±7% vs. 3A:66±9%) but no significant differences were detected. Incremental exposure to Ado also resulted in a significant dilation but only in 1As (Figure 2, panel C). In 3As, no substantial changes in diameters were seen until the highest dose (10−4). Nonetheless, no statistically significant differences between groups were found.
Figure 2.

Vasodilatory responses to cumulative exposure to potassium chloride (Panel A), acetylcholine (Panel B) or adenosine (Panel C) in both first-order (1As) and third-order (3As) arterioles. Values are means ± SE.
Responses to localized agonist application
Short-pulse application of the agonists in the vicinity of the arteriolar wall produced transient dilations of modest magnitude (Figure 3). Determination of the time delay (TD) before the onset of vasodilation revealed a very fast dilatory response in both arteriolar orders (Figure 4). In approximately 30% of the experiments vasodilation initiated in less than 2s (overall average of 2.8s), with a few arterioles responding almost instanteously following agonist application (i.e. <1s) (see figure 4 and supplemental videos). Nonetheless, no differences in the TD were detected between 1As and 3As for any of the three agonists. Peak dilation was reached on average within ~8s after drug delivery irrespective of the vasoactive agent. The time to 50, 63, 75 and 95% of the overall amplitude is shown on figure 5. Noteworthy, 3As tended to have a faster dilatory profile when compared with 1As for all three agonists, but significant differences were detected only for Ach at T75% and T95% (see figure 5). Similarly, the change in diameter was significantly more pronounced in 1As vs. 3As after Ach stimulation, but no differences were found after potassium and Ado administration (Figure 6).
Figure 3.

Typical diameter responses to localized application of the agonists in the vicinity of the arterioles. Potassium chloride (KCl 30mM, Panel A), Ach (1 × 10⁻⁵M, Panel B) and Ado (1 × 10⁻⁴M, Panel C) were applied via a short pressure pulse ejection from a micropipette positioned nearby. Diameter was continuously tracked by an automated tracking system. Upper traces in each panel show the responses of 1As and lower traces are representative examples of 3As. Dashed lines show the time the vasoactive agents were applied.
Figure 4.
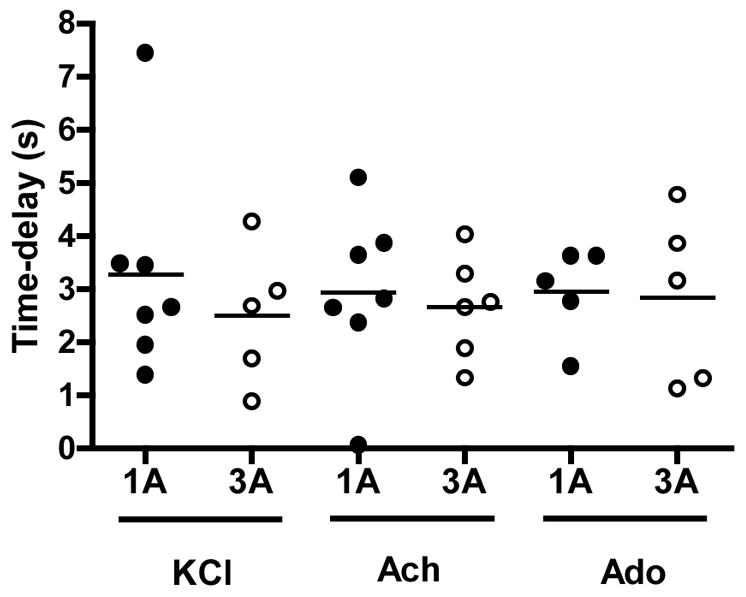
Time delay before the onset of vasodilation following localized application of KCl (30mM), Ach (1 × 10⁻⁵M) and Ado (1 × 10⁻⁴M) in 1As and 3As. Each symbol corresponds to a single arteriole (closed circles – 1As and open circles – 3As).
Figure 5.

Time from baseline diameter to 50, 63, 75 and 95% of the overall diameter amplitude following localized application of KCl (30mM), Ach (1 × 10⁻⁵M) and adenosine (1 × 10⁻⁴M). *p<0.05 between 1As and 3As.
Figure 6.

Absolute (panel A) and relative (panel B) changes in inner diameter in response to localized application of potassium chloride (KCl, 30mM) (1As: n = 7, 3As: n = 5), acetylcholine (Ach, 1 × 10⁻⁵M) (1As: n = 7, 3As: n = 6) and adenosine (Ado, 1 × 10⁻⁴M) (1As: n = 5, 3As: n = 5). Values are as mean ± SE. * p<0.05 between 1As and 3As. Solid bars – 1As and open bars – 3As.
DISCUSSION
This study tested the hypothesis that segmental differences in the responsiveness to metabolites putatively involved in the immediate exercise hyperemia exist in arterioles isolated from the rat gastrocnemius vascular network. We reasoned that 3As would have enhanced sensitivity to the vasodilators and a faster dilatory response profile when compared with 1As. Contrary to our predictions, no detectable differences were found between arteriolar orders for all three agonists tested (potassium, Ach and Ado). However, we report the novel finding that the time delay before the onset of vasodilation to local application of these agonists, on average 2.8 seconds, is faster than previously thought (40). Indeed, although substantial heterogeneity was observed in the vasodilatory kinetic profile, a TD of less than two seconds was detected in 30% of the experiments following pressure-induced administration of these vasoactive agents. Combined with recent, in-situ evidence in the hamster cremaster muscle (2, 24), these new data support the notion that contraction-derived metabolites contribute to the early hyperemic responses to exercise.
Methodological considerations
Determination of the time required for any factor to induce vasorelaxation is one of the main steps in the search for the mechanistic basis of immediate exercise hyperemia. In the present study, glass micropipettes were positioned in the vicinity of isolated arterioles and localized, brief pressure-induced ejections were employed for agonist application and study of the time course profile. Besides likely minimizing the time required for the drug to reach the arteriolar wall, this approach allowed us to precisely determine the point at which the stimulus was given and therefore resolve the time parameters of the responses (i.e. time delay (TD) and time-to-peak (TP)). Furthermore, an automated tracking system was used for continuous diameter monitoring during the rapid transient changes induced by agonist application. Being operator-independent and operating at video rates, this method has been proven to be especially useful to reproducibly track sudden changes in vessel diameter that occur in a number of experimental scenarios (e.g. lymphatic vasomotion) (10). Accordingly, by combining these experimental strategies, we were able to detect very rapid dilatory responses, which in most arterioles started in less than 2 seconds irrespective of the agent used and peaked within ~8 seconds (Figure 3–5). Of note, these results differ from previous studies aimed to characterize the time course profile of vasodilation in vitro. Wunsch et al (40) reported, in both soleus and gastrocnemius isolated 1As, that the TD before vasodilation was at least 4 seconds for all agonists tested (acetylcholine, potassium chloride, adenosine and sodium nitroprusside). Contrary to the approach used in the present study, those authors administered a fixed volume (1ml) of the solution containing the vasoactive agent of interest into the vessel bath and measured the diameter changes manually (i.e. using a video micrometer) on a frame-by-frame basis (30 frames/sec). Besides the fact that the drugs were applied manually and therefore directly dependent on the consistency of the investigators, this approach may also have caused a delay associated with proper mixing of the solution in the bath. Furthermore, we noticed in preliminary experiments that the sudden application of a relatively large volume into the bath was usually associated with a temporary distortion in the vessel image that compromised the diameter measurements in the initial frames and by consequence the precise determination of the dilatory profile. Accordingly, it is conceivable that the incongruent findings in the time course profile between the present study and the report from Wunsch et al (47) arise, at least partially, from this difference in the experimental design and diameter measurement method.
A particularly striking observation in the present study was the substantial dispersion in the TD data in both vessel orders. In fact, while some arterioles dilated in less than a second following application of the vasoactive agents, a pronounced delay of up to ~8 seconds was detected in other vessels (Figure 4). The reasons behind this inconsistent behavior are not entirely clear, but it can be speculated that inadvertent variations in the preparation of the arteriolar segments and pipette placement might have been contributing factors. First, it is conceivable that differences in the pipette positioning for the local drug delivery and the associated changes in both magnitude and rapidity of stimuli application could be responsible for the detected differences in the time constraints. Evidence against this hypothesis is that most vessels showing delayed responses had reproducible TD values irrespective of changes in the position of the drug application micropipette. It is also possible that in attempt to properly dissect the arteriolar segments and remove the surrounding connective tissue minor differences occurred in the extent of tissue handling between vessels that could have affected the sensitivity and therefore the time course of the vasodilatory responses. Noteworthy, however, a rather consistent profile of the magnitude of spontaneous tone development and vasodilatory response was observed in both arteriolar orders, which argues against a major role of differences in the preparation procedures as causal factors for the observed heterogeneity (Table 1 and Figure 1). Lastly, it is likely that the observed variability arose from inherent inhomogeneities between different vessels and/or between neighboring vessels of the same order. Regarding the latter, although a considerable effort was made to consistently select vessels from the exact same anatomic location, sometimes the first vessel had to be discarded for technical reasons (e.g. failure to develop 20% spontaneous tone). The source and extent of such inhomogeneities remains to be determined but it is plausible that regional variations exist in the densities of receptors and/or expression and function of ion channels within and, most importantly, between vascular networks. Thus, in theory, in spite of being in close proximity (i.e. same anatomic location within the network), different 1As or 3As may have completely different phenotypes depending on the network organization and receptor distribution. If true, this observation would give rise to a scenario in which fast and slow responding vessels co-exist within the same arteriolar tree, with the positioning of both vessel ‘types’ varying between distinct networks. In this hypothetical arrangement, application of the stimuli would readily evoke vasodilation in the fast responders and would be conducted through the endothelial and/or vascular smooth muscle layers (11, 34, 35) to the neighboring arterioles. Although appealing, the existence and distribution of such trigger points awaits a more detailed molecular characterization of microvascular networks.
Segmental differences in arteriolar networks
The lack of significant differences in arteriolar sensitivity to metabolites as well in the dynamic dilatory profile between 1As and 3As is at odds with our initial hypothesis of a size dependent responsiveness to these agents in the gastrocnemius network. Previously, it has been demonstrated in some vascular beds (11) that distal, smaller arterioles are more sensitive to vasoactive agents. The implication of such remarkable behavior is that changes in tissue demand can be sensed first by the segments controlling capillary perfusion and transmitted upstream (11, 17, 33). In the present study, although a trend was observed for 3As to have a faster dilatory dynamic profile (i.e. shorter TP) than 1As, no statistically significant differences were detected between groups except for Ach, where 1As had a longer TP and a larger change in diameter following local application. Even though these findings do not directly support the aforementioned prevailing hypothesis it should be pointed out that in spite of significant differences in diameters, both 1As and 3As are positioned in the proximal section of the gastrocnemius network. Indeed, topological characterization of the rat gastrocnemius arteriolar network by vascular cast analysis has shown that, in sedentary animals, arterioles ramify as far down as the 12th and 13th branching orders (5). It is therefore possible that these smaller segments (<10 microns in size and not amenable to isolation and direct cannulation) are in reality more responsive to metabolites than the ones we selected in this study.
Role of metabolites in the immediate exercise hyperemia
The dilatory response to exercise has been partially attributed to the action of a number of vasoactive agents that interact in a complex and incompletely defined manner, depending on the characteristics of muscle contraction (26, 28). The idea that Ach is released in the neuromuscular junction, diffuses to the nearby vasculature and causes vasodilation is especially attractive (38, 39) but given the disparate findings between different experimental models (14, 29), it is difficult to draw any strong conclusions. Nonetheless, the results from the present study suggest that if Ach reaches a threshold concentration in the vicinity of arterioles, a rapid (TD=2.8±0.3s) and robust arteriolar dilation ensues (Figure 4–6). The same holds true for Ado. In this case, however, supportive evidence for any role in the early hyperemic events is particularly controversial (see (21) for review). The key questions of how fast or in what concentrations this metabolite accumulates in the interstitial space in the first few seconds following the onset of contractions still remain to be answered.
Potassium, which is released by muscle cells during repolarization has been historically considered a likely mediator of the immediate exercise hyperemia (36). Confirming theoretical predictions (20, 25), recent continuous measurements of potassium in the muscle interstitium using K+ selective electrodes have shown that this substance rapidly builds-up during the onset of exercise (15, 19) and can reach concentrations capable of triggering vasodilation (20). In this context, Armstrong and Murrant (2) demonstrated that blockade of either the release of potassium in the muscle interstitium or its vasodilatory action by inhibiting the sodium-potassium pump and inward rectifying channels significantly attenuates the dilatory responses in transverse arterioles of the hamster cremaster muscle during electrically-evoked striated muscle contractions. Thus, the time course profile to local KCl applications reported here (TD=2.9±0.4 and TP=9.4±1.7s) reinforces the growing body of evidence that this substance might be an important player in the rapid onset vasodilation (16).
Central to the discussion about the nature of the immediate hyperemia response is to what extent the above mentioned metabolic factors truly contribute to the overall response and how they interact with other instantaneously-activated mechanical factors. The relevance of this dispute is easily justifiable by the notion that metabolic signals released during muscle contraction are restricted to active areas within muscles and can potentially direct flow to where it is needed, a task that cannot be accomplished by mechanical factors. In this scenario, the findings of the present study do not support the idea that these vasoactive substances participate only as ‘error signals’ in a delayed phase of the hyperemic response, but can be potentially operant after 1–3 seconds following the onset of contractions. On the other hand, the time-delay before the onset of vasodilation that we report here indicates that these agents are not initiators of the immediate response and accordingly, that mechanical or some unknown factors play a major role as feed-forward mechanisms. Nonetheless, it should be emphasized, as already mentioned, that a definite answer to this conundrum will likely arise from further investigation of the properties of the distal arteriolar segments in locomotor muscles.
In summary, this study has shown that 1As and 3As of the rat gastrocnemius muscle appear to have similar responsiveness to potassium, Ach and Ado. We have also shown that time course of vasodilation to these agonists in isolated arterioles is faster than previously thought. Taken together, these findings support a role for metabolic signals as participants of the early phase of the hyperemic response and encourage additional efforts to elucidate the behavior of smaller vessels of the arteriolar network in skeletal muscle.
Supplementary Material
Acknowledgments
The authors would like to thank Pam Thorne for her invaluable technical assistance and Dr. Leonardo Ferreira for suggestions on the mathematical modeling of the data.
GRANTS
This research was supported by NIH Grants RR-18276, HL-36088 and a Doctoral Student Research Grant from the American College of Sports Medicine Foundation (B.R). Bruno Roseguini is a Fulbright/Brazilian Ministry of Education (Capes) fellow.
Footnotes
DISCLOSURES
There are no conflicts of interest to disclose.
References
- 1.Anderson KM, Faber JE. Differential sensitivity of arteriolar alpha 1- and alpha 2-adrenoceptor constriction to metabolic inhibition during rat skeletal muscle contraction. Circ Res. 1991;69:174–184. doi: 10.1161/01.res.69.1.174. [DOI] [PubMed] [Google Scholar]
- 2.Armstrong ML, Dua AK, Murrant CL. Potassium initiates vasodilatation induced by a single skeletal muscle contraction in hamster cremaster muscle. J Physiol. 2007;581:841–852. doi: 10.1113/jphysiol.2007.130013. [DOI] [PMC free article] [PubMed] [Google Scholar]
- 3.Bauer TA, Reusch JE, Levi M, Regensteiner JG. Skeletal muscle deoxygenation after the onset of moderate exercise suggests slowed microvascular blood flow kinetics in type 2 diabetes. Diabetes Care. 2007;30:2880–2885. doi: 10.2337/dc07-0843. [DOI] [PubMed] [Google Scholar]
- 4.Bearden SE. Advancing age produces sex differences in vasomotor kinetics during and after skeletal muscle contraction. Am J Physiol Regul Integr Comp Physiol. 2007;293:R1274–1279. doi: 10.1152/ajpregu.00213.2007. [DOI] [PubMed] [Google Scholar]
- 5.Binder KW, Murfee WL, Song J, Laughlin MH, Price RJ. Computational network model prediction of hemodynamic alterations due to arteriolar remodeling in interval sprint trained skeletal muscle. Microcirculation. 2007;14:181–192. doi: 10.1080/10739680601139294. [DOI] [PMC free article] [PubMed] [Google Scholar]
- 6.Bohlen HG, Gore RW, Hutchins PM. Comparison of microvascular pressures in normal and spontaneously hypertensive rats. Microvasc Res. 1977;13:125–130. doi: 10.1016/0026-2862(77)90121-2. [DOI] [PubMed] [Google Scholar]
- 7.Carlson RE, Kirby BS, Voyles WF, Dinenno FA. Evidence for impaired skeletal muscle contraction-induced rapid vasodilation in aging humans. Am J Physiol Heart Circ Physiol. 2008;294:H1963–1970. doi: 10.1152/ajpheart.01084.2007. [DOI] [PubMed] [Google Scholar]
- 8.Clifford PS. Skeletal muscle vasodilatation at the onset of exercise. J Physiol. 2007;583:825–833. doi: 10.1113/jphysiol.2007.135673. [DOI] [PMC free article] [PubMed] [Google Scholar]
- 9.Clifford PS, Tschakovsky ME. Rapid vascular responses to muscle contraction. Exerc Sport Sci Rev. 2008;36:25–29. doi: 10.1097/jes.0b013e31815ddba4. [DOI] [PubMed] [Google Scholar]
- 10.Davis MJ. An improved, computer-based method to automatically track internal and external diameter of isolated microvessels. Microcirculation. 2005;12:361–372. doi: 10.1080/10739680590934772. [DOI] [PubMed] [Google Scholar]
- 11.Davis MJ, Hill MA, Kuo L. Local Regulation of Microvascular Perfusion. In: Tuma RF, Duran WN, Klaus L, editors. Handbook of Physiology: Microcirculation. Academic Press; 2008. pp. 161–284. [Google Scholar]
- 12.Diederich ER, Behnke BJ, McDonough P, Kindig CA, Barstow TJ, Poole DC, Musch TI. Dynamics of microvascular oxygen partial pressure in contracting skeletal muscle of rats with chronic heart failure. Cardiovasc Res. 2002;56:479–486. doi: 10.1016/s0008-6363(02)00545-x. [DOI] [PubMed] [Google Scholar]
- 13.Dodd LR, Johnson PC. Diameter changes in arteriolar networks of contracting skeletal muscle. Am J Physiol. 1991;260:H662–670. doi: 10.1152/ajpheart.1991.260.3.H662. [DOI] [PubMed] [Google Scholar]
- 14.Dyke CK, Dietz NM, Lennon RL, Warner DO, Joyner MJ. Forearm blood flow responses to handgripping after local neuromuscular blockade. J Appl Physiol. 1998;84:754–758. doi: 10.1152/jappl.1998.84.2.754. [DOI] [PubMed] [Google Scholar]
- 15.Juel C, Pilegaard H, Nielsen JJ, Bangsbo J. Interstitial K(+) in human skeletal muscle during and after dynamic graded exercise determined by microdialysis. Am J Physiol Regul Integr Comp Physiol. 2000;278:R400–406. doi: 10.1152/ajpregu.2000.278.2.R400. [DOI] [PubMed] [Google Scholar]
- 16.Kirby BS, Carlson RE. Potassium, contracting myocytes and rapid vasodilatation: peaking more than just our interest? J Physiol. 2008;586:315–317. doi: 10.1113/jphysiol.2007.143669. [DOI] [PMC free article] [PubMed] [Google Scholar]
- 17.Kuo L, Davis MJ, Chilian WM. Longitudinal gradients for endothelium-dependent and –independent vascular responses in the coronary microcirculation. Circulation. 1995;92:518–525. doi: 10.1161/01.cir.92.3.518. [DOI] [PubMed] [Google Scholar]
- 18.Laughlin MH, Woodman CR, Schrage WG, Gute D, Price EM. Interval sprint training enhances endothelial function and eNOS content in some arteries that perfuse white gastrocnemius muscle. J Appl Physiol. 2004;96:233–244. doi: 10.1152/japplphysiol.00105.2003. [DOI] [PubMed] [Google Scholar]
- 19.Li J, Gao Z, Kehoe V, Sinoway LI. Interstitial K+ concentration in active muscle after myocardial infarction. Am J Physiol Heart Circ Physiol. 2007;292:H808–813. doi: 10.1152/ajpheart.00295.2006. [DOI] [PMC free article] [PubMed] [Google Scholar]
- 20.Lo A, Fuglevand AJ, Secomb TW. Theoretical simulation of K(+)-based mechanisms for regulation of capillary perfusion in skeletal muscle. Am J Physiol Heart Circ Physiol. 2004;287:H833–840. doi: 10.1152/ajpheart.00139.2004. [DOI] [PubMed] [Google Scholar]
- 21.Marshall JM. The roles of adenosine and related substances in exercise hyperaemia. J Physiol. 2007;583:835–845. doi: 10.1113/jphysiol.2007.136416. [DOI] [PMC free article] [PubMed] [Google Scholar]
- 22.Marshall JM, Tandon HC. Direct observations of muscle arterioles and venules following contraction of skeletal muscle fibres in the rat. J Physiol. 1984;350:447–459. doi: 10.1113/jphysiol.1984.sp015211. [DOI] [PMC free article] [PubMed] [Google Scholar]
- 23.Meininger GA, Harris PD, Joshua IG. Distributions of microvascular pressure in skeletal muscle of one-kidney, one clip, two-kidney, one clip, and deoxycorticosterone-salt hypertensive rats. Hypertension. 1984;6:27–34. doi: 10.1161/01.hyp.6.1.27. [DOI] [PubMed] [Google Scholar]
- 24.Mihok ML, Murrant CL. Rapid biphasic arteriolar dilations induced by skeletal muscle contraction are dependent on stimulation characteristics. Can J Physiol Pharmacol. 2004;82:282–287. doi: 10.1139/y04-016. [DOI] [PubMed] [Google Scholar]
- 25.Mohrman DE, Sparks HV. Role of potassium ions in the vascular response to a brief tetanus. Circ Res. 1974;35:384–390. doi: 10.1161/01.res.35.3.384. [DOI] [PubMed] [Google Scholar]
- 26.Murrant CL, Sarelius IH. Coupling of muscle metabolism and muscle blood flow in capillary units during contraction. Acta Physiol Scand. 2000;168:531–541. doi: 10.1046/j.1365-201x.2000.00706.x. [DOI] [PubMed] [Google Scholar]
- 27.Murrant CL, Sarelius IH. Local and remote arteriolar dilations initiated by skeletal muscle contraction. Am J Physiol Heart Circ Physiol. 2000;279:H2285–2294. doi: 10.1152/ajpheart.2000.279.5.H2285. [DOI] [PubMed] [Google Scholar]
- 28.Murrant CL, Sarelius IH. Multiple dilator pathways in skeletal muscle contraction-induced arteriolar dilations. Am J Physiol Regul Integr Comp Physiol. 2002;282:R969–978. doi: 10.1152/ajpregu.00405.2001. [DOI] [PubMed] [Google Scholar]
- 29.Naik JS, Valic Z, Buckwalter JB, Clifford PS. Rapid vasodilation in response to a brief tetanic muscle contraction. J Appl Physiol. 1999;87:1741–1746. doi: 10.1152/jappl.1999.87.5.1741. [DOI] [PubMed] [Google Scholar]
- 30.Poole DC, Ferreira LF. Oxygen exchange in muscle of young and old rats: muscle- vascular-pulmonary coupling. Exp Physiol. 2007;92:341–346. doi: 10.1113/expphysiol.2006.036764. [DOI] [PubMed] [Google Scholar]
- 31.Poole DC, Ferreira LF, Behnke BJ, Barstow TJ, Jones AM. The final frontier: oxygen flux into muscle at exercise onset. Exerc Sport Sci Rev. 2007;35:166–173. doi: 10.1097/jes.0b013e318156e4ac. [DOI] [PubMed] [Google Scholar]
- 32.Schrage WG, Woodman CR, Laughlin MH. Hindlimb unweighting alters endothelium-dependent vasodilation and ecNOS expression in soleus arterioles. J Appl Physiol. 2000;89:1483–1490. doi: 10.1152/jappl.2000.89.4.1483. [DOI] [PubMed] [Google Scholar]
- 33.Secomb TW, Pries AR. Information transfer in microvascular networks. Microcirculation. 2002;9:377–387. doi: 10.1038/sj.mn.7800146. [DOI] [PubMed] [Google Scholar]
- 34.Segal SS. Cell-to-cell communication coordinates blood flow control. Hypertension. 1994;23:1113–1120. doi: 10.1161/01.hyp.23.6.1113. [DOI] [PubMed] [Google Scholar]
- 35.Segal SS. Regulation of blood flow in the microcirculation. Microcirculation. 2005;12:33–45. doi: 10.1080/10739680590895028. [DOI] [PubMed] [Google Scholar]
- 36.Sparks HV. Effect of local metabolic factors on vascular smooth muscle. In: Bohr DF, Somlyo AP, Sparks HV, editors. Handbook of Physiology The Cardiovascular System Vascular Smooth Muscle. Bethesda, MD: American Physiological Society; 1980. pp. 475–513. [Google Scholar]
- 37.Tschakovsky ME, Shoemaker JK, Hughson RL. Vasodilation and muscle pump contribution to immediate exercise hyperemia. Am J Physiol. 1996;271:H1697–1701. doi: 10.1152/ajpheart.1996.271.4.H1697. [DOI] [PubMed] [Google Scholar]
- 38.VanTeeffelen JW, Segal SS. Rapid dilation of arterioles with single contraction of hamster skeletal muscle. Am J Physiol Heart Circ Physiol. 2006;290:H119–127. doi: 10.1152/ajpheart.00197.2005. [DOI] [PubMed] [Google Scholar]
- 39.Welsh DG, Segal SS. Coactivation of resistance vessels and muscle fibers with acetylcholine release from motor nerves. Am J Physiol. 1997;273:H156–163. doi: 10.1152/ajpheart.1997.273.1.H156. [DOI] [PubMed] [Google Scholar]
- 40.Wunsch SA, Muller-Delp J, Delp MD. Time course of vasodilatory responses in skeletal muscle arterioles: role in hyperemia at onset of exercise. Am J Physiol Heart Circ Physiol. 2000;279:H1715–1723. doi: 10.1152/ajpheart.2000.279.4.H1715. [DOI] [PubMed] [Google Scholar]
- 41.Zweifach BW, Kovalcheck S, De Lano F, Chen P. Micropressure-flow relationships in a skeletal muscle of spontaneously hypertensive rats. Hypertension. 1981;3:601–614. doi: 10.1161/01.hyp.3.5.601. [DOI] [PubMed] [Google Scholar]
Associated Data
This section collects any data citations, data availability statements, or supplementary materials included in this article.