

Abstract
J Clin Hypertens (Greenwich). 2010;12:136–144. ©2009 Wiley Periodicals, Inc.
It has been known that each component of the metabolic syndrome (MS) has an atherogenic potential and increases the risk of cardiovascular events. Therefore, patients who have MS are candidates for the development of atherosclerosis and accompanying complications. In this study, the authors assessed the levels of acute phase reactants as an indicator of inflammation in patients with MS. Twenty‐five patients with recently diagnosed MS and not treated before who had at least 3 of 5 diagnostic criteria of MS listed in the Third Report of the Adult Treatment Panel National Cholesterol Education Program (NCEP‐ATP III) guidelines were included in the study. Twenty healthy patients constituted the control group. Inflammatory parameters were compared between the groups. There was no significant difference between the MS and control group with regard to age and sex. White blood cell count (/mm3), high‐sensitivity C‐reactive protein (hs‐CRP), uric acid, interleukin (IL) 6, and fibrinogen levels were found to be significantly higher in the MS group. Number of MS components was strongly correlated with serum levels of hs‐CRP (r=0.688, P=.0001), IL‐6 (r=0.546, P=.0001), fibrinogen (r=0.551, P=.0001), uric acid (r=0.517, P=.0001), and leucocyte count (/mm3) (r=0.456, P=.002). Inflammation plays an important role in atherosclerotic complications, which is activated in MS. Increased number of MS components are strongly associated with elevated inflammatory and metabolic markers. Measurement of serum inflammatory parameters in patients with MS may be beneficial in detection and management of cardiovascular events and in the assessment of efficacy of treatment.
The metabolic syndrome (MS) is a growing general public health problem all around the world. Components of the MS including diabetes, hypertension, dyslipidemia, and obesity are closely associated with the risk factors defined for cardiovascular diseases, and it is known that each of these components has an atherogenic feature and increases the risk of coronary heart disease. In addition to diagnosis criteria of the MS, some other components of the disease, including proinflammatory and prothrombotic status, were also described in the Third Report of the Adult Treatment Panel National Cholesterol Education Program (NCEP‐ATP III). 1
Chronic subclinic inflammation is an important part of the MS, and insulin resistance is closely associated with C‐reactive protein (CRP). 2 Also, a multitude of evidences obtained from various clinical and laboratory researches have supported that even atherosclerosis itself is not only a simple lipid accumulation into the vascular wall, but mainly an inflammatory disease of the arteries. 3
Many animal models have demonstrated that some evidences of inflammation could be found in the arterial wall during the early phase of atherosclerotic plaque development. A number of inflammatory cytokines, including interferon γ, interleukin (IL) 6, tumor necrosis factor α (TNF‐α)–stimulating macrophages, vascular endothelial cells, and smooth muscle cells are thought to lead to development of atherosclerotic plaques and moreover to lead to rupture of these unstable plaques. 4 , 5
This low‐grade inflammation, which has been used to estimate the risk for future cardiovascular events, could be thought to set up a link between the MS and atherosclerosis. In this study, we assessed the levels of acute phase reactants as an indicator of inflammation in MS.
Materials and Methods
Twenty‐five patients with MS (17 women, 8 men; mean age, 51.6±8.2 years) who had no findings of coronary artery disease in noninvasive laboratory tests and to have any medical treatment were included in the study. Twenty healthy patients constituted the control group (13 women, 7 men; mean age, 47.9±9.2 years). Each patient provided informed consent for the study, which was approved by the institutional ethics committee.
Patients were excluded from participating in the study for the following reasons: liver or renal dysfunction, acute or chronic inflammatory disease, rheumatologic disorders, malignancy, hematological disorders, left ventricular (LV) systolic dysfunction, atrial fibrillation, thyroid gland dysfunction, autoimmune disease, or current use of oral contraceptive, anticoagulant, antiplatelet, steroidal, or nonsteroidal drugs. Diabetes mellitus was not an exclusion criterion. Diabetes mellitus has been accepted as the high‐risk category for coronary artery disease rather than as a risk factor for MS.
Waist circumference was measured in the mid‐point of distance between the costal arc and iliac crista when the patient was standing up and in mid‐expirium, and hip circumference was measured in the level of major trochanters. Weight, body fat percentage, and body mass index (BMI) calculation were obtained using the Tanita Body Composition Analyzer TBF‐300M (Tanita Corporation, Tokyo, Japan).
Hypertension is one of the MS components, and for that reason we measured blood pressure in all patients. In accordance with American Heart Association guidelines, blood pressure was measured with an aneroid sphygmomanometer in an office setting. The first and fifth phases of Korotkoff sounds were used for systolic and diastolic blood pressure. Appropriate cuff sizes were chosen for each patient’s arm circumference. Blood pressure was measured 3 times by the same skilled, trained physician after patients had rested for 15 minutes in the sitting position, and the average of the measurements was recorded. The patients who had a systolic blood pressure >130 mm Hg and/or diastolic blood pressure >85 mm Hg were classified as having hypertension.
Laboratory Studies
Blood samples were taken after an overnight fast for the measurement of blood glucose, erythrocyte sedimentation rate (ESR), total and high‐density lipoprotein (HDL) cholesterol, and triglycerides. Low‐density lipoprotein (LDL) cholesterol was calculated by Friedewald formula. Urinary albumin concentration was measured by immunonephelometry, as a spot collection on a fresh morning sample. Venous blood samples withdrawn to assay the levels of IL‐6 and TNF‐α were centrifuged to obtain serum, and serum samples were replaced into Eppendorf tubes. Enzyme‐linked immunosorbent assay technique was performed to assay IL‐6 and TNF‐α levels, Clauss technique in fibrinogen, and immunoturbidimetry in high‐sensitivity CRP (hs‐CRP).
Echocardiographic Examination
Patients were studied using 2‐dimensionally guided M‐mode echocardiography in standard views. 6 LV internal dimension, interventricular septal thickness and LV posterior wall thickness were measured at end‐diastole. Recordings were analyzed by two investigators who were unaware of patients’ clinic and laboratory findings. The measurements were averaged from 5 consecutive cardiac cycles. Interobserver variability was 3.5%. LV mass (LVM) was calculated using the formula validated by Devereux RB and colleagues: 7
LVM index (g/m2) was obtained by dividing LVM by body surface area (BSA). LVM was normalized for body height and BSA. 7 , 8 The cutoffs of 134 g/m2 for men and 110 g/m2 for women developed in the Framingham Heart Study were used to define the presence of LV hypertrophy. 8 , 9 , 10
Assessment of Peripheral Vascular Endothelial Functions
Vascular studies were performed in the morning while the patients were fasting, in a quiet and temperature‐controlled (22°C) room. Brachial artery diameter was measured from B‐mode ultrasound images. The brachial artery was scanned in the longitudinal section 2‐ to 5‐cm above the elbow, and the center of the artery was identified when the clearest pictures of the anterior and posterior intimal layers were obtained. When a satisfactory transducer position was found, the skin was marked and the arm and transducer remained in the same position throughout the study. Depth and gain settings were set to optimize images of the lumen/arterial wall interface, images were magnified using a resolution box function, and the operating parameters were not changed during the examination. Imaging studies of the left brachial artery were performed using a high‐resolution ultrasound (3–11 MHz) linear transducer following 30 minutes of rest, based on the guidelines for the ultrasound assessment of endothelial‐dependent flow‐mediated dilatation (FMD) of the brachial artery reported by Corretti and colleagues. 11 Baseline measurements including brachial artery diameter and flow velocity were measured. Endothelium‐dependent vasodilatation was assessed by measuring the changes in the diameter of the brachial artery during reactive hyperemia created by an inflated cuff on the upper arm. The cuff was released after 5 minutes. The arterial flow was immediately recorded and the arterial diameter was measured at 60 to 90 seconds after deflation. Five cardiac cycles were analyzed and measurements were averaged. To determine the endothelium‐independent, nitroglycerin‐mediated vasodilation (NMD), sublingual nitroglycerin spray (400 μg) was administered after another 15 minutes of rest. Brachial artery scans were performed again at the same position 4 minutes later, after the nitroglycerin spray was administered. Measurements were taken from the anterior to the posterior interface between media and adventitia (m line) at end‐diastole (timed by QRS complex). FMD and NMD were expressed as a percent increase of the baseline value of the diameter.
Statistical Analysis
Data are presented as mean ± standard deviation [SD] for continuous variables and as proportions for categoric variables. Age, body mass index, waist circumference, total cholesterol, triglyceride, LDL cholesterol, HDL cholesterol, fasting glucose, glycated hemoglobin A1c (HbA1c), creatinine, uric acid, ESR, fibrinogen, LVM, FMD, and NMD assessments showed parametric distribution in the control and study groups. Independent t test was used for intragroup numeric comparisons. The fat percentage, urinary albumin excretion, urinary albumin excretion/creatinine, CRP, IL‐6, and TNF‐α showed nonparametric distribution (Kolmogorov‐Smirnov test, P<.001). The number of MS components were graded 0 to 5 for correlation analysis. Spearman correlation was used to test bivariate correlation. Binary logistic regression analysis was done with MS as a dependent variable. A sample size of 18 patients per group was estimated on the basis of an SD of 0.3 mg/dL, a 0.4 mg/dL mean difference between groups, and 80% power at a .05 significance level to reject to null hypothesis of equal means for the control group vs MS group. Data were analyzed using SPSS statistical software (version 10.0; SPSS Inc, Chicago, IL).
Results
Demographic features and biochemical and inflammatory parameters of the study groups are shown in Table I. There were no significant differences in sex distribution and mean age between cases and controls. BMI, waist circumference, hip circumference, and body fat percentage were significantly higher in patients with MS. Total cholesterol, triglycerides, LDL, fasting blood glucose, HbA1c, uric acid, and urinary albumin excretion levels were significantly higher in patients with MS. HDL level was significantly higher in the control group. Serum levels of urea and creatinine were similar between the groups.
Table.
Demographic Features and Echocardiographic, Biochemical, and Inflammatory Parameters of the Study Groups
| Study Group (n=25) | Control Group (n=20) | P Value | |
|---|---|---|---|
| Sex, female/male | 17/8 | 13/7 | .832 |
| Mean age, y | 51.6±8.2 | 47.9±9.2 | .166 |
| Body mass index, kg/m2 | 35.6±5.5 | 24.3±2.5 | .0001 |
| Waist circumference, cm | 107.4±11.5 | 83.3±8.1 | .0001 |
| Hip circumference, cm | 117.0±12.4 | 94.4±7.0 | .0001 |
| Waist/hip circumference ratio | 0.9±0.09 | 0.9±0.06 | .07 |
| Body fat percentage, % | 39.7±7.4 | 23.5±7.0 | .0001 |
| Total cholesterol, mg/dL | 227.3±33.1 | 183.9±25.2 | .0001 |
| Triglyceride, mg/dL | 229.4±65.6 | 100.9±40.9 | .0001 |
| LDL cholesterol, mg/dL | 135.2±34.1 | 115.9±18.5 | .03 |
| HDL cholesterol, mg/dL | 44.8±8.3 | 59.8±12.1 | .0001 |
| Left ventricular mass index, g/m2 | 91.50±16.78 | 86.44±15.27 | .302 |
| Fasting glucose, mg/dL | 132.0±38.5 | 88.6±8.5 | .0001 |
| HbA1c, % | 6.7±1.7 | 4.8±0.4 | .0001 |
| Urea, mg/dL | 28.7±8.2 | 29.5±6.5 | .701 |
| Creatinine, mg/dL | 0.85±0.11 | 0.80±0.12 | .136 |
| Uric acid, mg/dL | 5.7±1.0 | 4.4±1.2 | .0001 |
| Urinary albumin excretion, mg/L | 36.5±40.6 | 8.9±11.4 | .005 |
| White blood cell count, 103/mm3 | 8.37±1.76 | 6.84±0.90 | .001 |
| ESR, mm/h | 8.2±3.1 | 6.4±2.4 | .037 |
| hs‐CRP, mg/dL | 0.6±0.3 | 0.1±0.1 | .0001 |
| Interleukin 6, pg/mL | 5.8±3.9 | 2.5±1.2 | .001 |
| TNF‐α, pg/mL | 2.2±1.1 | 1.9±0.5 | .207 |
| Fibrinogen, mg/dL | 387.8±95.9 | 306.9±30.2 | .001 |
| Flow‐mediated dilation, % | 6.5±4.3 | 10.7±3.5 | .001 |
Abbreviations: ESR, erythrocyte sedimentation rate; HbA1c, hemoglobin A1c; HDL, high‐density lipoprotein; hs‐CRP, high‐sensitivity C‐reactive protein; LDL, low‐density lipoprotein; TNF‐α, tumor necrosis factor α.
Markers of inflammation including white blood cell count, sedimentation rate (ESR), CRP, fibrinogen, and IL‐6 levels were significantly higher in patients with MS. Although TNF‐α level was found elevated in the study group, difference between the groups did not reach a statistically significant level. Number of MS components was strongly correlated with serum levels of CRP (r=0.688, P=.0001), IL‐6 (r=0.546, P=.0001), fibrinogen (r=0.551, P=.0001), uric acid (r=0.517, P=.0001) (Figure 1), urinary albumin excretion (r=0.434, P=.003), and leucocyte count (/mm3) (r=0.456, P=.002). FMD (%) was inversely correlated with CRP levels (r=−0.505, P=.0001) (2, 3, 4, 5, 6).
Figure 1.
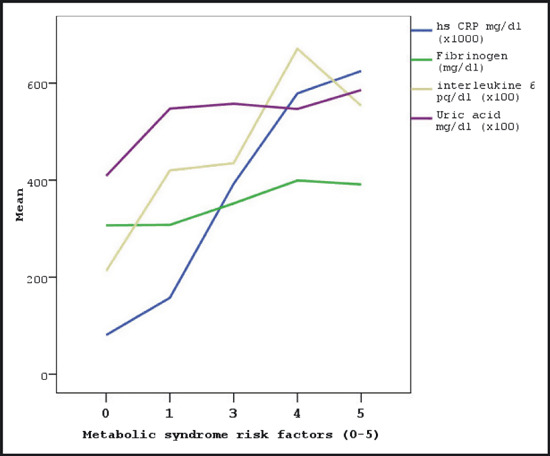
The relationship between the number of metabolic syndrome components and serum markers. hs CRP indicates high‐sensitivity C‐reactive protein.
Figure 2.
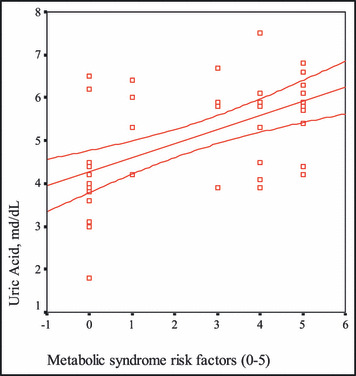
The correlation between the number of metabolic syndrome risk factors and uric acid levels.
Figure 3.
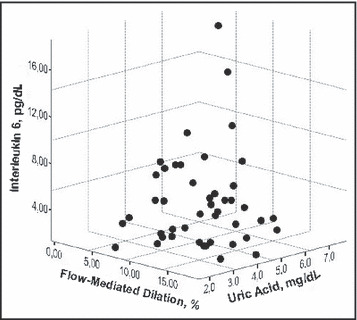
The association among interleukin‐6, flow‐mediated dilatation, and uric acid.
Figure 4.
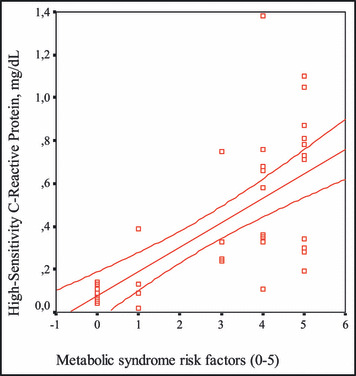
The correlation between the number of metabolic syndrome risk factors and high‐sensitivity C‐reactive protein levels.
Figure 5.
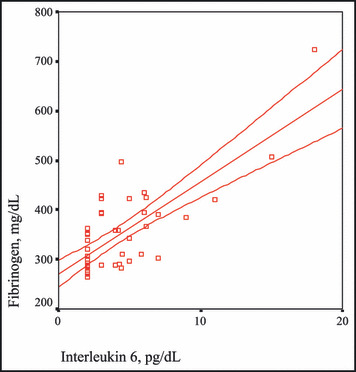
The correlation between interleukin 6 and fibrinogen levels.
Figure 6.
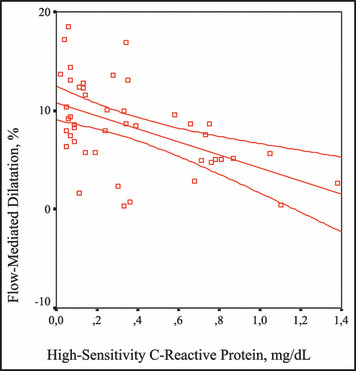
The correlation between high‐sensitivity C‐reactive protein levels and flow‐mediated dilatation.
Distribution of the patients according to presence of NCEP‐ATP III criteria as represented in Figure 7 was found as abdominal obesity in all patients (100%), elevated triglycerides in 24 patients (96%), low HDL level in 17 patients (68%), hypertension in 24 patients (96%), and elevated fasting blood glucose in 18 patients (72%). Twenty‐four of 25 patients had at least 3 MS risk factors without including high plasma fasting glucose criteria. One patient had 2 risk factors and a high plasma fasting glucose level (125 mg/dL). Twelve patients were diagnosed with diabetes mellitus. FMD values were significantly low in the study group. There were no significant differences in LVM index between cases and controls (P=.302).
Figure 7.
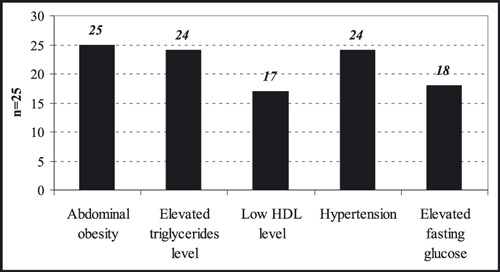
The distribution of the patients according to presence of Third Report of the Adult Treatment Panel National Cholesterol Education Program (NCEP ATP III) criteria in the study group. HDL indicates high‐density lipoprotein.
Discussion
In this study, it was intended to assess whether patients recently diagnosed with MS but not having medical treatment have increased serum levels of inflammatory mediators, and to assess whether there is a relationship among the components of the MS and inflammation. Additionally, the influence of inflammation on endothelial function was measured. Relatively pure group of patients with MS has been investigated in the present study.
Low‐degree inflammation in the vascular endothelium is the first step in the atherosclerotic process. The components of MS, which are the risk factors for coronary artery disease, are such similar pathological conditions that similar origins for these disorders mixed with each other could be easily advocated. Inflammation is the main issue in both situations. Also, in addition to inflammation, effects of immune system and neurohormonal activity are considered. 12 , 13
In our study, there was no difference in age and sex between the two groups according to demographic data. In addition, that all the patients included in the study were recently diagnosed with the MS, that none of them had received any antihypertensive, anticholesterol, or antidiabetic drug, and that had smoked before the onset of the study were important features of our report. As expected, other demographic data including weight, BMI, body fat percentage, waist and hip circumferences, and systolic and diastolic blood pressures were found to be significantly high in the patients with MS compared with the control patients.
Aside from being energy storage for the body, adipose tissue also releases several cytokines and peptides similar to an endocrine gland. 2 In this study, we revealed a relationship between the presence of abdominal obesity and high levels of inflammatory parameters. A relationship between abdominal obesity and insulin resistance has been shown. 1 , 14 , 15 , 16 , 17 Low‐grade physical activity and unbalanced nourishment along with abdominal obesity facilitate the occurrence of insulin resistance. According to body fat distribution, any increase in the mass of abdominal fat is an important determiner of mortality and morbidity and is in relation to many cardiovascular risk factors. 18 , 19 , 20
Two groups were compared with respect to lipid profiles of the cases in our study. Statistically significant elevations in levels of total cholesterol, triglycerides, and LDL cholesterol and a significantly decreased level of HDL cholesterol were detected in the patients with the MS compared with the control group. This picture was appropriate for dyslipidemia defined in the MS criteria. 21 Hyperinsulinism along with insulin resistance is a frequently observed situation. 22 Generally, disorders of uric acid metabolism accompany hyperinsulinism, and raised uric acid levels are detected. In our study, uric acid levels were high and had a positive correlation with the number of risk factors in the patients with MS. Urinary albumin excretion, an important determiner of cardiovascular morbidity and endothelial dysfunction, is also an important risk stratification method.
It has been claimed that there is a chronic and low‐degree inflammatory status in the MS. CRP indicates the existence and degree of inflammation involving the vascular endothelium. Elevation of CRP related with insulin resistance in MS has been shown in the Insulin Resistance (IRA) study by Festa and colleagues. 2 Also, in the study of the Third National Health and Nutrition Examination Survey by Ford and colleagues, which included 8570 patients older than 20 years in which cases with the MS were compared with cases without syndrome, it was found that hs‐CRP and fibrinogen levels and leukocyte counts were significantly high in patients with the MS. 23 There are also studies that have revealed the relationship between hs‐CRP and coronary artery disease. 19 , 20 , 21 , 22 , 23 , 24 Yet, it is still controversial as to whether hs‐CRP is an inflammatory parameter or a risk factor. In our study, hs‐CRP levels were significantly high in patients with the MS and had a positive correlation with IL‐6 levels. When each of the MS criteria (high blood pressure, high level of triglycerides, low HDL level, abdominal obesity, high fasting glucose level) were considered to be a cardiovascular risk factor, it was found in our study that total number of risk factors detected in each case was correlated with the hs‐CRP level, which means that the higher number of risk factors a patient had, the higher the hs‐CRP level. Similarly, Kang and colleagues 25 have shown a relationship between serum levels of hs‐CRP and components of the MS in patients with type II diabetes mellitus. Frohlich and colleagues 26 also reported similar findings. In the same way, we researched a case group that included MS patients recently diagnosed and never treated for a similar relationship. It has been found in many reports that high hs‐CRP levels are closely related with the risk of cardiovascular events. 27 , 28 , 29 , 30 It was shown in the Physicians Health Study that the higher CRP levels the healthy cases had, the higher cardiovascular risk they would have in the future. 31 That hs‐CRP has been used to determine the cardiovascular risk, and that it has a very stable structure without any diurnal variation and a simplified automatic measuring method for plasma and serum, are the positive characteristics of hs‐CRP for routine usage. 32 , 33 All these findings may indicate that the combination of risk factors of the MS is a powerful predictor of the increased risk of a cardiovascular event accompanied by inflammatory status.
IL‐6 is a cytokine of inflammatory response and leads the liver to release CRP and fibrinogen. 34 Aside from inflammation, IL‐6 also plays an important role in hematopoiesis, immune response, and fat metabolism. One third of IL‐6 detected in circulation is released from adipocytes and is done so in higher amounts from abdominal fat tissue than from subcutaneous fat tissue. 35 All these findings claim the relationship between IL‐6 and the MS. An increase in level of IL‐6 related with the MS components including high fasting blood sugar with insulin resistance and abdominal obesity was reported by Fernandez and colleagues. 36 In our study, we also found that IL‐6 levels were strongly correlated with fibrinogen levels. The measurement of IL‐6 levels, which is positively correlated with fibrinogen levels, may be beneficial to reveal the thrombotic and inflammatory status.
We also assessed TNF‐α levels; another important mediator of inflammation. TNF‐α predominantly released from macrophages and endothelial cells has a regulatory function in inflammation, hematopoiesis, and the immune system. 2 It has been shown in many studies conducted on the components of the MS that TNF‐α especially has an important role in insulin sensitivity, lipid metabolism, and abdominal obesity. 23 , 37 , 38 , 39 Although TNF‐α levels were high in the patients with the MS compared with the control group in our study, the difference between the groups did not reach a statistically significant level.
In addition, fibrinogen levels, ESR, and leukocyte counts were measured and compared in the study, and ESR and leukocyte counts were found to be significantly high in the MS group compared with the control group, pointing to an elevated inflammatory response. It has been found in many reports that fibrinogen levels were high in patients with the MS, which could indicate high thrombotic activity. 21 , 28 , 40 , 41 , 42 , 43 , 44
Endothelial tissue having endocrine, paracrine, and autocrine functions is one of the most important tissues of the body. Endothelial dysfunction and inflammation should be evaluated together. A high correlation between insulin sensitivity and basal nitric oxide production in healthy patients and a decreased endothelium‐dependent vasodilator response in patients with insulin resistance have been reported. 45 , 46 , 47 The balance between vascular protective effects of insulin via nitric oxide and proliferation of vascular smooth cells is impaired by insulin resistance. Hence, stimulation of vascular smooth cells by insulin resistance causes a subsequent decrease in nitric oxide release to shift the balance in the endothelial cell to a proatherogenic status. 48 Endothelial functions of all patients in our study were assessed using both FMD and NMD methods. When the proportions of brachial artery radii to basal values in adequately performed FMD were calculated, significantly low values were obtained in the MS group compared with the control group. There was no significant difference between groups in NMD values. A significantly negative correlation between FMD values and levels of hs‐CRP and IL‐6 was revealed. All of these results seem to support the development of inflammation accompanied by endothelial dysfunction in the MS. As mentioned previously, endothelial dysfunction is the first step of atherosclerosis, and the fact that endothelial dysfunction occurred in these patients indicates an increased risk of cardiovascular events accompanied by the increased occurrence of atherosclerosis.
Unfortunately, atherosclerosis is the most frequent cause of mortality and morbidity around the world. Vascular inflammation, the first step of atherosclerosis, occurs naturally in the MS and has an important role in the development of atherosclerotic complications. For that reason, patients with the MS are the most susceptible candidates at risk for developing atherosclerosis and its complications. We found a strong correlation between the number of components occurring in patients with the MS and the levels of metabolic and inflammatory markers of patients in the study. Also, the increased levels of inflammatory markers led to impairment of endothelial functions. It is controversial whether inflammation causes insulin resistance in the MS or vice versa. Another important problem caused by inflammation is prothrombotic status. Results obtained from the study could indicate that monitoring inflammatory parameters in patients with the MS is beneficial to assess the risk for developing cardiovascular diseases and to predict future cardiovascular events.
Conclusions
We believe that monitoring these inflammatory markers following cardiovascular events may have an important role in the assessment of efficiency of medical and interventional treatments. Unfortunately, the scarcity of patients in our study and the extremely high expense of monitoring various markers limited our study. Further detailed investigations performed on these markers to reveal the interactions between markers and various clinical situations may provide the common use of them in the future.
References
- 1. Expert Panel on Detection, Evaluation, and Treatment of High Blood Cholesterol in Adults . Executive Summary of the Third Report of the National Cholesterol Education Program (NCEP) (Adult Treatment Panel III). JAMA. 2001;285:2486–2497. [DOI] [PubMed] [Google Scholar]
- 2. Festa A, D’Agostino R, Howard G, et al. Choronic subclinical inflammation as part of the insulin resistance syndrome The Insulin Resistance Study (IRAS). Circulation. 2000;102:42–47. [DOI] [PubMed] [Google Scholar]
- 3. Ross R. Atherosclerosis‐an inflammatory disease. N Engl J Med. 1999;340:115–126. [DOI] [PubMed] [Google Scholar]
- 4. Hansson G, Libby P. The Role of the Lymphocyte: Atherosclerosis and Coronary Artery Disease. New York, NY: Lippincott Raven. 1997;557–568. [Google Scholar]
- 5. Libby P, Simon DI. Inflammation and thrombosis: the clot thickens. Circulation. 2001;103:1718–1720. [DOI] [PubMed] [Google Scholar]
- 6. Sahn DJ, DeMaria A, Kisslo J, et al. The Committee on M‐mode standardization of the American Society of Echocardiography: recommendations regarding quantitation in M‐ mode echocardiography: results of a survey of echocardiographic measurements. Circulation. 1978;58:1072–1083. [DOI] [PubMed] [Google Scholar]
- 7. Devereux RB, Alonso DR, Lutas EM, et al. Echocardiographic assessment of left ventricular hypertrophy: comparison to necropsy findings. Am J Cardiol. 1986;57:450–458. [DOI] [PubMed] [Google Scholar]
- 8. Savage DD, Levy D, Dannenberg AL, et al. Association of echocardiographic left ventricular mass with body size, blood pressure and physical activity (The Framingham Study). Am J Cardiol. 1990;65:371–376. [DOI] [PubMed] [Google Scholar]
- 9. Levy D, Savage DD, Garrison RJ, et al. Echocardiographic criteria for left ventricular hypertrophy: the Framingham Heart Study. Am J Cardiol. 1987;59:956–960. [DOI] [PubMed] [Google Scholar]
- 10. Daniels SR, Kimball TR, Morrison JA, et al. Indexing left ventricular mass to account for differences in body size in children and adolescents without cardiovascular disease. Am J Cardiol. 1995;76:699–701. [DOI] [PubMed] [Google Scholar]
- 11. Corretti MC, Anderson TJ, Benjamin EJ, et al. International Brachial Artery Reactivity Task Force. J Am Coll Cardiol. 2002;39(2):257–265. [DOI] [PubMed] [Google Scholar]
- 12. Das UN. Mini‐review: Is metabolic syndrome X an inflammatory condition? Exp Biol Med. 2002;227:989–997. [DOI] [PubMed] [Google Scholar]
- 13. Björntorp P, Rosmond R. The metabolic syndrome: a neuroendocrine disorder? Br J Nutr. 2000;83(suppl 1):S49–S57. [DOI] [PubMed] [Google Scholar]
- 14. Ford ES, Giles WH. A comparison of the prevalence of the metabolic syndrome using two proposed definitions. Diabetes Care. 2003;26:575–581. [DOI] [PubMed] [Google Scholar]
- 15. Henry RR. Glucose control and insulin resistance in non‐insulin‐dependent diabetes mellitus. Ann Intern Med. 1996;124:97–103. [PubMed] [Google Scholar]
- 16. Valdez R, Athens MA, Thompson GH, et al. Birth weight and adult health outcomes in a bietnich population on the USA. Diabetologia. 1994;37:624–631. [DOI] [PubMed] [Google Scholar]
- 17. Jaquet D, Gaboruai A, Czernichow P, et al. Insulin resistance early in adulthood in subjects with intrauterine growht retardation. J Clin Endocrinol Metab. 2000;85:1401–1406. [DOI] [PubMed] [Google Scholar]
- 18. Hales CN, Barker DJ, Clark PM, et al. Fetal and infant growth and impaired glucose tolerance at age of 64. Br Med J. 1991;303:1019–1022. [DOI] [PMC free article] [PubMed] [Google Scholar]
- 19. Bennett PH. Diabetes mellitus in Pima Indians. Lancet. 1971;2:488–489. [DOI] [PubMed] [Google Scholar]
- 20. Howard BV, Lee ET, Pettit DJ, et al. Plasma and lipoprotein cholesterol and triglyceride concentrations in the Pima Indians: distributions differing from those of Caucasians. Circulation. 1983;68:714–724. [DOI] [PubMed] [Google Scholar]
- 21. Collins V, Dowse G, Finch C, et al. An inconsistent relationship between insulin and blood pressure in three Pacific Island populations. J Clin Epidemiol. 1990;43:1369–1378. [DOI] [PubMed] [Google Scholar]
- 22. Saad MF, Lillioja S, Nyomba B, et al. Racial differences in the relation between blood pressure and insulin resistance. N Engl J Med. 1991;324:733–739. [DOI] [PubMed] [Google Scholar]
- 23. Ford ES, Giles WH, Dietz WH. Prevalence of the metabolic syndrome among US adults: Findings from the Third National Health and Nutrition Examination Survey. JAMA. 2002;287:356–359. [DOI] [PubMed] [Google Scholar]
- 24. Pearson TA, Mensah GA, Alexander RW, et al. Markers of inflammation and cardiovascular disease: application to clinical and public health practice: a statement for healthcare professionals from the Centers for Disease Control and Prevention and the American Heart Association. Circulation. 2003;107:499. [DOI] [PubMed] [Google Scholar]
- 25. Kang ES, Kim HJ, Ahn CW, et al. Relationship of serum high sensitivity C‐reactive protein to metabolic syndrome and microvascular complications in type 2 diabetes. Diabetes Res Clin Pract. 2005;69(2):151–159. [DOI] [PubMed] [Google Scholar]
- 26. Frohlich M, Imhof A, Breg G, et al. Association between C‐reactive protein and features of metabolic syndrome: a population based study. Diabetes Care. 2000;23(12):1835–1839. [DOI] [PubMed] [Google Scholar]
- 27. Tchernof A, Lamarche B, Prud’Homme D, et al. The dense LDL phenotype: association with plasma lipoprotein levels, visceral obesity, and hyperinsulinemia in men. Diabetes Care. 1996;19:629–637. [DOI] [PubMed] [Google Scholar]
- 28. Taylor SI, Cama A, Accili D, et al. Mutations in the insulin receptor gen. Endocr Rev. 1992;13:566–595. [DOI] [PubMed] [Google Scholar]
- 29. Muller‐Wieland D, Taub R, Tewari DS, et al. Insulin receptor gene and its expression in patients with insulin resistance. Diabetes. 1989;38:31–38. [DOI] [PubMed] [Google Scholar]
- 30. Prochazka M, Lillioja S, Tait JF, et al. Lingake of chromosomal markers on 4q with a putative gene determining maximal insulin action in Pima Indians. Diabetes. 1993;42:514–519. [DOI] [PubMed] [Google Scholar]
- 31. Baier LJ, Sacchettini JC, Knowler WC, et al. An amino acid subsitution in the human intestinal fatty acid binding, increased fat oxidation, and insulin resistance. J Clin Invest. 1995;95:1281–1287. [DOI] [PMC free article] [PubMed] [Google Scholar]
- 32. Ikonomidis I, Andreotti F, Economou E, et al. Increased proinflammatory cytokines in patients with chronic stable angina and their reduction by aspirin. Circulation. 1999;100:793–798. [DOI] [PubMed] [Google Scholar]
- 33. Ridker PM, Rifai N, Pfeffer MA, et al. Long term effects of pravastatin on plasma concentration of C‐reactive protein: the Cholesterol and Recurrent Events (CARE) Investigators. Circulation. 1999;100:230–235. [DOI] [PubMed] [Google Scholar]
- 34. Groop L, et al. Metabolic consequences of a family history of NIDDM (The Botnia Study): evidence for sex‐specific parental effects. Diabetes. 1996;45:1585–1593. [DOI] [PubMed] [Google Scholar]
- 35. Bjorntorp P, Rosmond R The metabolic syndrome: a neuroendocrine disorder?. Br J Nutr. 2000;83:49–57. [DOI] [PubMed] [Google Scholar]
- 36. Fernadez‐Real JM, Ricart W. Insulin resistance and chronic cardiovascular inflammatory syndrome. Endocr Rev. 2003;24(3):278–301. [DOI] [PubMed] [Google Scholar]
- 37. Das UN: Is metabolic syndrome X an inflammatory condition? Exp Biol Med. 2002;227:989–997. [DOI] [PubMed] [Google Scholar]
- 38. Mohemad‐Ali V, Goodrick S, Rawesh A, et al. Subcutaneous adipose tissue releases interleukin‐6, but not tumour necrosis factor‐α, in vivo. J Clin Endocrinol Metab. 1997;82:4196–4200. [DOI] [PubMed] [Google Scholar]
- 39. Baumann H, Gauldie J. The acute phase response. Immunol Today. 1994;15:74–80. [DOI] [PubMed] [Google Scholar]
- 40. Onat A, Ceyhan K, Sansoy V, et al. Erişkinlerimizin yarısında bulunan Dislipidemi ve metabolik sendromun özellikleri ve kombine hiperlipidemi ile ilişkisi. Turk Kardiyol Dern Ars. 2001;29:274–285. [Google Scholar]
- 41. Jialal I, Deveraj S, Inflammation and atherosclerosis: the value of the high sensitive C‐reactive protein assay as a marker. Am J Clin Pathol. 2001;116:(suppl 1) 108–115. [DOI] [PubMed] [Google Scholar]
- 42. Vigushin DM, Pepys MB, Hawkins PN. Metabolic and scintigraphic studies of radioiodinated human C‐reactive protein in health and disease. J Clin Invest. 1993;91:1351–1357. [DOI] [PMC free article] [PubMed] [Google Scholar]
- 43. Pasceri V, Willerson JT, Yeh EHT. Direct pro‐inflammatory effect of C‐reactive protein on human endotelial cells. Circulation. 2000;102:2165–2168. [DOI] [PubMed] [Google Scholar]
- 44. Volanakis JE. Human C‐reactive protein: expression, structure, and function. Mol Immunol. 2001;38:189–197. [DOI] [PubMed] [Google Scholar]
- 45. Petne JR, Ueda S, Webb DJ, et al. Endothelial nitric oxide production and insulin sensitivity: a physiological link with implications for pathogenesis of cardiovascular disease. Circulation. 1996;93:1331–1333. [DOI] [PubMed] [Google Scholar]
- 46. Steinberg HO, Chaker H, Learning R, et al. Obesity/insulin resistance is associated with endothelial dysfunction Implications for the syndrome of insulin resistance. J Clin Invest. 1996;97:2601–2610. [DOI] [PMC free article] [PubMed] [Google Scholar]
- 47. Duygu H. Endothelial functions and hypertension. J Card Res. 2007;5:90–98. [Google Scholar]
- 48. Hsueh WA, Law RE. Cardiovascular risk continuum: implications of insulin resistance and diabetes. Am J Med. 1998;105:4S–14S. [DOI] [PubMed] [Google Scholar]