

Abstract
Purpose
The optimal roles for imaging-based biomarkers in the management of head and neck cancer remain undefined. Unresolved questions include whether functional or anatomic imaging biomarkers might improve mortality risk assessment for this disease. We addressed these issues in a prospective institutional trial.
Methods and Materials
Ninety-eight patients with locally advanced pharyngolaryngeal squamous cell cancer were enrolled. Each underwent pre-and post-chemoradiotherapy contrast-enhanced CT and FDG-PET/CT imaging. Imaging parameters were correlated with survival outcomes.
Results
Low post-radiation primary tumor FDG avidity correlated with improved survival on multivariate analysis; so too did complete primary tumor response by CT alone. Although both imaging modalities lacked sensitivity, each had high specificity and negative predictive value for disease-specific mortality risk assessment. Kaplan-Meier estimates confirmed that both CT and FDG-PET/CT stratify patients into distinct high- and low-probability survivorship groups on the basis of primary tumor response to radiotherapy. Subset analyses demonstrated that the prognostic value for each biomarker was primarily derived from patients at high risk for local treatment failure (HPV-negative disease, non-oropharyngeal primary disease, or tobacco use).
Conclusions
CT- and FDG-PET/CT-based biomarkers are useful clinical tools in head and neck cancer-specific mortality risk assessment following radiotherapy, particularly for high-risk HPV-unrelated disease. Focus should be placed on further refinement and corroboration of imaging-based biomarkers in future studies.
Keywords: Radiotherapy, head and neck cancer, PET, CT, survival
INTRODUCTION
Long-term survival rates of approximately 50 percent on recent phase III trials for squamous cell carcinomas of the head and neck (HNSCC) highlight the continued need to reduce mortality from this disease 1–3. Multiple retrospective series suggest that the metabolic response of HNSCC to chemoradiotherapy correlates directly with overall survival, raising the possibility that outcomes might be improved by using FDG-PET to triage non-responding patients to further therapy 4–6. However, these data are limited by the biases inherent in conducting retrospective studies. They have also largely ignored the important issues of comparing the utility of PET to more affordable imaging alternatives, such as CT imaging alone. As a result, the appropriate role of imaging in predicting survival outcomes for HNSCC patients remains undefined.
We previously reported the results of a prospective clinical trial comparing radiation response assessment with FDG-PET/CT and contrast-enhanced CT, demonstrating equivalent accuracies for the general population and superiority of FDG-PET/CT for a subset of patients at high risk for local treatment failure 7. We now present a formal survival outcome analysis from this trial to address the potential roles of FDG-PET/CT- and CT-based biomarkers in mortality risk assessment for head and neck cancer.
METHODS AND MATERIALS
Patients
Between 2005 and 2007, 107 consecutive locally advanced HNSCC patients dispositioned to receive definitive (chemo)-radiotherapy were screened for enrollment onto a prospective IRB-approved trial. Screened patients were eligible for enrollment if they were 18 years of age and had biopsy-proven American Joint Commission on Cancer (AJCC) version 6 stage II–IVb squamous cell carcinoma of the pharyngolaryngeal axis. Nine patients were ineligible for inclusion; two withdrew consent, five underwent surgical resection, and two had FDG-PET/CT scans performed outside the window of timing stipulated by protocol. This left an enrolled study cohort of 98 patients.
Radiotherapy and Systemic Treatment
Patients were treated with intensity modulated radiotherapy (IMRT) as previously described 8, 9. Doses ranged from 66 to 70 Gy in 30 to 35 fractions. IMRT was delivered via step-and-shoot multi-leaf collimation through a static gantry. Treatment planning was performed using a Pinnacle3 system (version 6.2b or later, Philips Medical Systems, Andover, MA). Most patients received concurrent systemic therapy (Table 1).
Table 1. Patient Characteristics.
Baseline data are shown for all study patients. Mean values are shown, with range or percentage of total in parenthesis.
| Characteristic | ||
|---|---|---|
| Age | 58 (36–79) | |
| Sex | Male | 83 (85) |
| Female | 15 (15) | |
| Race | White | 82 (84) |
| Black | 7 (7) | |
| Hispanic | 7 (7) | |
| Other | 2 (2) | |
| Tobacco Use | Non-User | 49 (50) |
| User | 49 (50) | |
| Overall Stage | I | 0 (0) |
| II | 3 (4) | |
| III | 22 (22) | |
| IV | 73 (74) | |
| T Stage | x | 4 (4) |
| 0 | 0 (0) | |
| 1 | 8 (8) | |
| 2 | 27 (28) | |
| 3 | 37 (38) | |
| 4 | 22 (22) | |
| N Stage | x | 2 (2) |
| 0 | 16 (16) | |
| 1 | 13 (13) | |
| 2a | 4 (4) | |
| 2b | 39 (40) | |
| 2c | 22 (22) | |
| 3 | 2 (2) | |
| Site | Oropharynx | 77 (79) |
| Larynx | 12 (12) | |
| Hypopharynx | 9 (9) | |
| Radiation | Dose | 70 (66–72) |
| Duration | 44 (30–57) | |
| Chemotherapy | Platinum | 65 (66) |
| None | 21 (21) | |
| Cetuximab | 11 (11) | |
| Taxane | 1 (1) | |
FDG-PET/CT Imaging
Each patient underwent two FDG-PET/CT scans: the first within 4 weeks prior to starting therapy, and the second as near as possible to the 8th week following the end of treatment. FDG-PET/CT images were acquired with an integrated PET/CT device (Discovery ST-8; GE Medical Systems, Milwaukee, Wisconsin), as previously described 7.
The intensity of metabolic activity within foci of increased FDG uptake in disease sites was analyzed on the FDG-PET images using a semiautomated vendor-provided tool (GE Advantage workstation). The maximum standard uptake value (SUVmax) within the volume of interest was calculated as previously described (7). A single observer (VR) calculated SUVmax for all regions of gross disease on each study performed on this protocol. For patients with multiple sites of lymphadenopathy, nodal SUVmax was calculated on each FDG-PET/CT scan for the node with the highest initial SUVmax. FDG-PET/CT scans were interpreted with knowledge of contrast enhanced CT scans.
CT Imaging
Two contrast-enhanced CT scans were scheduled for each patient: the first within 4 weeks prior to starting therapy, and the second as near as possible to the 8th week following completion of treatment. LightSpeed (General Electric) scanners were used for all studies. An average of 120 mL of constrast was injected intravenously, at 3 mL/second, 90 seconds prior to scanning. Scans were typically acquired using a 220 mA current, 140 kVp voltage, 1 second revolution time, and a pitch of 1:1. Images were reconstructed with 1.25mm thickness. All images were reviewed on a General Electric workstation and interpreted by a board-certified neuroradiologist (LG).
Post-Treatment Surveillance and Surgical Management
Patients returned for routine surveillance 8 weeks following treatment, then every 3–4 months for clinical examination and serial contrast-enhanced CT imaging; chest X-rays were performed annually. Consolidative neck dissections were performed at the discretion of the treating physicians.
Human Papillomavirus (HPV) Detection
When archived tissue was available, in-situ hybridization (ISH), and immunohistochemistry (IHC) were run on paraffin-embedded tumor samples to detect HPV. A high-risk ISH cocktail (INFORM HPV III Family 16 Probe [B], Ventana) was used according to the manufacturer’s instructions. p16 IHC (clone 16P07, Labvision) was also performed according to the manufacturer’s instructions. Samples were regarded as positive if p16-immunoreactive and HPV was detected by ISH.
Data Analysis
Disease-specific and overall survival, measured from the date of treatment completion, was estimated by the Kaplan-Meier method (SPSSv16). Student’s t-Tests were used to evaluate correlations between FDG-PET/CT parameters and survival, with correction for multiple comparisons (Microsoft Excel). Univariate regression analysis was used to evaluate covariates for correlation with survival; those showing significant correlation were then subjected to multivariate regression analysis (SPSSv16). A threshold level of 10 pack-years of use was chosen to distinguish tobacco users from non-users, as this level of exposure is correlated with increased risk of developing HNSCC 10. Receiver operating characteristic (ROC) curves were plotted from the post-radiation primary and nodal FDG-PET/CT data. To find SUVmax thresholds with maximal accuracy in predicting survival, the curves were fit to polynomial equations which were then solved for a slope of 1 (Microsoft Excel). Threshold values were then applied to the post-radiation FDG-PET/CT data to calculate the accuracy of predicting survival. Unless otherwise stated, significance was defined as a P value of 0.05, throughout.
RESULTS
Patient Characteristics
Demographic and clinical characteristics of study patients are detailed in Table 1. Most were Caucasian men with stage IV oropharyngeal cancers treated over 6 weeks to 70 Gy with concurrent weekly cisplatin. The median follow-up for all patients at the time of this analysis was 2 years (range 1.2–2.5). Estimated two-year overall and disease-specific survival rates were nearly identical at 85.7% and 86.7%, respectively (Figure 1).
Figure 1. Survival Characteristics.
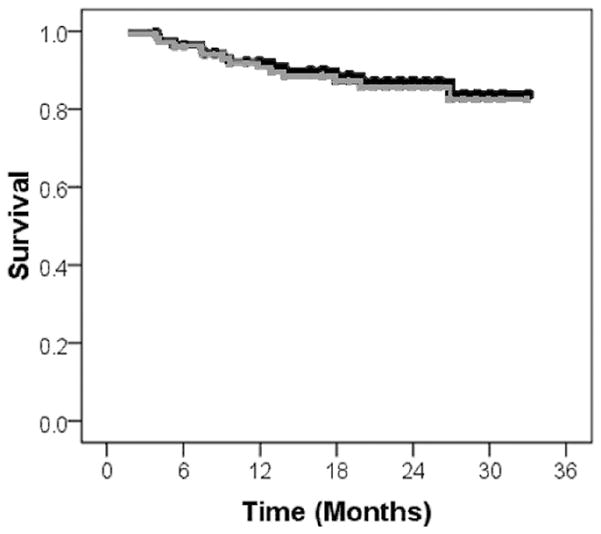
Kaplan-Meier plots for overall (grey) and disease-specific (black) survival are shown for the entire patient cohort. Ticks mark censored events.
Correlating SUVmax with Survival
Since overall and disease-specific survival correlated well in this cohort, we focused the remainder of our analysis on disease-specific survival (DSS) for simplicity. We first examined whether pre- or post-radiation tumor FDG-avidity correlated with DSS (Table 2). The only parameters correlating significantly with DSS were primary tumor post-radiation SUVmax and the percent change in primary tumor SUVmax between the pre- and post-radiation scans. Nodal tumor SUVmax parameters showed no correlation with DSS, nor did baseline SUVmax for either primary or nodal tumors.
Table 2. SUVmax and Disease-Specific Survival.
Shown are mean SUVmax values as well as relative and absolute change in SUVmax from pre- to post-radiation imaging. Parameters significantly different between survivors and non-survivors are bolded.
| Parameter | Survivors | Non-Survivors | P Value | |
|---|---|---|---|---|
| Primary | Pre-RT | 19.6 | 18.0 | 0.51 |
| Post-RT | 4.2 | 7.2 | < 0.01 | |
| % Chng | 74 | 58 | 0.01 | |
| Abs Chng | 15.3 | 10.8 | 0.07 | |
| Nodal | Pre-RT | 12.7 | 14.6 | 0.38 |
| Post-RT | 2.4 | 3.1 | 0.06 | |
| % Chng | 72 | 74 | 0.81 | |
| Abs Chng | 10.2 | 11.4 | 0.58 | |
Regression analyses were then performed to better understand how metabolic response to therapy of the tumor correlates with DSS in the context of other important covariates, including anatomic radiographic response (Table 3). Analyzed as a continuous variable, low post-radiation primary tumor SUVmax predicted for improved DSS on univariate analysis, as did complete radiographic response by CT at the primary site, Caucasian race, and negative tobacco use. On multivariate analysis, metabolic and anatomic primary tumor response both retained significance in predicting improved DSS, as did negative tobacco use.
Table 3. Covariate Analysis.
Shown are P values for correlations between disease-specific survival and covariates by univariate (UVA) and multivariate (MVA) analyses. P values for significant covariates are bolded.
| UVA | MVA | |
|---|---|---|
| Age | 0.84 | -- |
| Gender | 0.99 | -- |
| Race | 0.02 | 0.14 |
| Tobacco Use | 0.01 | 0.02 |
| RT Dose | 0.85 | -- |
| Primary Site | 0.33 | -- |
| T stage | 0.07 | -- |
| N stage | 0.23 | -- |
| Primary post-RT SUVmax | < 0.01 | < 0.01 |
| Nodal post-RT SUVmax | 0.06 | -- |
| Primary rCR | < 0.01 | < 0.01 |
| Nodal rCR | 0.78 | -- |
Accuracy of Post-Treatment SUVmax in Predicting Survival
Since absolute post-radiation SUVmax showed the best correlation with survival of all FDG-PET metrics analyzed, we focused the remainder of our analyses on this parameter. ROC curves were generated from the post-radiation data in order to compare the accuracies of CT and FDG-PET/CT in predicting DSS. Applied to the entire cohort, both of these imaging biomarkers were inaccurate, with ROC curves approaching unity (Figure 2A). We then censored those patients developing distant metastases (DM) as a first site of failure within 6 months of completing therapy (n = 6), reasoning that locoregional tumor control was unlikely to influence DSS in these patients. Applied to the remainder (n = 92), both imaging biomarkers showed modestly improved accuracy (Figure 2B).
Figure 2. Accuracy of Imaging Response as a Predictor of Disease-Specific Survival.

ROC curves are shown for the accuracy of FDG-PET/CT imaging (lines) and CT imaging (symbols) in predicting disease-specific survival in (A) the entire cohort (n = 98) and in (B) the subset censored for DM as first site of failure (n = 92). The line of unity is displayed for comparison.
The ROC curves generated from the entire data set (n = 98) were then used to define threshold post-radiation tumor SUVmax values with optimal accuracy for predicting DSS. These values were calculated to be 6.0 and 3.4 for primary and nodal tumors, respectively. Using these threshold values, the sensitivity, specificity, positive predictive value, and negative predictive value were determined for post-radiation SUVmax as a biomarker of DSS. For comparison, these parameters were also determined for the CT data set. Overall, both sets of biomarkers demonstrated similar accuracies in predicting DSS (Table 4). Sensitivity and positive predictive values were low for each; specificity and negative predictive values were comparatively high.
Table 4. Disease-Specific Survival Imaging Biomarker Accuracy.
Comparatively similar accuracies are seen with both CT and FDG-PET/CT-based biomarkers.
| Primary | Node | |||
|---|---|---|---|---|
| FDG-PET/CT | CT | FDG-PET/CT | CT | |
| Sensitivity | 50 | 50 | 25 | 33 |
| Specificity | 85 | 88 | 50 | 62 |
| Positive Predictive Value | 50 | 38 | 6 | 13 |
| Negative Predictive Value | 92 | 93 | 85 | 84 |
Imaging Biomarkers for Mortality Risk Assessment
SUVmax thresholds and radiographic CR were then applied as imaging biomarkers for discriminating DSS in the entire cohort. Kaplan Meier curves were generated for good- and poor-prognosis groups (determined by each imaging biomarker), and compared by log rank analysis (Figure 3). Primary tumor imaging response – metabolic and anatomic – stratified patients into groups differing significantly in the likelihood of DSS (P < 0.005 for each). Neither imaging biomarker discriminated the cohort into useful survivorship groups on the basis of nodal disease (P = NS for each). Repeating these analyses for the group censored for early distant failures produced qualitatively and quantitatively similar results (data not shown).
Figure 3. Imaging Biomarkers of Disease-Specific Survival.

Kaplan-Meier curves for the entire cohort subdivided by post-radiation SUVmax threshold values for primary tumors (A) and nodes (C), and by radiographic CT response for primary tumors (B) and nodes (D). FDG-PET/CT and CT both discriminate survivorship groups by primary tumor biomarker (log rank, P < 0.005), but not by nodal tumor biomarker (log rank, P = NS).
Finally, we applied our previously-reported locoregional failure risk stratification schema to determine whether this risk grouping influenced DSS. High-risk patients (n = 32) were those with human papilloma virus (HPV)-negative disease, tobacco use (any type), or non-oropharyngeal primary tumors; low-risk patients (n = 66) were those with HPV-positive disease or those with oropharyngeal primary tumors and no tobacco use 7. Indeed, these risk groups differed significantly in DSS (Figure 4A). Sub-stratifying low-risk patients by imaging biomarkers provided no additional prognostic information (not shown). For high-risk patients, however, sub-stratification by either CT or FDG-PET/CT-based biomarkers provided significant additional prognostic information (Figure 4B–C). Based on this finding, we propose a straightforward clinicoradiographic DSS risk stratification algorithm for future corroborative clinical testing (Figure 5).
Figure 4. Locoregional Failure Risk Grouping and Survival.

Kaplan-Meier curves are shown for the entire cohort (A) stratified by locoregional radiotherapy failure risk grouping (high-risk [n = 32]: human papilloma virus (HPV)-negative disease, tobacco use, or non-oropharyngeal primary disease; low-risk [n = 66]: HPV-positive disease or those with oropharyngeal primary tumors and no tobacco use). The high-risk group was then sub-stratified by primary tumor imaging biomarker risk status – FDG-PET/CT-based (B) or CT-based (C). P values are derived from log-rank analyses.
Figure 5. Proposed Clinicoradiographic Risk-Stratification Algorithm.
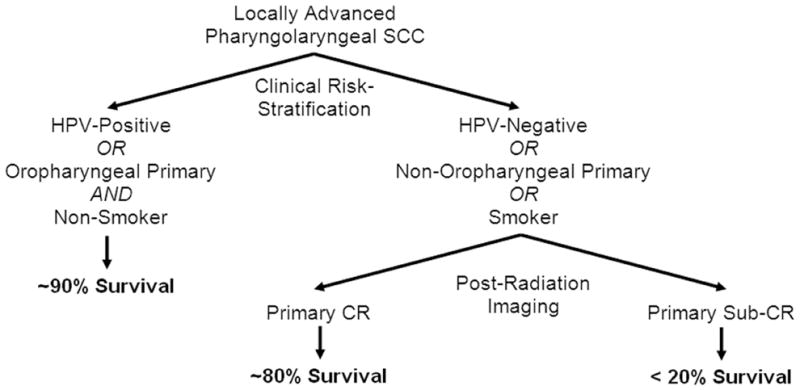
Clinical low-risk status (HPV-positive disease or those with oropharyngeal primary tumors and no tobacco use) predicts for excellent survival regardless of imaging findings. Post-radiotherapy imaging of primary disease treatment response improves stratification of mortality risk in patients with a high-risk clinical profile (HPV-negative disease, tobacco use, or non-oropharyngeal primary disease).
DISCUSSION
There are currently few clinical tools available to assess mortality risk for advanced HNSCC. Recursive partitioning analysis has been used to create reliable survivorship groupings on the basis of readily accessible clinical criteria (stage, age, performance status, and primary tumor site), but considerable overlap in outcome between groups suggests there is room for further refinement of prognostic capacity 11–13. Lifetime non-smokers may enjoy improved survival outcomes following head and neck cancer treatment relative to prior smokers 14, 15, but these results await further validation. Since prognostic factors such as these are currently used by cooperative groups to risk-stratify patients enrolled onto randomized trials, their accuracy is critical to the ultimate utility of these phase III studies.
Several histologic biomarkers have prognostic value beyond the standard clinical risk factors for HNSCC 16–19, but few of these have been prospectively evaluated and none has yet been widely adopted in routine clinical practice. Owing to the excellent prognosis for HPV-associated HNSCC 20, 21, HPV-specific biomarkers appear to provide significant prognostic value by allowing accurate dichotomization of cohorts by viral status 15, 22, 23. However, these markers are not useful to sub-stratify risk for patients with HPV-unrelated disease; for these patients, further efforts will be necessary to improve biomarker-based mortality risk assessment.
Imaging-based biomarkers offer the potential for providing complementary or alternative value for prognostic risk assessment. Validated imaging biomarkers would have the theoretical advantage of being non-invasive, amenable to serial collection, unsusceptible to tissue sampling issues, and widely available to clinicians. 18F-FDG-PET/CT has been the most studied imaging modality to date for this purpose in HNSCC. Previous retrospective series suggest that highly elevated baseline HNSCC primary tumor FDG SUV predicts for worse prognosis 24–28. Our prospective results call this conclusion into question. A separate group of retrospective studies suggest that high post-radiation primary tumor FDG avidity is predictive of poor overall survival 4–6. Our prospective data confirm this finding for primary tumors, but supports no such correlation for nodal disease. The lack of correlation with nodal response to radiotherapy suggests that consolidative neck dissection adequately salvage residual regional disease without a sacrifice in ultimate survival probability. The same does not appear to be true of surgical salvage of primary tumor failures, emphasizing the need for adequate up-front local therapy of primary disease.
A novel aspect of our study was the evaluation of imaging biomarker mortality risk assessment in the context of competing clinical risk factors. It is interesting to note that even after stratifying patients by risk group on the basis of tumor HPV status, primary site, and tobacco use – factors which achieved stratification with an absolute difference in DSS of over 25% – post-radiation primary tumor imaging response still added significant prognostic value for high-risk patients (Figure 4). The ultimate difference in survival probability for low-risk patients compared to high-risk patients with unfavorable post-radiation imaging was striking (absolute difference ~60%), warranting further study for inclusion in routine clinical risk assessment (Figure 5).
We were also able to prospectively compare the prognostic value of FDG-PET/CT and CT alone. Their equivalent performance and disparate cost provides a compelling financial argument against the use of FDG-PET/CT for this indication. The value of CT alone for head and neck cancer management has been well demonstrated and argued for previously 29, 30. Regardless, our previously-reported data support the use of FDG-PET/CT in patients at high risk for locoregional failure (HPV-negative disease, tobacco use, non-oropharyngeal primary tumors) for the purpose of radiotherapy response assessment 7. Since FDG-PET/CT was equivalent to CT alone for mortality risk assessment, a more compelling argument for serial FDG-PET/CT imaging of high-risk patients could be made on the basis of improved locoregional control assessment.
Whether technical improvements advances will tangibly improve imaging biomarker risk assessment of HNSCC radiotherapy outcomes remains unsettled. Both of the imaging modalities we studied predicted disease-specific mortality with limited sensitivity. This finding reflects the fact that approximately half of all cancer-related deaths on this study occurred in patients who died of distant metastases despite locoregional disease control. Currently, there are no data available to estimate the specific risk of distant metastatic failure based on locoregional imaging findings for HNSCC. Imaging biomarkers do an adequate job of predicting mortality in patients without distant metastases – i.e. those who die from locoregional disease progression – but this, of course, does not address the total patient population.
It is important to note that although our imaging and treatment outcomes data were collected prospectively, this series remains limited in size and enjoys its most direct relevance to high-volume referral centers. It is possible that the relative benefit of FDG-PET/CT and CT survival outcome assessment varies according to the level of neuroradiology and radiotherapy expertise found across different facilities. The recently closed Radiation Therapy Oncology Group (RTOG) 0522 phase III trial included a formal study of FDG-PET/CT which closely mirrored our series design, and holds promise as a corroborative experience in the multi-institutional setting.
In summary, our findings support the selective use of imaging biomarkers in mortality risk assessment for HNSCC, although these conclusions will require independent corroboration. The ability to discriminate high-risk patients into groups differing in disease-specific survival by three-fold, if confirmed, could have a major impact on risk-stratification for this diagnosis.
Acknowledgments
Supported by the University of Texas M.D. Anderson Cancer Center Specialized Programs of Research Excellence (SPORE) in Head and Neck Grant CA97007.
Footnotes
CONFLICTS OF INTEREST NOTIFICATION
None exist.
References
- 1.Denis F, Garaud P, Bardet E, et al. Final results of the 94-01 French Head and Neck Oncology and Radiotherapy Group randomized trial comparing radiotherapy alone with concomitant radiochemotherapy in advanced-stage oropharynx carcinoma. J Clin Oncol. 2004;22:69–76. doi: 10.1200/JCO.2004.08.021. [DOI] [PubMed] [Google Scholar]
- 2.Bonner JA, Harari PM, Giralt J, et al. Radiotherapy plus cetuximab for squamous-cell carcinoma of the head and neck. N Engl J Med. 2006;354:567–578. doi: 10.1056/NEJMoa053422. [DOI] [PubMed] [Google Scholar]
- 3.Jeremic B, Shibamoto Y, Milicic B, et al. Hyperfractionated radiation therapy with or without concurrent low-dose daily cisplatin in locally advanced squamous cell carcinoma of the head and neck: a prospective randomized trial. J Clin Oncol. 2000;18:1458–1464. doi: 10.1200/JCO.2000.18.7.1458. [DOI] [PubMed] [Google Scholar]
- 4.Yao M, Smith RB, Hoffman HT, et al. Clinical significance of postradiotherapy [18F]-fluorodeoxyglucose positron emission tomography imaging in management of head-and-neck cancer-a long-term outcome report. Int J Radiat Oncol Biol Phys. 2009;74:9–14. doi: 10.1016/j.ijrobp.2008.07.019. [DOI] [PubMed] [Google Scholar]
- 5.Connell CA, Corry J, Milner AD, et al. Clinical impact of, and prognostic stratification by, F-18 FDG PET/CT in head and neck mucosal squamous cell carcinoma. Head Neck. 2007;29:986–995. doi: 10.1002/hed.20629. [DOI] [PubMed] [Google Scholar]
- 6.Kunkel M, Forster GJ, Reichert TE, et al. Radiation response non-invasively imaged by [18F]FDG-PET predicts local tumor control and survival in advanced oral squamous cell carcinoma. Oral Oncol. 2003;39:170–177. doi: 10.1016/s1368-8375(02)00087-8. [DOI] [PubMed] [Google Scholar]
- 7.Moeller BJ, Rana V, Cannon BA, et al. Risk-Adjusted FDG-PET/CT Assessment of Radiation Response in Head and Neck Cancer – A Prospective Evaluation. Under Review. [Google Scholar]
- 8.Dabaja B, Salehpour MR, Rosen I, et al. Intensity-modulated radiation therapy (IMRT) of cancers of the head and neck: comparison of split-field and whole-field techniques. Int J Radiat Oncol Biol Phys. 2005;63:1000–1005. doi: 10.1016/j.ijrobp.2005.03.069. [DOI] [PubMed] [Google Scholar]
- 9.Garden AS, Morrison WH, Wong PF, et al. Disease-control rates following intensity-modulated radiation therapy for small primary oropharyngeal carcinoma. Int J Radiat Oncol Biol Phys. 2007;67:438–444. doi: 10.1016/j.ijrobp.2006.08.078. [DOI] [PMC free article] [PubMed] [Google Scholar]
- 10.Hashibe M, Brennan P, Benhamou S, et al. Alcohol drinking in never users of tobacco, cigarette smoking in never drinkers, and the risk of head and neck cancer: pooled analysis in the International Head and Neck Cancer Epidemiology Consortium. J Natl Cancer Inst. 2007;99:777–789. doi: 10.1093/jnci/djk179. [DOI] [PubMed] [Google Scholar]
- 11.Leon X, Gich I, Orus C, et al. Comparison of the Radiation Therapy Oncology Group recursive partitioning classification and Union Internationale Contre le Cancer TNM classification for patients with head and neck carcinoma. Head Neck. 2005;27:248–257. doi: 10.1002/hed.20148. [DOI] [PubMed] [Google Scholar]
- 12.Cooper JS, Farnan NC, Asbell SO, et al. Recursive partitioning analysis of 2105 patients treated in Radiation Therapy Oncology Group studies of head and neck cancer. Cancer. 1996;77:1905–1911. doi: 10.1002/(SICI)1097-0142(19960501)77:9<1905::AID-CNCR22>3.0.CO;2-2. [DOI] [PubMed] [Google Scholar]
- 13.Cooper JS, Berkey B, Marcial V, et al. Validation of the RTOG recursive partitioning classification for head and neck tumors. Head Neck. 2001;23:669–677. doi: 10.1002/hed.1094. [DOI] [PubMed] [Google Scholar]
- 14.Pytynia KB, Grant JR, Etzel CJ, et al. Matched-pair analysis of survival of never smokers and ever smokers with squamous cell carcinoma of the head and neck. J Clin Oncol. 2004;22:3981–3988. doi: 10.1200/JCO.2004.02.133. [DOI] [PubMed] [Google Scholar]
- 15.Kumar B, Cordell KG, Lee JS, et al. EGFR, p16, HPV Titer, Bcl-xL and p53, Sex, and Smoking As Indicators of Response to Therapy and Survival in Oropharyngeal Cancer. J Clin Oncol. 2008 doi: 10.1200/JCO.2007.12.7662. [DOI] [PMC free article] [PubMed] [Google Scholar]
- 16.Sackett MK, Bairati I, Meyer F, et al. Prognostic significance of cyclooxygenase-2 overexpression in glottic cancer. Clin Cancer Res. 2008;14:67–73. doi: 10.1158/1078-0432.CCR-07-2028. [DOI] [PubMed] [Google Scholar]
- 17.Rubin Grandis J, Melhem MF, Gooding WE, et al. Levels of TGF-alpha and EGFR protein in head and neck squamous cell carcinoma and patient survival. J Natl Cancer Inst. 1998;90:824–832. doi: 10.1093/jnci/90.11.824. [DOI] [PubMed] [Google Scholar]
- 18.McHam SA, Adelstein DJ, Rybicki LA, et al. Who merits a neck dissection after definitive chemoradiotherapy for N2-N3 squamous cell head and neck cancer? Head Neck. 2003;25:791–798. doi: 10.1002/hed.10293. [DOI] [PubMed] [Google Scholar]
- 19.Bache M, Reddemann R, Said HM, et al. Immunohistochemical detection of osteopontin in advanced head-and-neck cancer: prognostic role and correlation with oxygen electrode measurements, hypoxia-inducible-factor-1alpha-related markers, and hemoglobin levels. Int J Radiat Oncol Biol Phys. 2006;66:1481–1487. doi: 10.1016/j.ijrobp.2006.07.1376. [DOI] [PubMed] [Google Scholar]
- 20.Fakhry C, Westra WH, Li S, et al. Improved survival of patients with human papillomavirus-positive head and neck squamous cell carcinoma in a prospective clinical trial. J Natl Cancer Inst. 2008;100:261–269. doi: 10.1093/jnci/djn011. [DOI] [PubMed] [Google Scholar]
- 21.Weinberger PM, Yu Z, Haffty BG, et al. Molecular classification identifies a subset of human papillomavirus--associated oropharyngeal cancers with favorable prognosis. J Clin Oncol. 2006;24:736–747. doi: 10.1200/JCO.2004.00.3335. [DOI] [PubMed] [Google Scholar]
- 22.Lassen P, Eriksen JG, Hamilton-Dutoit S, et al. Effect of HPV-associated p16INK4A expression on response to radiotherapy and survival in squamous cell carcinoma of the head and neck. J Clin Oncol. 2009;27:1992–1998. doi: 10.1200/JCO.2008.20.2853. [DOI] [PubMed] [Google Scholar]
- 23.Kong CS, Narasimhan B, Cao H, et al. The relationship between human papillomavirus status and other molecular prognostic markers in head and neck squamous cell carcinomas. Int J Radiat Oncol Biol Phys. 2009;74:553–561. doi: 10.1016/j.ijrobp.2009.02.015. [DOI] [PMC free article] [PubMed] [Google Scholar]
- 24.Minn H, Lapela M, Klemi PJ, et al. Prediction of survival with fluorine-18-fluoro-deoxyglucose and PET in head and neck cancer. J Nucl Med. 1997;38:1907–1911. [PubMed] [Google Scholar]
- 25.Narod SA, Brunet JS, Ghadirian P, et al. Tamoxifen and risk of contralateral breast cancer in BRCA1 and BRCA2 mutation carriers: a case-control study. Hereditary Breast Cancer Clinical Study Group. Lancet. 2000;356:1876–1881. doi: 10.1016/s0140-6736(00)03258-x. [DOI] [PubMed] [Google Scholar]
- 26.Halfpenny W, Hain SF, Biassoni L, et al. FDG-PET. A possible prognostic factor in head and neck cancer. Br J Cancer. 2002;86:512–516. doi: 10.1038/sj.bjc.6600114. [DOI] [PMC free article] [PubMed] [Google Scholar]
- 27.Allal AS, Dulguerov P, Allaoua M, et al. Standardized uptake value of 2-[(18)F] fluoro-2-deoxy-D-glucose in predicting outcome in head and neck carcinomas treated by radiotherapy with or without chemotherapy. J Clin Oncol. 2002;20:1398–1404. doi: 10.1200/JCO.2002.20.5.1398. [DOI] [PubMed] [Google Scholar]
- 28.Schwartz DL, Rajendran J, Yueh B, et al. FDG-PET prediction of head and neck squamous cell cancer outcomes. Arch Otolaryngol Head Neck Surg. 2004;130:1361–1367. doi: 10.1001/archotol.130.12.1361. [DOI] [PubMed] [Google Scholar]
- 29.Gregoire V. Is there any future in radiotherapy planning without the use of PET: unraveling the myth. Radiother Oncol. 2004;73:261–263. doi: 10.1016/j.radonc.2004.10.005. [DOI] [PubMed] [Google Scholar]
- 30.Liauw SL, Mancuso AA, Amdur RJ, et al. Postradiotherapy neck dissection for lymph node-positive head and neck cancer: the use of computed tomography to manage the neck. J Clin Oncol. 2006;24:1421–1427. doi: 10.1200/JCO.2005.04.6052. [DOI] [PubMed] [Google Scholar]