

Abstract
Calcium signals are involved in a large variety of physiological processes. Their
versatility relies on the diversity of spatio-temporal behaviors that the
calcium concentration can display. Calcium entry through inositol
1,4,5-trisphosphate (IP ) receptors (IP
 R's) is a key component that participates in both
local signals such as “puffs” and in global waves. IP
R's) is a key component that participates in both
local signals such as “puffs” and in global waves. IP R's are usually organized in clusters on the membrane
of the endoplasmic reticulum and their spatial distribution has important
effects on the resulting signal. Recent high resolution observations [1] of Ca
R's are usually organized in clusters on the membrane
of the endoplasmic reticulum and their spatial distribution has important
effects on the resulting signal. Recent high resolution observations [1] of Ca puffs offer a window to study intra-cluster organization. The
experiments give the distribution of the number of IP
puffs offer a window to study intra-cluster organization. The
experiments give the distribution of the number of IP R's that open during each puff without much
processing. Here we present a simple model with which we interpret the
experimental distribution in terms of two stochastic processes: IP
R's that open during each puff without much
processing. Here we present a simple model with which we interpret the
experimental distribution in terms of two stochastic processes: IP binding and unbinding and Ca
 -mediated inter-channel coupling. Depending on the parameters
of the system, the distribution may be dominated by one or the other process.
The transition between both extreme cases is similar to a percolation process.
We show how, from an analysis of the experimental distribution, information can
be obtained on the relative weight of the two processes. The largest distance
over which Ca
-mediated inter-channel coupling. Depending on the parameters
of the system, the distribution may be dominated by one or the other process.
The transition between both extreme cases is similar to a percolation process.
We show how, from an analysis of the experimental distribution, information can
be obtained on the relative weight of the two processes. The largest distance
over which Ca -mediated coupling acts and the density of IP
 -bound IP
 R's of the cluster can also be estimated. The approach
allows us to infer properties of the interactions among the channels of the
cluster from statistical information on their emergent collective behavior.
R's of the cluster can also be estimated. The approach
allows us to infer properties of the interactions among the channels of the
cluster from statistical information on their emergent collective behavior.
Introduction
The calcium (Ca ) ion is a universal second messenger that is involved in a large
number of physiological processes [2]. To this end, cells regulate cytosolic Ca
) ion is a universal second messenger that is involved in a large
number of physiological processes [2]. To this end, cells regulate cytosolic Ca concentration ([Ca
 ]) very precisely. At basal conditions free cytosolic [Ca
 ] is very low (
 ). [Ca
 ] is several orders of magnitude higher in the
extracellular medium and in internal reservoirs, such as the endoplasmic reticulum.
Different signals can induce the opening of specific Ca
] is several orders of magnitude higher in the
extracellular medium and in internal reservoirs, such as the endoplasmic reticulum.
Different signals can induce the opening of specific Ca channels located on the plasma membrane or on the membrane of the
internal reservoirs leading to local increments of the cytosolic [Ca
channels located on the plasma membrane or on the membrane of the
internal reservoirs leading to local increments of the cytosolic [Ca ] of various durations. This [Ca
 ] change evokes different end responses depending upon the
spatio-temporal distribution of [Ca
] change evokes different end responses depending upon the
spatio-temporal distribution of [Ca ]. Thus, it is of interest to measure the latter and how
different factors shape it.
]. Thus, it is of interest to measure the latter and how
different factors shape it.
One of the Ca channels involved in intracellular Ca
 signals is the inositol 1,4,5-trisphosphate (IP
 ) receptor (IP
 R) which is expressed in many cell types and is located at the
surface of intracellular membranes such as the endoplasmic reticulum (ER), the
sarcoplasmic reticulum (SR) and the nucleus. The IP
R) which is expressed in many cell types and is located at the
surface of intracellular membranes such as the endoplasmic reticulum (ER), the
sarcoplasmic reticulum (SR) and the nucleus. The IP R is biphasically regulated by Ca
 , with a bell-shaped open probability as a function of [Ca
 ]. Kinetic models of the IP
 R take this dual effect into account by assuming that the receptor
has at least one activating and one inhibitory site such that Ca
R take this dual effect into account by assuming that the receptor
has at least one activating and one inhibitory site such that Ca binding to the first one induces channel opening (provided that IP
 is also bound to the receptor) and Ca
 binding to the second one induces channel closing [3]–[5]. Given that the affinity
for Ca
binding to the second one induces channel closing [3]–[5]. Given that the affinity
for Ca of the activating site is larger than that of the inhibitory site,
a local increase of cytosolic Ca
of the activating site is larger than that of the inhibitory site,
a local increase of cytosolic Ca in the vicinity of an IP
 R with IP
 bound induces channel opening first. This leads to a phenomenon
called Ca
bound induces channel opening first. This leads to a phenomenon
called Ca -induced Ca
 -release (CICR) because the Ca
 ions released by one channel can in turn trigger the opening of
other nearby channels with IP
ions released by one channel can in turn trigger the opening of
other nearby channels with IP bound. Ca
 channels are not uniformly distributed in the cell. IP
 R's, in particular, are usually organized in clusters on
the membrane of the ER that are separated by a few microns [6]. These clusters have been
estimated to be
R's, in particular, are usually organized in clusters on
the membrane of the ER that are separated by a few microns [6]. These clusters have been
estimated to be  in size in oocytes [7], [8]. The simulations of [7] showed that previous
observations could be reproduced assuming that between 25 and 35 IP
in size in oocytes [7], [8]. The simulations of [7] showed that previous
observations could be reproduced assuming that between 25 and 35 IP R's opened simultaneously during puffs. A similar estimate
was obtained in [8] using a mean-field model that assumed that all
channels opened and closed simultaneously. Simulations that include a stochastic
description of the individual channel openings and closings, however, show that at
most half of the channels with IP
R's opened simultaneously during puffs. A similar estimate
was obtained in [8] using a mean-field model that assumed that all
channels opened and closed simultaneously. Simulations that include a stochastic
description of the individual channel openings and closings, however, show that at
most half of the channels with IP bound are simultaneously open during a puff [8]. This implies that even
in clusters with 50 IP
bound are simultaneously open during a puff [8]. This implies that even
in clusters with 50 IP R's with IP
 bound, the maximum number of simultaneously open channels is
around 20. These results are consistent with observations of Ca
bound, the maximum number of simultaneously open channels is
around 20. These results are consistent with observations of Ca signals in the human neuroblastoma SY5Y cell line in which puffs
of up to 20 simultaneously open channels were observed [1]. Measurements performed
using patches of the outer nuclear envelope of the DT40 cell line give smaller
numbers of IP
signals in the human neuroblastoma SY5Y cell line in which puffs
of up to 20 simultaneously open channels were observed [1]. Measurements performed
using patches of the outer nuclear envelope of the DT40 cell line give smaller
numbers of IP R's in each patch [9]. The non-uniform
spatial organization of the IP
R's in each patch [9]. The non-uniform
spatial organization of the IP R's together with the channel coupling induced by CICR
gives rise to a large variety of intracellular Ca
R's together with the channel coupling induced by CICR
gives rise to a large variety of intracellular Ca signals that go from very localized ones to waves that propagate
throughout the cell [10].
signals that go from very localized ones to waves that propagate
throughout the cell [10].
The hierarchy of intracellular Ca signals that includes Ca
 “blips” (Ca
 release through a single IP
 R), “puffs” (Ca
 release through several IP
 R's in a cluster) and waves that propagate globally across
cells by successive cycles of CICR has been observed using fluorescence microscopy
and Ca
R's in a cluster) and waves that propagate globally across
cells by successive cycles of CICR has been observed using fluorescence microscopy
and Ca sensitive dyes [10]–[13]. The
Xenopus laevis oocyte has been frequently used for this purpose
because of its relatively large size and because the only Ca
sensitive dyes [10]–[13]. The
Xenopus laevis oocyte has been frequently used for this purpose
because of its relatively large size and because the only Ca channels that are present on the surface of the ER are IP
 R's. Fluorescent images of these signals obtained with
confocal microscopy do not resolve the inner-cluster structure. Therefore, different
modeling strategies have been presented in order to determine the properties of the
dynamics and spatial organization of IP
R's. Fluorescent images of these signals obtained with
confocal microscopy do not resolve the inner-cluster structure. Therefore, different
modeling strategies have been presented in order to determine the properties of the
dynamics and spatial organization of IP R's within clusters that are compatible with these
experimental observations [7], [8], [14], [15]. In
particular, in [8], [16] we made the very simple assumption that the
number of IP
R's within clusters that are compatible with these
experimental observations [7], [8], [14], [15]. In
particular, in [8], [16] we made the very simple assumption that the
number of IP R's that open during the first puff that occurs at a site
is given by the number of IP
R's that open during the first puff that occurs at a site
is given by the number of IP R's with IP
 bound. The underlying assumption was that the Ca
 released by the first open channel would induce the opening of all
the other IP
released by the first open channel would induce the opening of all
the other IP R's of the cluster with IP
 bound. Therefore, if all the clusters had approximately the same
number of IP
bound. Therefore, if all the clusters had approximately the same
number of IP R's and all IP
 R's were equally sensitive to IP
 , the distribution of the number of channels that opened during a
puff could be approximated by a binomial or Poisson distribution [8], provided
that the probability that the channels become open were the same immediately before
the occurrence of each puff. This last condition would not be satisfied in a
non-stationary situation, e.g. if the concentrations of the
agonists right before the release event differed significantly from puff to puff. It
would not hold, in particular, for data containing sequences of puffs that are
coupled through CICR or to puffs in which the inhibitory effect of the Ca
, the distribution of the number of channels that opened during a
puff could be approximated by a binomial or Poisson distribution [8], provided
that the probability that the channels become open were the same immediately before
the occurrence of each puff. This last condition would not be satisfied in a
non-stationary situation, e.g. if the concentrations of the
agonists right before the release event differed significantly from puff to puff. It
would not hold, in particular, for data containing sequences of puffs that are
coupled through CICR or to puffs in which the inhibitory effect of the Ca released in a previous event was noticeable, as described in [16]. In
oocytes, the latter is only relevant for very long records containing many puffs at
a site, which is usually not the case in most experiments. Calcium induced calcium
release is also affected by buffers that can trap Ca
released in a previous event was noticeable, as described in [16]. In
oocytes, the latter is only relevant for very long records containing many puffs at
a site, which is usually not the case in most experiments. Calcium induced calcium
release is also affected by buffers that can trap Ca ions as they diffuse. This not only reduces the [Ca
 ] but also alters the rate of Ca
 transport [17]. The distances that separate IP
 R's within a cluster are very small (10–20nm)
[9].
Thus, only large concentrations of very fast buffers could affect Ca
R's within a cluster are very small (10–20nm)
[9].
Thus, only large concentrations of very fast buffers could affect Ca -mediated inter-channel coupling in cases with many active channels
[18],
[19].
The assumption that all the channels with IP
-mediated inter-channel coupling in cases with many active channels
[18],
[19].
The assumption that all the channels with IP bound participate of the first puff of their site is the simplest
way of approaching the complex problem of Ca
bound participate of the first puff of their site is the simplest
way of approaching the complex problem of Ca -mediated inter-channel communication. Yet, it is applicable as
long as the distance between IP
-mediated inter-channel communication. Yet, it is applicable as
long as the distance between IP -bound channels is not too large. In the present paper we drop this
assumption and analyze how Ca
-bound channels is not too large. In the present paper we drop this
assumption and analyze how Ca -mediated inter-channel coupling affects the distribution of puff
sizes. Our approach provides a simple tool to study some of the effects of buffers
on the intra-cluster dynamics.
-mediated inter-channel coupling affects the distribution of puff
sizes. Our approach provides a simple tool to study some of the effects of buffers
on the intra-cluster dynamics.
The quantal properties of Ca release during puffs have recently been revealed in [1] using
total internal reflection fluorescence (TIRF) microscopy in intact mammalian cells
of the human neuroblastoma SY5Y cell line. The proximity of IP
release during puffs have recently been revealed in [1] using
total internal reflection fluorescence (TIRF) microscopy in intact mammalian cells
of the human neuroblastoma SY5Y cell line. The proximity of IP R's to the plasma membrane in this cell type allowed the
use of TIRF microscopy in which fluorescence can be elicited in a very small
(attoliter) volume. This, together with the use of a fast CCD camera, permitted a
much better temporal resolution than the one achieved with confocal microscopy. In
this way, abrupt step-wise transitions between fluorescence levels were observed
during the falling phase of puffs. Furthermore, many puffs could be elicited at each
release site due to the use of a membrane-permeable form of IP
R's to the plasma membrane in this cell type allowed the
use of TIRF microscopy in which fluorescence can be elicited in a very small
(attoliter) volume. This, together with the use of a fast CCD camera, permitted a
much better temporal resolution than the one achieved with confocal microscopy. In
this way, abrupt step-wise transitions between fluorescence levels were observed
during the falling phase of puffs. Furthermore, many puffs could be elicited at each
release site due to the use of a membrane-permeable form of IP [20]. The
authors then inferred that the step-wise transitions between fluorescence levels
occurred in multiples of a basic unit that they identified with the amplitude
contribution of each channel at the site [1]. Using this relationship
they could readily obtain the distribution of the number of channels that open
during a puff. Given that there is a large variability among cluster sites, they
analyzed the subset of events that occur in clusters with a similar number of IP
[20]. The
authors then inferred that the step-wise transitions between fluorescence levels
occurred in multiples of a basic unit that they identified with the amplitude
contribution of each channel at the site [1]. Using this relationship
they could readily obtain the distribution of the number of channels that open
during a puff. Given that there is a large variability among cluster sites, they
analyzed the subset of events that occur in clusters with a similar number of IP R's. The authors did not find any sign of an inhibiting
effect of the Ca
R's. The authors did not find any sign of an inhibiting
effect of the Ca released in their records. In spite of that and even constraining
the data set as mentioned before, they found that a Poisson distribution failed to
reproduce the observed histogram of event sizes particularly in the region of small
events (i.e., puffs with very few open channels). They could
approximately describe the distribution with a model that assumes a weak
cooperativity among channels. Inter-channel cooperativity is mediated by the Ca
released in their records. In spite of that and even constraining
the data set as mentioned before, they found that a Poisson distribution failed to
reproduce the observed histogram of event sizes particularly in the region of small
events (i.e., puffs with very few open channels). They could
approximately describe the distribution with a model that assumes a weak
cooperativity among channels. Inter-channel cooperativity is mediated by the Ca released through an open IP
 R that subsequently diffuses to a neighboring channel. Thus, the
distance between channels is a key factor that regulates the cooperativity strength
[21]. The approach of [1], however, does not take
space into account.
R that subsequently diffuses to a neighboring channel. Thus, the
distance between channels is a key factor that regulates the cooperativity strength
[21]. The approach of [1], however, does not take
space into account.
In the present paper we introduce a simple model that takes into account both the
stochasticity due to IP binding and the distance-dependent Ca
 -mediated cooperativity. It can reproduce the event size
distribution reported in [1] for events involving any number of open channels.
The distribution obtained with our model approaches a binomial or Poisson
distribution as the cooperativity strength increases so that the opening of one IP
-mediated cooperativity. It can reproduce the event size
distribution reported in [1] for events involving any number of open channels.
The distribution obtained with our model approaches a binomial or Poisson
distribution as the cooperativity strength increases so that the opening of one IP R induces the opening of all other IP
 R's with IP
 bound. This transition from Ca
 -dominated to IP
 -binding dominated stochasticity is similar to a percolation
transition. It also occurs if the number of IP
-binding dominated stochasticity is similar to a percolation
transition. It also occurs if the number of IP R's with IP
 bound increases. Therefore, the transition can be reflected on the
distribution of the number of IP
bound increases. Therefore, the transition can be reflected on the
distribution of the number of IP R's that open at a given release site.
Percolation in connection with Ca signals has been invoked to explain the transition from abortive
to propagating waves in cells [22]–[24]. Our paper is the
first to identify two limiting regimes of the intra-cluster dynamics that underlies
puffs and to characterize the change between them as a percolation transition.
Furthermore, we show how information on the transition between both regimes (the IP
signals has been invoked to explain the transition from abortive
to propagating waves in cells [22]–[24]. Our paper is the
first to identify two limiting regimes of the intra-cluster dynamics that underlies
puffs and to characterize the change between them as a percolation transition.
Furthermore, we show how information on the transition between both regimes (the IP -binding and the Ca
 dominated behaviors) can be extracted from the distribution of the
number of IP
dominated behaviors) can be extracted from the distribution of the
number of IP R's that open during a puff. Knowledge on this transition
can, in turn, yield information on the largest distance over which Ca
R's that open during a puff. Knowledge on this transition
can, in turn, yield information on the largest distance over which Ca -mediated cooperativity acts and on the mean density of IP
 -bound IP
 R's of the clusters. In this way, we can estimate
biophysical parameters that affect the intra-cluster dynamics from statistical
information on the emergent collective behavior of the channels of the cluster.
R's of the clusters. In this way, we can estimate
biophysical parameters that affect the intra-cluster dynamics from statistical
information on the emergent collective behavior of the channels of the cluster.
The aim of the simple model that we introduce in this paper is to characterize the
basic mechanisms that shape the distribution of the number of channels that open
during puffs. In particular, we identify the competition between two stochastic
processes as the main determinant of the form of the distribution. Therefore, an
analysis of this form may give information on the relative weight of the two
competing processes. The model does not include a detailed description of the
dynamics that takes place during or between events. For some time most models of
intracellular Ca dynamics were deterministic (see e.g.
[25]).
The observation of local signals such as puffs led to the development of several
models that included a stochastic description of Ca
dynamics were deterministic (see e.g.
[25]).
The observation of local signals such as puffs led to the development of several
models that included a stochastic description of Ca release [14], [15], [26], [27] or of the spatial location of the IP
 R's [28]. It is currently clear that stochastic effects
are not only relevant for local release events but are a fundamental aspect of the Ca
R's [28]. It is currently clear that stochastic effects
are not only relevant for local release events but are a fundamental aspect of the Ca dynamics for the full range of observed signals, including waves
[29]–[32]. More information on
stochastic models of Ca
dynamics for the full range of observed signals, including waves
[29]–[32]. More information on
stochastic models of Ca signals can be found in a recent focus issue on the subject [33].
Simulations of these stochastic dynamic models could be used to probe the main
findings of the present paper.
signals can be found in a recent focus issue on the subject [33].
Simulations of these stochastic dynamic models could be used to probe the main
findings of the present paper.
Results
The Model
We introduce here a simple model to describe the distribution of puff sizes that
occur at sites with similar numbers of IP R's. The model is simple in the sense that it does not
include a detailed description of the dynamics of the individual channel
openings and closings or of IP
R's. The model is simple in the sense that it does not
include a detailed description of the dynamics of the individual channel
openings and closings or of IP or Ca
or Ca binding and unbinding. However, it does include the
stochasticity associated to IP
binding and unbinding. However, it does include the
stochasticity associated to IP binding and channel coupling via CICR. Given the estimates of
[8], the model assumes that clusters occupy a fixed
size region (more specifically, a circle of radius,
binding and channel coupling via CICR. Given the estimates of
[8], the model assumes that clusters occupy a fixed
size region (more specifically, a circle of radius,  ) and that
  IP
IP R's are randomly distributed over the cluster region
with uniform probability. Each IP
R's are randomly distributed over the cluster region
with uniform probability. Each IP R of the cluster has a probability
  of having IP
 bound.
  is the random variable that represents the number of available IP
 R's (i.e., of IP
 R's with IP
 bound) of the cluster before a puff starts. The distribution
of this variable is a binomial of parameters
bound) of the cluster before a puff starts. The distribution
of this variable is a binomial of parameters  and
and  , that can be approximated by a Poisson distribution of
parameter
, that can be approximated by a Poisson distribution of
parameter  for
for  large and
  small enough (for example, with
  and
and  the absolute difference between both cumulative distributions
is lower than
the absolute difference between both cumulative distributions
is lower than  for each
  ). The model considers that if an IP
 R with IP
 bound becomes open and Ca
 starts to flow through its pore all other IP
 R's with IP
 bound that are within a distance,
  , of the open IP
 R will also become open. These newly opened IP
 R's in turn trigger the opening of new IP
 R's with IP
 bound that are within the distance,
  , from an open one. This scheme triggers a cascade of openings
that stops when there are no more available IP
, from an open one. This scheme triggers a cascade of openings
that stops when there are no more available IP R's within the radius of influence
(i.e., the distance
R's within the radius of influence
(i.e., the distance  ) of any open IP
 R. This cascade determines the number,
  , of channels that open during a puff. We call
  the probability that there are
  available IP
 R's (with IP
 bound) in a cluster and
  the conditional probability that
  channels open during an event given that there are
  with IP
 bound in the cluster. Given that we are interested in the
distribution of event sizes, we only consider the situations for which
bound in the cluster. Given that we are interested in the
distribution of event sizes, we only consider the situations for which  . Therefore, we renormalize the probabilities so that
 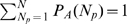 and
and 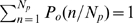 . In this way,
  is a binomial or a Poisson distribution divided by one minus
the probability that there are not IP
is a binomial or a Poisson distribution divided by one minus
the probability that there are not IP R's with IP
 bound in the cluster. Using these renormalized versions of
  and
and  , the probability,
  , of having a puff with
  open channels is given by:
| (1) |
 is approximated by a Poisson distribution of parameter
  when
when  .
.  can be readily compared with distributions obtained from
experimental observations as the one displayed in Fig. 4D of [1].
can be readily compared with distributions obtained from
experimental observations as the one displayed in Fig. 4D of [1].
Factors That Shape the Distribution of Event Sizes
The two stochastic components of the model are evident in the expression of  .
.  reflects the stochasticity of IP
 binding and
  the one due to inter-channel coupling via CICR. The relative
weight of both factors on the resulting
the one due to inter-channel coupling via CICR. The relative
weight of both factors on the resulting  depends on the relationship between two typical lengthscales
of the problem: the radius of influence,
depends on the relationship between two typical lengthscales
of the problem: the radius of influence,  (the maximum distance between channels at which CICR still
works) and the mean distance between channels with IP
(the maximum distance between channels at which CICR still
works) and the mean distance between channels with IP bound,
  , which is a random variable that can be computed in terms of
  and the number of IP
 R's with IP
 bound,
  , as:
, as:
| (2) |
 can take values between
  and
and  . Closely related to
  is the density of available IP
 R's which is given by:
| (3) |
 and
and  are related by:
  .
.
The relationship between  and
and  determines the relative weight of both stochastic components
on
determines the relative weight of both stochastic components
on  . In particular, if
  is very large, the opening of any channel of the cluster will
eventually lead to the opening of all other available channels. If such a
situation holds for most events, then
is very large, the opening of any channel of the cluster will
eventually lead to the opening of all other available channels. If such a
situation holds for most events, then 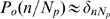 and
and  will mainly be determined by the stochastic component due to IP
 binding, i.e.,
  . If, for most events,
  is very small, then most of
  will be concentrated near
  , regardless of how many available IP
 R's there are in each realization. We will refer to
both extreme behaviors as IP
R's there are in each realization. We will refer to
both extreme behaviors as IP or Ca
or Ca limited. Depending on the parameters of the model (
 ,
,  ,
,  , and
, and  ), one or the other situation is favored. However, in many
situations one or the other behavior is favored depending on the value of
), one or the other situation is favored. However, in many
situations one or the other behavior is favored depending on the value of  , i.e., on the realization. In those cases,
the dominant stochastic component of
, i.e., on the realization. In those cases,
the dominant stochastic component of  depends on the value of
  .
.
We first illustrate how the distribution,  , varies with the number of IP
 R's of the cluster,
  , while all other parameters are fixed. As
  increases, the most likely values that
  can take on also increase. This means that it is more probable
to have more available IP
can take on also increase. This means that it is more probable
to have more available IP R's at any given instance. On the other hand, since
the spatial dimensions of the cluster are unchanged (
R's at any given instance. On the other hand, since
the spatial dimensions of the cluster are unchanged ( is fixed) the mean distance between available IP
 R's,
R's,  , is more likely to be smaller (see Eq. 2). Given that the
typical distance for CICR to occur,
, is more likely to be smaller (see Eq. 2). Given that the
typical distance for CICR to occur,  , is also fixed, it is more probable that
  be larger. Therefore,
  approaches
  as
as  is increased. This is illustrated in Fig. 1 where we have plotted the
distributions
is increased. This is illustrated in Fig. 1 where we have plotted the
distributions  (solid circles) and
  (bars) obtained with 1000 realizations of our model using
  ,
,  ,
,  and three values of
  . In A,
  , the number of available channels is small for most
realizations (its mean value is
, the number of available channels is small for most
realizations (its mean value is  ) so that
  is dominated by inter-channel Ca
 -coupling and concentrated around small values of
  . In C,
  , the number of available channels is large for most
realizations (its mean value is
, the number of available channels is large for most
realizations (its mean value is  ) so that
  is typically smaller than
  (
( ). In this case,
  is dominated by the IP
 -binding stochasticity and almost indistinguishable from the
distribution of available channels,
-binding stochasticity and almost indistinguishable from the
distribution of available channels,  . The example of Fig. 1 B corresponds to a situation in between these two extreme
cases with
. The example of Fig. 1 B corresponds to a situation in between these two extreme
cases with  . We can observe how, as the number of available channels is
more likely to be larger,
. We can observe how, as the number of available channels is
more likely to be larger,  approaches
  . We also observe that for
  and
and  ,
,  and
and  differ mainly in the region of small values of
  . This occurs because it is difficult for one open channel to
induce the opening of another one if the mean inter-channel distance is large.
Thus, if
. This occurs because it is difficult for one open channel to
induce the opening of another one if the mean inter-channel distance is large.
Thus, if  is small it is very rare that all available channels become
open. In this way, the relative frequency of small events becomes larger than
the fraction of instances with a small number of available channels.
is small it is very rare that all available channels become
open. In this way, the relative frequency of small events becomes larger than
the fraction of instances with a small number of available channels.
Figure 1. Distribution of puff sizes: transition between Ca -dominated to IP
 -binding dominated stochasticity.

Solid circles: distribution of puff sizes,  , obtained with our model for
  ,
,  ,
,  and three values of
  :
:  (A),
(A),  (B) and
  (C). Histograms (in grey): corresponding distributions
of available channels,
(C). Histograms (in grey): corresponding distributions
of available channels,  for the same parameter values. All distributions were
computed from 1000 realizations for each set of parameters.
for the same parameter values. All distributions were
computed from 1000 realizations for each set of parameters.
A transition from Ca -dominated to IP
 -binding dominated stochasticity also occurs as
  is increased, while all other parameters are fixed. In this
case,
is increased, while all other parameters are fixed. In this
case,  remains unchanged and so does the mean distance between
available IP
remains unchanged and so does the mean distance between
available IP R's,
R's,  . By changing
  it is possible to go from a situation in which
  is small for most events and
  is Ca
is Ca -limited to a situation in which
  is large and
  is IP
is IP -binding limited. This is illustrated in Fig. 2 where we have plotted the distribution
of event sizes that we obtain with our model for three different values of
-binding limited. This is illustrated in Fig. 2 where we have plotted the distribution
of event sizes that we obtain with our model for three different values of  . For
. For  , the distribution is Ca
 -coupling limited and is concentrated around
  . As
. As  is increased, the relative frequency of events with small
  decreases. For
  , the distribution is IP
 -binding limited. In this example,
  is well approximated by a Poisson distribution of parameter
  (data not shown). The situation in between these extreme cases
corresponds to
(data not shown). The situation in between these extreme cases
corresponds to  and is able to reproduce reasonably well the experimental
distribution of Fig. 4D of
[1]
(superimposed with bars in Fig.
2).
and is able to reproduce reasonably well the experimental
distribution of Fig. 4D of
[1]
(superimposed with bars in Fig.
2).
Figure 2. Distribution of puff sizes: change of behavior with the radius of influence and comparison with observations.

We show the probabiliy,  , of having a puff with
  open channels obtained with our model for
  ,
,  ,
,  and
and  (solid circles),
  (open circles) and
  (triangles). Each curve corresponds to 500
realizations of the model. We observe a transition from a Ca
(triangles). Each curve corresponds to 500
realizations of the model. We observe a transition from a Ca -dominated to a IP
 -binding dominated stochasticity distribution as
  increases. Superimposed with bars: experimental data
taken from Fig. 4D
of [1].
increases. Superimposed with bars: experimental data
taken from Fig. 4D
of [1].
In the Ca limited behavior the number of open channels,
  , is small for most events, regardless of the value of
  . This implies
  for almost all events. In the IP
 -binding limited behavior all available IP
 R's become open (
 in most cases). Therefore, in order to analyze the transition
between the Ca
in most cases). Therefore, in order to analyze the transition
between the Ca -dominated to IP
 -binding dominated stochasticity, we study how often events
occur for which all available IP
-binding dominated stochasticity, we study how often events
occur for which all available IP R's become open. This happens trivially for events
with
R's become open. This happens trivially for events
with  . Here we are interested in situations with
  . To this end, we compute numerically the probability that all
available IP
. To this end, we compute numerically the probability that all
available IP R's,
R's,  , become open,
  , which is a function of
  and of only one independent parameter, the dimensionless
radius of influence,
and of only one independent parameter, the dimensionless
radius of influence,  , (see Methods). We plot
in Fig. 3 A
, (see Methods). We plot
in Fig. 3 A
 as a function of
  , for
, for  (circles),
  (squares) and
  (triangles). As expected,
  is an increasing function of
  for each value of
  . We also observe that
  is an increasing (sigmoidal-like) function of
  that goes from 0 (i.e.
 in almost all cases, which corresponds to Ca
 -dominated stochasticity) to 1 (i.e.
 in almost all cases, which corresponds to IP
 -binding dominated stochasticity) and that such transition
occurs over a smaller interval of
-binding dominated stochasticity) and that such transition
occurs over a smaller interval of  values the larger
  is.
is.
Figure 3. Percolation transition: when all available channels open during a puff.

A: Probability that all available IP R's become open,
  , as a function of the dimensionless radius of
influence,
, as a function of the dimensionless radius of
influence,  , for
, for  (circles),
  (squares) and
  (triangles). B:
  (circles),
  (squares) and
  (triangles) as functions of
  . The values of
  and
and  for the case with
  are indicated in A with one and two asterisks,
respectively.
are indicated in A with one and two asterisks,
respectively.
We can think of the Ca -limited and the IP
 -binding limited situations as two phases and the transition
between them as a phase transition in the limit of very large
-binding limited situations as two phases and the transition
between them as a phase transition in the limit of very large  . This percolation-like transition occurs at a well defined
value of
. This percolation-like transition occurs at a well defined
value of  in this limit. For finite values of
  we introduce two quantities,
  and
and  , that determine the type of regime that we can expect (Ca
 -limited if
  or IP
or IP -binding limited if
  ) for each value of
  (see Methods). The arrows
in Fig. 3 A indicate the
values of
(see Methods). The arrows
in Fig. 3 A indicate the
values of  (*) and
  (**) for the
  case. We show in Fig. 3 B plots of
  ,
,  and
and  as functions of
  (Eq. (3)). It is important to note that these curves are the
same, regardless of the specific parameter values of the model. We observe that
all of them are decreasing functions of
(Eq. (3)). It is important to note that these curves are the
same, regardless of the specific parameter values of the model. We observe that
all of them are decreasing functions of  or, equivalently, of
  .
.  is a stochastic variable that changes from realization to
realization. Therefore, even for a given cluster (characterized by fixed values
of
is a stochastic variable that changes from realization to
realization. Therefore, even for a given cluster (characterized by fixed values
of  ,
,  and
and  )
)  and
and  may take on different values depending on the realization. In
this way, depending on
may take on different values depending on the realization. In
this way, depending on  and the values that
  may take on, a subset of the events that occur at a cluster
may be IP
may take on, a subset of the events that occur at a cluster
may be IP -binding limited (those for which
  ) while others are not. An analogous situation may hold
regarding the Ca
) while others are not. An analogous situation may hold
regarding the Ca -limited behavior. Furthermore, for some clusters, the Ca
 -limited condition may hold for some events and the IP
 -binding limited for others. If the parameters
  ,
,  ,
,  and
and  are such that most realizations satisfy
  , then most events will be IP
 -binding limited. This happens if
  or
or  are large enough, in which case the distribution of event
sizes,
are large enough, in which case the distribution of event
sizes,  , approaches the distribution of available channels,
  .
.
Observing Percolation as a Function of Event Size
The results of Fig. 3 B imply
that there are clusters that can display different types of behaviors depending
on the event. For these clusters, we expect to find, in their distribution,  , a trace of the transition to the limiting behavior that they
can display. Here we are interested in the percolation transition,
i.e., the transition to the IP
, a trace of the transition to the limiting behavior that they
can display. Here we are interested in the percolation transition,
i.e., the transition to the IP -binding dominated stochasticity. As already discussed, the
larger
-binding dominated stochasticity. As already discussed, the
larger  the more likely it is that all IP
 R's become open during the puff (see Fig. 3 A). Thus, the
transition to the IP
R's become open during the puff (see Fig. 3 A). Thus, the
transition to the IP -binding dominated stochasticity should occur as
  and, consequently,
  become larger. To study this transition we consider a cluster
with fixed parameters
become larger. To study this transition we consider a cluster
with fixed parameters  ,
,  ,
,  and
and  (or
(or  in the Poisson limit) and define
  as the minimum value of
  such that
  . The definition of
  is based on the conditional probability,
  , which is independent of
  . In cases with finite
  ,
,  is meaningful provided that it be smaller than
  . Since
  decreases with
  (see Fig. 3
B), taking into account the definitions of
(see Fig. 3
B), taking into account the definitions of  and of
  (see Methods) we conclude
that
(see Methods) we conclude
that  and
and  for all
  . Thus, we can approximate:
| (4) |
with less than 10% error. Inserting this approximation in Eq. (1) we obtain:
| (5) |
| (6) |
We then conclude that the  tail of
  corresponds to IP
 -binding dominated events. Therefore, it should be possible to
approximate it by a (renormalized) binomial (provided that
-binding dominated events. Therefore, it should be possible to
approximate it by a (renormalized) binomial (provided that  ) or Poisson distribution in the region of large
  . The left border of this IP
 dominated behavior,
  , gives information on
  , i.e. on the maximum distance for which
CICR-coupling can work effectively. Therefore, it should be possible to estimate
, i.e. on the maximum distance for which
CICR-coupling can work effectively. Therefore, it should be possible to estimate  by analyzing
  , i.e., to infer a biophysical parameter that
characterizes the intra-cluster dynamics from statistical information on the
emergent collective behavior of the channels of the cluster.
, i.e., to infer a biophysical parameter that
characterizes the intra-cluster dynamics from statistical information on the
emergent collective behavior of the channels of the cluster.
Determining Intra-Cluster Properties from Observations of the Cluster as a Whole
We now discuss how we can estimate  from an experimental distribution of event sizes,
  . For the sake of simplicity, we assume that
  can be approximated by a renormalized Poisson distribution,
  , of unknown parameter
  . The goal of this section is to provide a way to estimate
  and
and  , the value of
  at which
  and
and  depart from one another (see Eq. (6)). Once
  is inferred, we estimate
  as
as  using the function displayed in Fig. 3 B. To this end, we focus on the large
  tails of
  and
and  by computing the complementary cumulative distribution functions:
| (7) |
| (8) |
for  . Given that
  is proportional to a Poisson distribution, there is an
analytic expression for
is proportional to a Poisson distribution, there is an
analytic expression for  . Namely,
  , where
  is the incomplete
  function and
  is the integer part of
  . If the cluster is such that
  exists so that
  is larger than
  for
for  and it is smaller otherwise, then, according to the
calculation of the previous section,
and it is smaller otherwise, then, according to the
calculation of the previous section,  for
for  . Therefore, the complementary cumulative distribution
functions of Eqs. (7)–(8) also satisfy
. Therefore, the complementary cumulative distribution
functions of Eqs. (7)–(8) also satisfy  for
for  .
.
We now describe how to estimate  and
and  . The aim is to obtain a (renormalized) Poisson distribution,
  that can approximate
  in the large
  region. If we find it, we assume that it is a good
approximation of the distribution of available channels,
region. If we find it, we assume that it is a good
approximation of the distribution of available channels,  . As illustrated in Fig. 1, the mean value,
  that is obtained using the experimental distribution,
  , is smaller than the one that would be obtained if
  was used instead. On the other hand, if
  is a good approximation of
  in the large
  region, then the mean value obtained with
  should be smaller than the size of the largest observed event,
  . This implies that
| (9) |
if  can be approximated by a renormalized Poisson distribution of
parameter
can be approximated by a renormalized Poisson distribution of
parameter  . Therefore, we look for the best
  within a finite set of renormalized Poisson distributions of
parameters
within a finite set of renormalized Poisson distributions of
parameters  satisfying (9). In order to estimate
  from the observations the relevant quantity that we need to
obtain is
from the observations the relevant quantity that we need to
obtain is  , which is an integer. For this purpose, it is possible to use
a rather coarse grid of
, which is an integer. For this purpose, it is possible to use
a rather coarse grid of  values within the interval defined in (9). In particular, we
have mainly used integer values of
values within the interval defined in (9). In particular, we
have mainly used integer values of  obtaining good results. Once the values
  are chosen, we compute the complementary cumulative
distribution functions,
are chosen, we compute the complementary cumulative
distribution functions,  given by (8) for each
  and
and  . We then calculate the error of approximating
  by
by  over the interval
  as a function of
  :
:
| (10) |
We set a threshold for the error,  , and choose
  for each
  as the smallest value of
  for which
  . Finally, we choose the best
  as the one with the smallest
  .
.
The procedure is illustrated in Fig.
4 where the “experimental” distribution comes
from a simulation of our model with  ,
,  ,
,  and
and  . In this case,
  . We show in Fig.
4 A the complementary cumulative distribution functions and in Fig. 4 B the errors for the
values of
. We show in Fig.
4 A the complementary cumulative distribution functions and in Fig. 4 B the errors for the
values of  that we have considered:
  (inverted triangles),
  (triangles),
  (squares) and
  (rhombes). Larger values of
  give very bad approximations and are not shown. We show in
Fig. 4 C the values,
give very bad approximations and are not shown. We show in
Fig. 4 C the values,  , obtained for each
  using the threshold,
  (shown with a horizontal line in Fig. 4 B). In this example, the best value is
  for which
  . We estimate the density of IP
 -bound IP
 R's at which the departure between the experimental
and the Poisson distribution occurs as
R's at which the departure between the experimental
and the Poisson distribution occurs as  , where we have used
  . Using the

 relationship displayed in Fig. 3 B, we estimate
  from which we get
  . This provides an estimate of the radius of influence which
compares very well with the value that was used to generate the data,
. This provides an estimate of the radius of influence which
compares very well with the value that was used to generate the data,  . Using the same procedure, we analyzed the data presented in
Fig. 4D of [1] and
obtained
. Using the same procedure, we analyzed the data presented in
Fig. 4D of [1] and
obtained  assuming
  .
.
Figure 4. Change of behavior with event size.

A:  for data obtained with our model using
  ,
,  ,
,  and
and  (solid circles). Complementary cumulative Poisson
distributions,
(solid circles). Complementary cumulative Poisson
distributions,  , for
, for  (inverted triangles),
  (triangles),
  (squares),
  (rhombes). B: Error of approximating
  by the various
  for
for  (see text for definition) as a function of
  . Symbols are the same as in A. From this figure we
choose
. Symbols are the same as in A. From this figure we
choose  as the one that provides the best fit to the tail of
  . The error in the
  case is larger than 0.02 in most cases and falls
outside the region displayed in the figure. C:
case is larger than 0.02 in most cases and falls
outside the region displayed in the figure. C:  for the four values of
  that we tested. We see that
  .
.
Discussion
Intracellular Ca signals are built from localized release events in which Ca
 enters the cytosol through one or several channels. Ca
 release from the endoplasmic reticulum through IP
 R's is a key component of the Ca
 signaling toolkit in many cell types. IP
 R's are Ca
 channels that need to bind IP
 and Ca
 to become open and are usually organized in clusters on the
membrane of the endoplasmic reticulum. The intra-cluster organization and the
interactions of the channels within it affect the dynamics and extent of the
signals. Therefore, their study is a matter of active research.
to become open and are usually organized in clusters on the
membrane of the endoplasmic reticulum. The intra-cluster organization and the
interactions of the channels within it affect the dynamics and extent of the
signals. Therefore, their study is a matter of active research.
Recent experiments [1] that use super-resolution optical techniques are
providing detailed data on elementary IP R-mediated Ca
 release events in mammalian cells. In the experiments, the number
of IP
release events in mammalian cells. In the experiments, the number
of IP R- Ca
R- Ca -channels that open during each event can be inferred from the
observed puff amplitudes without much processing. The observations of [1] showed
that the variability among clusters affected the shape of the event size
distribution,
-channels that open during each event can be inferred from the
observed puff amplitudes without much processing. The observations of [1] showed
that the variability among clusters affected the shape of the event size
distribution,  . In order to get rid of this variability, the distribution coming
from sites with similar properties was computed in [1]. The distribution,
. In order to get rid of this variability, the distribution coming
from sites with similar properties was computed in [1]. The distribution,  , obtained in this way was not Poisson, as we might have expected
if the number of channels that opened during each event was proportional to the
number of IP
, obtained in this way was not Poisson, as we might have expected
if the number of channels that opened during each event was proportional to the
number of IP R's with IP
 bound in the cluster [8]. The authors of [1] could
reproduce
bound in the cluster [8]. The authors of [1] could
reproduce  approximately (for events larger than a certain size) assuming a
weak cooperativity among channels. Namely, they assumed that the probability that a
channel became open scaled as some power of the number of open channels and obtained
that the exponent was 1/3 from a fit to the data. The rationale for the
cooperativity assumption relied on the fact that the IP
approximately (for events larger than a certain size) assuming a
weak cooperativity among channels. Namely, they assumed that the probability that a
channel became open scaled as some power of the number of open channels and obtained
that the exponent was 1/3 from a fit to the data. The rationale for the
cooperativity assumption relied on the fact that the IP R's of a cluster may be coupled via CICR induced by the Ca
 ions that travel from an open IP
 R to a neighboring one. The model of [1], however, did not take
space into account and did not provide a mechanistic explanation for the obtained
scaling.
R to a neighboring one. The model of [1], however, did not take
space into account and did not provide a mechanistic explanation for the obtained
scaling.
In this paper we have presented a simple model that includes a description of the
intra-cluster spatial organization with which we can reproduce the observed
distribution over all event sizes. In the model the distribution,  , is the result of the competition of two stochastic processes: IP
 binding and distance-dependent CICR. The model assumes a
stationarity condition, namely, that the agonists concentration at the release site
is the same immediately before the occurrence of each puff. This condition holds as
long as puffs are independent of one another. This is consistent with the
observations reported in [1] where cluster coupling was prevented using the
slow Ca
binding and distance-dependent CICR. The model assumes a
stationarity condition, namely, that the agonists concentration at the release site
is the same immediately before the occurrence of each puff. This condition holds as
long as puffs are independent of one another. This is consistent with the
observations reported in [1] where cluster coupling was prevented using the
slow Ca buffer EGTA and where IP
 R- Ca
R- Ca -inhibition does not play a significant role. In any case, our
model is adequate to describe the distribution of first event sizes that occur at
each cluster before Ca
-inhibition does not play a significant role. In any case, our
model is adequate to describe the distribution of first event sizes that occur at
each cluster before Ca can exert any inhibiting effect.
There are two limiting cases in which one of the two stochastic processes considered
in the model is the main determinant of the distribution shape. If the mean distance
between IP R's with IP
 bound in the cluster is much smaller than the typical distance of
inter-channel coupling due to CICR for most events, the distribution is IP
bound in the cluster is much smaller than the typical distance of
inter-channel coupling due to CICR for most events, the distribution is IP -binding limited and it can be approximated by a binomial or
Poisson distribution. In the opposite case, CICR dominates and the distribution is
peaked around
-binding limited and it can be approximated by a binomial or
Poisson distribution. In the opposite case, CICR dominates and the distribution is
peaked around  . The Ca
 -limited and the IP
 -binding limited situations can be thought of as two phases and the
transition between them as a percolation-like transition in the limit in which the
number of IP
-binding limited situations can be thought of as two phases and the
transition between them as a percolation-like transition in the limit in which the
number of IP R's with IP
 bound,
  , is very large. This interpretation of the factors that shape the
observed distribution can be tested with simulations of some of the stochastic
models of intracellular Ca
, is very large. This interpretation of the factors that shape the
observed distribution can be tested with simulations of some of the stochastic
models of intracellular Ca signals reported in the literature (see e.g.
[33] and
references therein). They can also be tested experimentally. One possibility is to
change the most likely values of
signals reported in the literature (see e.g.
[33] and
references therein). They can also be tested experimentally. One possibility is to
change the most likely values of  by changing the amount of IP
 that is photo-released in the cell. An alternative option is to
analyze
that is photo-released in the cell. An alternative option is to
analyze  for events coming from clusters that give rise, on average, to
larger events. According to the model, the distribution should approach a binomial
or Poisson distribution as the mean value of
for events coming from clusters that give rise, on average, to
larger events. According to the model, the distribution should approach a binomial
or Poisson distribution as the mean value of  becomes larger while other parameters remain the same. Another way
to affect the balance between both stochastic components is to disrupt Ca
becomes larger while other parameters remain the same. Another way
to affect the balance between both stochastic components is to disrupt Ca -mediated inter-channel coupling by means of a fast buffer such as
BAPTA.
-mediated inter-channel coupling by means of a fast buffer such as
BAPTA.
Given that  is a stochastic variable that varies from event to event, the
transition between the Ca
is a stochastic variable that varies from event to event, the
transition between the Ca -dominated and IP
 -binding dominated stochasticity described by the model may be
reflected in the way that
-binding dominated stochasticity described by the model may be
reflected in the way that  depends on the event size,
  . In fact, we have used this property to show how a fingerprint of
this transition may be encountered in
. In fact, we have used this property to show how a fingerprint of
this transition may be encountered in  and how information on the inter-channel coupling distance may be
extracted from it. This means that a parameter that characterizes the communication
between pairs of channels can be estimated from statistical information on the
emergent collective behavior of the channels of the cluster. This information could
be used to analyze the effect of buffers on the intra-cluster dynamics, a matter
that is of active current research [19], [34]. Our model provides a simple tool with which this
effect can be analyzed in experiments.
and how information on the inter-channel coupling distance may be
extracted from it. This means that a parameter that characterizes the communication
between pairs of channels can be estimated from statistical information on the
emergent collective behavior of the channels of the cluster. This information could
be used to analyze the effect of buffers on the intra-cluster dynamics, a matter
that is of active current research [19], [34]. Our model provides a simple tool with which this
effect can be analyzed in experiments.
Methods
Each term of the sum that defines Eq. (1) is the product of two functions. We have an
analytic expression for one of them,  , but not for
  . Thus, we compute
  numerically performing realizations of the model with fixed values
of
numerically performing realizations of the model with fixed values
of  ,
,  ,
,  and
and  . The location of the channels within the cluster and which of them
have IP
. The location of the channels within the cluster and which of them
have IP bound vary among realizations and are chosen randomly (see Results). We only keep realizations with
  . Once we have the spatial distribution of available IP
 R's, we start each event by picking at random one of the IP
 R's with IP
 bound and assume it is open. If
  , we assume it gives rise to an event with
  . By changing the values of
  ,
,  ,
,  and
and  we analyze how
  varies with them. In this way we can determine the values of the
parameters that best reproduce the experimental observations.
varies with them. In this way we can determine the values of the
parameters that best reproduce the experimental observations.  could be measured in units of the cluster spatial extent,
  , in which case we would get rid of one parameter of the problem,
  . We keep it to make a connection with the experimental data.
However, it is important to note that the number of independent parameters of the
model is 3, for finite
. We keep it to make a connection with the experimental data.
However, it is important to note that the number of independent parameters of the
model is 3, for finite  and 2 in the limit in which
  can be approximated by a Poisson distribution.
For each value,  , of available IP
 R's, we estimate the fraction of events such that the
  IP
IP R's become open. This fraction is one for
  . For
. For  , we compute the probability that all available IP
 R's become open,
  , numerically, performing 500 stochastic realizations of our model
for each of which we fix the value of
, numerically, performing 500 stochastic realizations of our model
for each of which we fix the value of  a priori. Namely, we fix at the beginning the values of
  ,
,  and
and  and then pick
  locations at random over the circle where we assume there are
available IP
locations at random over the circle where we assume there are
available IP R's. From there on, the model goes on as before,
generating the cascade of openings that determines
R's. From there on, the model goes on as before,
generating the cascade of openings that determines  . The distribution of events with
  open channels for each value of
  gives
gives  . This function of
  depends on only one independent parameter,
  . As expected, it is an increasing function of
  (see Fig. 3
A).
(see Fig. 3
A).
We define two quantities,  and
and  , which are values of
  for which
  is either close to 1 or to 0, respectively. We compute them as
follows. We first calculate a lower bound for
is either close to 1 or to 0, respectively. We compute them as
follows. We first calculate a lower bound for  as the minimum value of
  such that, if
  is larger than this lower bound, then
  . We calculate an upper bound for
  as the minimum value of
  for which
  . Then, we compute
  as the mean between these two bounds. We assume that the distance
between the bounds is the error with which
as the mean between these two bounds. We assume that the distance
between the bounds is the error with which  can be determined. We proceed analogously in the case of
  , but in this case the lower bound is the largest value of
  for which
  and the upper bound is the maximum value of
  for which
  . We compute
  and
and  in this way using the numerical estimations of
  for various values of
  .
.
Acknowledgments
We acknowledge useful discussions with Ian Parker and Ian Smith and that they provide us with their experimental data. We also acknowledge Giorgio Rispoli and the other two referees for their careful reading of the manuscript and useful comments and suggestions.
Footnotes
Competing Interests: The authors have declared that no competing interests exist.
Funding: This work was supported by Proyecto de Investigación Científica y Tecnológica (PICT) 17-21001 granted by Agencia Nacional de Promocion Cientifica y Tecnologica (ANPCyT, http://www.agencia.gov.ar/), and by Proyecto de Investigación Plurianual (PIP) 112-200801-01612 granted by Consejo Nacional de Investigaciones Científicas y Técnicas (CONICET) UBA (http://www.uba.ar/secyt/subsidios/index.php), Santa Fe Institute (http://www.santafe.edu/). The funders had no role in study design, data collection and analysis, decision to publish, or preparation of the manuscript.
References
- 1.Smith IF, Parker I. Imaging the quantal substructure of single IP3R channel activity during Ca2+ puffs in intact mammalian cells. Proc Natl Acad Sci (USA) 2009;106:6404–6409. doi: 10.1073/pnas.0810799106. [DOI] [PMC free article] [PubMed] [Google Scholar]
- 2.Berridge MJ, Bootman MD, Lipp P. Calcium - a life and death signal. Nature. 1998;395:645–648. doi: 10.1038/27094. [DOI] [PubMed] [Google Scholar]
- 3.DeYoung G, Keizer J. A single-pool inositol 1,4,5-trisphosphate-receptor-based model for agonist-stimulated oscillations in Ca2+ concentration. Proc Natl Acad Sci (USA) 1992;89:9895–9899. doi: 10.1073/pnas.89.20.9895. [DOI] [PMC free article] [PubMed] [Google Scholar]
- 4.Fraiman D, Ponce Dawson S. A model of the IP3 receptor with a luminal calcium binding site: stochastic simulations and analysis. Cell Calcium. 2004;35:403–413. doi: 10.1016/j.ceca.2003.10.004. [DOI] [PubMed] [Google Scholar]
- 5.Shuai J, Pearson JE, Foskett JK, Mak DOD, Parker I. A kinetic model of clustered IP3 receptors in the absence of Ca2+ feedback. Biophysical Journal. 2007;93:1151–1162. doi: 10.1529/biophysj.107.108795. [DOI] [PMC free article] [PubMed] [Google Scholar]
- 6.Yao Y, Choi J, Parker I. Quantal puffs of intracellular Ca2+ evoked by inositol trisphosphate in xenopus oocytes. J Physiol (Lond) 1995;482:533–553. doi: 10.1113/jphysiol.1995.sp020538. [DOI] [PMC free article] [PubMed] [Google Scholar]
- 7.Shuai J, Rose HJ, Parker I. The number and spatial distribution of IP3 receptors underlying calcium puffs in xenopus oocytes. Biophys J. 2006;91:4033–4044. doi: 10.1529/biophysj.106.088880. [DOI] [PMC free article] [PubMed] [Google Scholar]
- 8.Bruno L, Ventura AC, Dargan S, Ponce Dawson S. Quantifying calcium fluxes underlying calcium puffs in xenopus laevis oocytes. Cell Calcium. 2009 doi: 10.1016/j.ceca.2009.12.012. In press. [DOI] [PMC free article] [PubMed] [Google Scholar]
- 9.Ur-Rahman T, Skupin A, Falcke M, Taylor CW. Clustering of IP3 receptors by IP3 retunes their regulation by IP3 and Ca2+. Nature. 2009;458:655–659. doi: 10.1038/nature07763. [DOI] [PMC free article] [PubMed] [Google Scholar]
- 10.Sun XP, Callamaras N, Marchant JS, Parker I. A continuum of IP3-mediated elementary Ca2+ signalling events in xenopus oocytes. J Physiol (Lond) 1998;509:67–80. doi: 10.1111/j.1469-7793.1998.067bo.x. [DOI] [PMC free article] [PubMed] [Google Scholar]
- 11.Parker I, Yao Y. Ca2+ transients associated with openings of inositol trisphosphate-gated channels in xenopus oocytes. J Physiol. 1996;491(Pt 3):663–8. doi: 10.1113/jphysiol.1996.sp021247. [DOI] [PMC free article] [PubMed] [Google Scholar]
- 12.Bootman MD, Berridge MJ, Lipp P. Cooking with calcium: the recipes for composing global signals from elementary events. Cell. 1997;91:367–373. doi: 10.1016/s0092-8674(00)80420-1. [DOI] [PubMed] [Google Scholar]
- 13.Callamaras N, Marchant JS, Sun XP, Parker I. Activation and co-ordination of IP3-mediated elementary Ca2+ events during global Ca2+ signals in xenopus oocytes. J Physiol. 1998;509:81–91. doi: 10.1111/j.1469-7793.1998.081bo.x. [DOI] [PMC free article] [PubMed] [Google Scholar]
- 14.Swillens S, Dupont G, Combettes L, Champell P. From calcium blips to calcium puffs: Theoretical analysis of the requirements for interchannel communication. Proc Natl Acad Sci (USA) 1999;96:13750–13755. doi: 10.1073/pnas.96.24.13750. [DOI] [PMC free article] [PubMed] [Google Scholar]
- 15.Falcke M. On the role of stochastic channel behavior in intracellular Ca2+ dynamics. Biophys J. 2003;84:42–56. doi: 10.1016/S0006-3495(03)74831-0. [DOI] [PMC free article] [PubMed] [Google Scholar]
- 16.Fraiman D, Pando B, Dargan S, Parker I, Ponce Dawson S. Analysis of puff dynamics in oocytes: Interdependence of puff amplitude and interpuff interval. Biophys J. 2006;90:3897–3907. doi: 10.1529/biophysj.105.075911. [DOI] [PMC free article] [PubMed] [Google Scholar]
- 17.Allbritton N, Meyer T, Stryer L. Range of messenger action of calcium ion and inositol 1,4,5-trisphosphate. Science. 1992;258:1812–1815. doi: 10.1126/science.1465619. [DOI] [PubMed] [Google Scholar]
- 18.Falcke M. Buffers and oscillations in intracellular Ca2+ dynamics. Biophys J. 2003;84:28–41. doi: 10.1016/S0006-3495(03)74830-9. [DOI] [PMC free article] [PubMed] [Google Scholar]
- 19.Zeller S, Rüdiger S, Engel H, Sneyd J, Warnecke G, et al. Modeling of the modulation by buffers of Ca2+ release through clusters of IP3 receptors. Biophys J. 2009;97:992–1002. doi: 10.1016/j.bpj.2009.05.050. [DOI] [PMC free article] [PubMed] [Google Scholar]
- 20.Smith IF, Wiltgen SM, Parker I. Localization of puff sites adjacent to the plasma membrane: Functional and spatial characterization of Ca2+ signaling in SH-SY5Y cells utilizing membrane-permeant caged IP3. Cell Calcium. 2009;45:65–76. doi: 10.1016/j.ceca.2008.06.001. [DOI] [PMC free article] [PubMed] [Google Scholar]
- 21.Ponce Dawson S, Keizer J, Pearson JE. Fire-diffuse-fire model of dynamics of intracellular calcium waves. Proc Natl Acad Sci (USA) 1999;96:6060–6063. doi: 10.1073/pnas.96.11.6060. [DOI] [PMC free article] [PubMed] [Google Scholar]
- 22.Bär M, Falcke M, Levine H, Tsimring LS. Discrete stochastic modeling of calcium channel dynamics. Phys Rev Lett. 2000;84:5664–5667. doi: 10.1103/PhysRevLett.84.5664. [DOI] [PubMed] [Google Scholar]
- 23.Pencea CS, Hentschel HGE. Excitable calcium wave propagation in the presence of localized stores. Phys Rev E. 2000;62:8420–8426. doi: 10.1103/physreve.62.8420. [DOI] [PubMed] [Google Scholar]
- 24.Timofeeva Y, Coombes S. Directed percolation in a two-dimensional stochastic fire-diffuse-fire model. Phys Rev E. 2004;70: 062901:1–3. doi: 10.1103/PhysRevE.70.062901. [DOI] [PubMed] [Google Scholar]
- 25.Schuster S, Marhl M, Höfer T. Modelling of simple and complex calcium oscillations. from single-cell responses to intercellular signalling. Eur J Biochem. 2002;269:1333–55. doi: 10.1046/j.0014-2956.2001.02720.x. [DOI] [PubMed] [Google Scholar]
- 26.Shuai JW, Jung P. Optimal intracellular calcium signaling. Phys Rev Lett. 2002;88: 068102:1–4. doi: 10.1103/PhysRevLett.88.068102. [DOI] [PubMed] [Google Scholar]
- 27.Shuai JW, Jung P. Optimal ion channel clustering for intracellular calcium signaling. Proc Natl Acad Sci (USA) 2003;100:506–510. doi: 10.1073/pnas.0236032100. [DOI] [PMC free article] [PubMed] [Google Scholar]
- 28.Bugrim AE, Zhabotinsky AM, Epstein IR. Calcium waves in a model with a random spatially discrete distribution of Ca2+ release sites. Biophys J. 1997;73:2897–2906. doi: 10.1016/S0006-3495(97)78318-8. [DOI] [PMC free article] [PubMed] [Google Scholar]
- 29.Skupin A, Kettenmann H, Winkler U, Wartenberg M, Sauer H, et al. How does intracellular Ca2+ oscillate: By chance or by the clock? Biophys J. 2008;94:2404–2411. doi: 10.1529/biophysj.107.119495. [DOI] [PMC free article] [PubMed] [Google Scholar]
- 30.Perc M, Green AK, Dixon CJ, Marhl M. Establishing the stochastic nature of intracellular calcium oscillations from experimental data. Biophys Chem. 2008;132:33–38. doi: 10.1016/j.bpc.2007.10.002. [DOI] [PubMed] [Google Scholar]
- 31.Perc M, Gosak M, Marhl M. Periodic calcium waves in coupled cells induced by internal noise. Chem Phys Lett. 2007;437:143–147. [Google Scholar]
- 32.Perc M, Gosak M, Marhl M. From stochasticity to determinism in the collective dynamics of diffusively coupled cells. Chem Phys Lett. 2006;421:106–110. [Google Scholar]
- 33.Falcke M. Introduction to focus issue: Intracellular Ca2+ dynamics— a change of modeling paradigm? Chaos: An Interdisciplinary Journal of Nonlinear Science. 2009;19:037101. doi: 10.1063/1.3234259. [DOI] [PubMed] [Google Scholar]
- 34.Shuai J, Pearson JE, Parker I. Modeling Ca2+ feedback on a single inositol 1,4,5-triphosphate receptor and its modulation by Ca2+ buffers. Biophysical Journal. 2008;95:3738–3752. doi: 10.1529/biophysj.108.137182. [DOI] [PMC free article] [PubMed] [Google Scholar]