

Abstract
Objective:
Inherited prion diseases are progressive neurodegenerative conditions, characterized by cerebral spongiosis, gliosis, and neuronal loss, caused by mutations within the prion protein (PRNP) gene. We wished to assess the potential of diffusion-weighted MRI as a biomarker of disease severity in inherited prion diseases.
Methods:
Twenty-five subjects (mean age 45.2 years) with a known PRNP mutation including 19 symptomatic patients, 6 gene-positive asymptomatic subjects, and 7 controls (mean age 54.1 years) underwent conventional and diffusion-weighted MRI. An index of normalized brain volume (NBV) and region of interest (ROI) mean apparent diffusion coefficient (ADC) for the head of caudate, putamen, and pulvinar nuclei were recorded. ADC histograms were computed for whole brain (WB) and gray matter (GM) tissue fractions. Clinical assessment utilized standardized clinical scores. Mann-Whitney U test and regression analyses were performed.
Results:
Symptomatic patients exhibited an increased WB mean ADC (p = 0.006) and GM mean ADC (p = 0.024) compared to controls. Decreased NBV and increased mean ADC measures significantly correlated with clinical measures of disease severity. Using a stepwise multivariate regression procedure, GM mean ADC was an independent predictor of Clinician's Dementia Rating score (p = 0.001), Barthel Index of activities of daily living (p = 0.001), and Rankin disability score (p = 0.019).
Conclusions:
Brain volume loss in inherited prion diseases is accompanied by increased cerebral apparent diffusion coefficient (ADC), correlating with increased disease severity. The association between gray matter ADC and clinical neurologic status suggests this measure may prove a useful biomarker of disease activity in inherited prion diseases.
GLOSSARY
- ADAS-Cog
= Alzheimer's Disease Assessment Scale–Cognitive subscale;
- ADC
= apparent diffusion coefficient;
- ADL
= Barthel Activities of Daily Living scale;
- BET
= brain extraction tool;
- BPRS
= Brief Psychiatric Rating Scale;
- BSE
= bovine spongiform encephalopathy;
- CDR
= Clinician's Dementia Rating Scale;
- CGIS
= Clinician's Global Impression of Disease;
- CI
= confidence interval;
- DWI
= diffusion-weighted imaging;
- FLAIR
= fluid-attenuated inversion recovery;
- FOV
= field of view;
- GM
= gray matter;
- LC
= left head of caudate;
- LP
= left putamen;
- LPu
= left pulvinar;
- MMSE
= Mini-Mental State Examination;
- NBV
= normalized brain volume;
- PH
= peak height;
- PL
= peak location;
- RC
= right head of caudate;
- RP
= right putamen;
- RPu
= right pulvinar;
- ROI
= region of interest;
- sCJD
= sporadic Creutzfeldt-Jakob disease;
- TE
= echo time;
- TI
= inversion time;
- TR
= repetition time;
- vCJD
= variant Creutzfeldt-Jakob disease;
- WB
= whole brain;
- WM
= white matter.
Human prion diseases are a group of progressive neurodegenerative and invariably fatal disorders characterized by accumulation of aggregates of an abnormally folded, protease-resistant, beta-sheet rich isoform of a normal cellular protein, the prion protein (PrPc), designated PrPSc. Deposition of PrPSc in the form of diffuse deposits or plaques of various morphologies is accompanied by the classic histologic triad of spongiosis, gliosis, and neuronal loss.1 Most cases occur sporadically but inherited, iatrogenic, and dietary transmission can occur. There has been increased interest in these conditions in recent years with the discovery of variant Creutzfeldt-Jakob disease (vCJD), since research, including laboratory transmission studies in mice, have shown that vCJD is caused by the same prion strain as that causing bovine spongiform encephalopathy (BSE).2 With recent reports of bloodborne transmission,3 the diseases remain an important public health issue and attention is currently focused on the development of therapeutic agents. There is therefore an increasing need to complement clinical outcome markers with objective and quantifiable noninvasive measures.
Apparent diffusion coefficient (ADC) measurements obtained by MRI provide quantitative estimates of regional and whole brain water mean diffusivity and may provide objective noninvasive markers for early diagnosis, disease progression, or monitoring the effects of therapeutic intervention. Although diffusion-weighted imaging (DWI) has emerged as a sensitive diagnostic technique in cases of sporadic CJD (sCJD),4–6 few studies have quantified cerebral ADC in the various forms of human prion disease,7,8 with even fewer addressing cerebral ADC in inherited prion diseases.9–11
In the present study, we measured regional and whole brain cerebral ADCs in patients with inherited prion diseases, and healthy control subjects for comparison. By correlating ADC measures with clinical scores, we aimed to find MRI indices of disease severity as potential objective biomarkers of disease activity.
METHODS
Standard protocol approvals, registrations, and patient consent.
All patients were recruited into the MRC Prion-1 trial (ISRCTN06722585).12 Approval for the study was received by the Eastern Multicenter Research Ethics Committee, a regional ethical standard committee on human experimentation using human subjects. Written consent was obtained for all subjects or their guardians.
Patients.
Twenty-five patients with inherited prion diseases (13 female, 12 male, mean age 45.2 years, range 32–58 years) referred to the National Prion Clinic, National Hospital for Neurology and Neurosurgery, London, UK, were included in this study. Seven healthy volunteers were also recruited (4 female, 3 male; mean age 54.1 years; range 42–61 years) with no personal or family history of neurologic disorders and gave informed consent.
Patients were subject to a structured neurologic examination at the time of the MRI acquisitions by a qualified neurologist blinded to the MRI findings, and the following scores calculated: Mini-Mental State Examination (MMSE),13 Clinician's Dementia Rating Scale (CDR),14 Rankin disability scale,15 Alzheimer's Disease Assessment Scale–Cognitive subscale (ADAS-Cog),16 Barthel Activities of Daily Living scale (ADL),17 Clinician's Global Impression of Disease Severity (CGIS),18 and Brief Psychiatric Rating Scale (BPRS).19
Fourteen patients were taking a standard clinical dose of quinacrine 300 mg once daily as part of the MRC Prion-1 Trial.
MRI acquisition.
Subjects were examined using a GE Signa LX 1.5T MRI system (GE Healthcare, Milwaukee, WI). Axial images with slice thickness 5 mm were acquired with T2-weighing (echo time [TE] 106 msec, repetition time [TR] 6,000 msec, 2 averages, field of view [FOV] 24 × 18 cm, matrix 256 × 224, slice thickness 5 mm) and fluid-attenuated inversion recovery (FLAIR) contrast (TE 161 msec, inversion time [TI] 2,473 msec, TR 9,897 msec, 1 average, FOV 24 × 24 cm, matrix 256 × 224, slice thickness 5 mm). DWI was performed using a single-shot echoplanar technique (TE 101 msec, TR 10,000 msec, 1 average, matrix 96 × 128, FOV 26 × 26 cm, slice thickness 5 mm) with diffusion-weighting factors (b values) of 0 and 1,000 s/mm2 applied sequentially along 3 orthogonal axes. Three-dimensional T1-weighted image data were acquired from 124 contiguous 1.5-mm-thick coronal slices (inversion-recovery prepared spoiled gradient-echo sequence; TE 5 msec, TR 35 msec, flip angle 35°, matrix 256 × 128, FOV 24 × 24 cm).
MRI analysis.
Conventional MRI.
The T2-weighted, FLAIR, and DWI images were reviewed independently by 2 consultant neuroradiologists. Pathologic signal changes were assessed in the caudate, putamen, and thalamus and in the cortex of the frontal, parietal, temporal, and occipital lobes. Where a discrepancy was identified, the images were re-reviewed in a consensus reading and a kappa statistic calculated to assess the level of agreement.
Quantitative MRI.
Postprocessing was performed at a dedicated workstation (Sun Microsystems, Mountain View, CA) by a single neuroradiologist blinded to the clinical and genetic data. Using commercially available software (Jim Version 4.0; Xinapse Systems Ltd., Thorpe Waterville, UK), pixel-by-pixel ADC maps were generated from b = 0 and b = 1,000 s/mm2 images using the Stejskal Tanner equation20 for ADC calculation. Following automatic segmentation of brain from nonbrain tissue using the brain extraction tool (BET), a part of the FSL 3.2 software,21 FAST segmentation was applied to the b = 0 images to classify each pixel as white matter (WM), gray matter (GM), or CSF. A mask was generated with each intracranial pixel classified as either GM or CSF and used to extract the appropriate pixels from the ADC map to create GM and whole brain (WB) ADC maps. To minimize contamination from CSF, a single morphologic erosion operation with a 3 × 3 pixel structuring element was applied to both the WB and GM ADC masks. The GM segment was too thin to support more than one erosion.
Normalized volumes of the entire brain parenchyma (NBV) were estimated from the T1-weighted volumetric image data using the SIENAX software,22 provided by FSL 3.2. Following extraction of separate brain and skull images from the single whole-head input data, the brain image is affine-registered to MNI152 space.23 Tissue-type segmentation with partial volume estimation is carried out24 in order to calculate NBV.
Histogram analysis.
A histogram generation algorithm was implemented to calculate the ADC frequency distribution for each segmented tissue fraction using 3 × 10⁻⁵ mm2/s bin widths. To adjust for intersubject variability in specific tissue volumes, the ADC histograms were normalized by dividing the number of counts in each sample bin by the total number of pixels for the respective tissue type. From each normalized histogram, the peak height (PH), peak location (PL), mean ADC, and ADC value of the 25th (p25), 50th (p50), and 75th (p75) percentiles were calculated (see figure 1A for examples of WB and GM ADC normalized histograms).

Figure 1 Whole brain and gray matter histograms in patients and controls
(A) Mean whole brain histograms in patients and controls. (B) Mean gray matter histograms in symptomatic patients and controls. ADC = apparent diffusion coefficient.
Region of interest analysis.
The mean ADCs in the head of the caudate nucleus, putamen, and pulvinar were determined bilaterally by manually drawing around each region on the axial b0 image at the level of the genu of the internal capsule using the DispImage software.25 The regions of interest (ROIs), ranging in size from 40–70 mm2, were transferred to the inherently coregistered ADC map (figure 2) and mean ADC recorded. To assess intraobserver variability, the ROI analysis in all 6 regions was repeated for 4 patient datasets in 2 sessions separated by 10 days. Bland-Altman analysis demonstrated a mean difference of −5.1 mm2/s (95% confidence interval [CI] = −13.75 to 3.55), p = 0.235. To assess interobserver variability, a second observer placed ROIs on the same 4 patients with a mean difference of 3.81 mm2/s (95% CI = −5.47 to 13.08), p = 0.40.
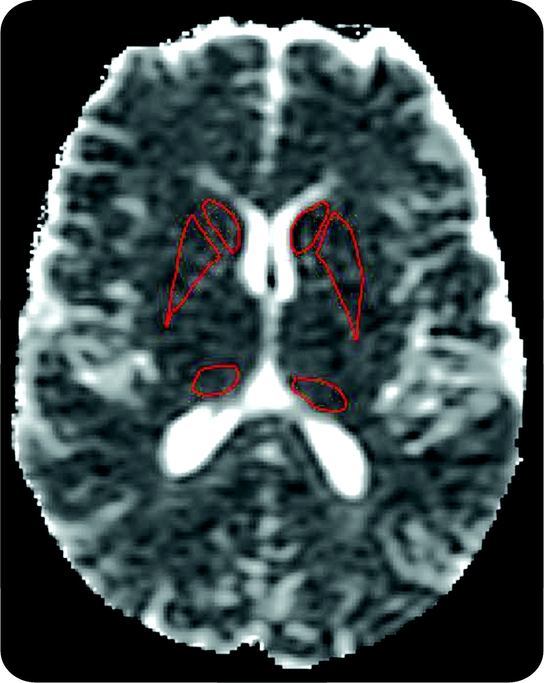
Figure 2 Positioning of the basal ganglia regions of interest (ROIs)
Apparent diffusion coefficient map demonstrating positions of the caudate, putamen, and pulvinar ROIs bilaterally.
Statistical analysis.
Age effects on ADC measures and NBV.
A preliminary Spearman rank bivariate correlation analysis across all the subjects (patients and controls) was performed considering age and disease duration vs NBV and all ADC measures, comprising for the ROIs: mean right head of caudate (RC) ADC, mean left head of caudate (LC) ADC, mean right putamen (RP) ADC, mean left putamen (LP) ADC, mean right pulvinar (RPu) ADC, mean left pulvinar (LPu) ADC; and for the WB and GM histograms: the PH, PL, mean ADC, p25, p50, and p75.
Comparison of ADC measures between control and patient groups.
Differences in ADC measures among controls, asymptomatic gene-positive subjects, and symptomatic subjects was performed using a Kruskal-Wallis analysis. Patients were considered symptomatic if they or a close informant had clinical and neuropsychiatric symptoms and asymptomatic if they or a close informant did not report any clinical or neuropsychiatric symptoms and a clinician thought that they were not affected on the basis of the clinical examination. Differences in ADC measures between the patients taking quinacrine and those not taking quinacrine were assessed using the Mann-Whitney U test.
Relationships between MRI measures and disease severity.
The relationship between MRI measures and clinical scores was assessed across the whole patient group (symptomatic and asymptomatic subjects) initially with Spearman rank correlation. To account for multiple comparisons of related variables, the significance value was set at p < 0.01 for each test. Standard normal linear regression models were then fitted with outcome the baseline clinical score, considering WB, GM, RC, LC, RP, LP, RPu, and LPu mean ADC, NBV, and age one at a time in a univariate analysis. Finally, a stepwise multivariate regression procedure was performed with each clinical score as the dependent variable and each of the MRI variables as the independent predictors. The aim of this model was to identify which of the baseline factors were independent predictors of baseline clinical score as opposed to potential confounders. All of the predictor variables were rank transformed to avoid violations of the assumption of a linear relationship.
RESULTS
Clinical findings.
PRNP genotyping revealed the following mutations in the patient group: 6 octapeptide repeat insertions (OPRI), n = 9; P102L, n = 7; D178N, n = 2; 5OPRI, n = 2; A117V, n = 2; Q212P, n = 1; E200K, n = 1; Y163X, n = 1. Nineteen of the patients were symptomatic at baseline with mean disease duration of 43.94 months (range 3–138 months). Six patients were gene positive but asymptomatic.
Conventional MRI appearances.
On initial assessment, there were discrepancies in 2 patients where DWI signal hyperintensity in the frontal cortex was noted in 1 patient and FLAIR signal hyperintensity in the perihabenular region noted in another patient (kappa score 0.835). On consensus review of these cases, no evidence of pathologic signal change was demonstrated.
Age effects on ADC indices and NBV.
There was no significant correlation between age or disease duration (for symptomatic patients only) and any of the MRI variables.
Comparison of ADC measures between controls and patient groups.
Mean age and MMSE were higher in the healthy control subjects than the symptomatic patients. For the WB and GM tissue fractions, the ADC histograms were shifted toward higher values in the symptomatic patient group compared to the healthy control subjects (figure 1, A and B). The strongest differences between groups were for the WB mean ADC (p = 0.006), WB median ADC (p = 0.008), and GM mean ADC (p = 0.024). No significant differences in any MRI measures comparing controls and asymptomatic patients were detected (table). Bilateral ROI ADCs were considered separately since a Wilcoxon test revealed a significant right ROI vs left ROI difference for the putamen (p = 0.002) and pulvinar (p = 0.009) ROIs in the patient group. Comparison of age, NBV, and ADC metrics between patients taking quinacrine and those not taking quinacrine revealed no significant differences in any of the measures.
Table Mean baseline ADC indices in patients and healthy control subjects

Relationships between MRI measures and disease severity.
We found a number of significant associations suggesting that ADC increases and NBV decreases with worsening disease severity. The strongest associations were between GM mean ADC and MMSE (p < 0.0001) (figure 3A), ADAS-Cog (p < 0.0001) (figure 3B), CDR (p < 0.0001) (figure 3C), and CGIS (p < 0.0001) (figure 3D). WB mean ADC correlated with MMSE (p = 0.006; figure 3E) and less strongly with ADAS-Cog and CDR. NBV was strongly associated with MMSE (p = 0.001) (figure 3F) and CDR (p = 0.001). For the ROI analysis, mean ADCs also increased with disease severity (figure 4). The strongest associations were between RPu mean ADC and ADAS-Cog (p < 0.0001), MMSE (p = 0.001), and CGIS (p = 0.001), and LPu mean ADC with CGIS (p = 0.003).

Figure 3 Significant correlations between MRI histogram measures and clinical scores
Scatterplots of (A) gray matter mean apparent diffusion coefficient (ADC) and Mini-Mental State Examination (MMSE), (B) gray matter mean ADC and Alzheimer's Disease Assessment Scale–Cognitive subscale (ADAS-Cog), (C) gray matter mean ADC and Clinician's Dementia Rating Scale (CDR), (D) gray matter mean ADC and Clinician's Global Impression of Disease (CGIS), (E) whole brain mean ADC and MMSE, (F) normalized brain volume and MMSE.

Figure 4 Significant correlations between mean region of interest (ROI) apparent diffusion coefficient (ADC) and clinical scores
Scatterplots of (A) right and (B) left pulvinar ROI mean ADC and Clinician's Global Impression of Disease.
Using the stepwise multivariate regression procedure with each clinical score as the dependent variable and each of the MRI variables that correlated significantly in the univariate analysis (including NBV) as the independent predictors, GM mean ADC was an independent predictor of CDR (p = 0.001), Rankin score (p = 0.02), and Barthel ADL score (p = 0.009). Right pulvinar mean ADC was an independent predictor of ADAS-Cog (p = 0.001) and CGIS (p = 0.001). For MMSE, GM mean ADC was the final factor in the model but failed to reach significance (p = 0.074).
DISCUSSION
This study quantifies cerebral ADC in a cohort of patients with inherited prion diseases. We have demonstrated significantly higher WB and GM mean ADCs in a symptomatic patient population compared to a healthy control group. ADC measures from both the WB and GM tissue fractions and pulvinar ROIs increased with disease severity while brain volume decreased with disease severity. Although we cannot generalize to inherited prion diseases as a whole, our results suggest that tissue damage in patients with inherited prion diseases with this subset of mutations is associated with increased diffusivity in the WB, GM, and pulvinar.
Our observations of elevated ADC are surprising when compared to generally reported findings in this disease but are in accordance with reports in other neurodegenerative diseases. Most of the studies that have quantified cerebral ADC in prion diseases have been performed in sCJD or in the E200K mutation, which is histopathologically most similar to the MM subtype of sCJD,26 and have shown decreased cerebral ADC measurements in the basal ganglia,27,28 thought to correspond to spongiform degeneration.29 However, in one study, of 4 symptomatic patients with the E200K mutation, although mean ADC was lower in the putamen and caudate compared to controls,9 ADC was increased in multiple cortical and cerebellar regions. In a second study, increased ADC values were noted in the thalamus, in a patient with the D178N mutation, corresponding to increased thalamic gliosis on pathologic examination.10 Elevated ADC in the pulvinar has been noted in vCJD, also corresponding to gliosis on pathologic examination,30 and a study investigating longitudinal ADC changes in sCJD found elevation of ADC in the thalamus over time.30
The hallmark of all forms of inherited prion diseases is spongiform degeneration of neurons and their processes, neuronal loss, and intense reactive astrocytosis.31 The histopathology is known to change with disease progression such that complete loss of neurons in the terminal stages of disease leads to a reduction in spongiosis due to loss of the cells exhibiting vacuoles.32 Our findings of increased ADC measurements with disease severity may reflect these histopathologic changes at the terminal stages of the disease: a combination of decreased spongiosis, increased neuronal loss, and increased gliosis. Another possibility is that with increased disease severity, status spongiosis may occur, where small vacuoles coalesce to form larger vacuoles, leading to increased diffusion. The stronger association of the gray matter ADC measures with disease severity reflects the known diffuse nature and GM anatomic distribution of histopathologic changes.31
Our findings are in accordance with those seen in other neurodegenerative disorders, where WB or regional ADC values are usually increased in association with clinical or subclinical disease, consistent with our findings. WB and caudate ADCs in patients with Huntingdon disease are increased and rise with disease progression33 and in patients with amnestic mild cognitive impairment or Alzheimer disease WB and hippocampal ADCs have been shown to be higher than in controls.34,35 This increase in diffusivity is thought to be associated with loss of neuron cell bodies, synapses, and dendrites, which cause an expansion of the extracellular space where water diffusivity is fastest.36
The decrease in NBV and disease severity supports the observation that progressive cerebral atrophy is a feature of inherited prion diseases.37,38 It is known that partial volume edge effects can influence segmented brain tissue fraction diffusion histogram measures,39 and it is a concern that cerebral atrophy may modulate this effect. This might indirectly contribute to the observed increase in WB and tissue fraction ADC with disease severity. We attempted to minimize partial volume effects in this study by applying a single morphologic erosion operation to both the WB and GM ADC masks. Since in the univariate analysis, the GM ADC measures provided stronger correlations with clinical scores than NBV, and because the stepwise multivariate analysis suggested that NBV did not contribute additional predictive power to the linear model, we believe that cerebral ADC, and in particular GM ADC histogram metrics, provide a highly sensitive index of pathology in inherited prion diseases, essentially independent of, although possibly complementary to, quantifiable changes in brain volume.
The relatively small number of controls with a slightly higher mean age than that of our patient group is a limitation of our study. However, even considering the expected increase in regional and whole brain ADC with age, we were still able to find significant differences between symptomatic patients and controls, although any small increases in diffusivity in our asymptomatic gene-positive group may have been masked.
It is also possible that the changes in ADC observed were influenced to an unknown extent by the effects of the drug quinacrine. Since we have recently shown that quinacrine does not significantly affect mortality in prion diseases12 and we saw no significant differences in ADC measures between patients taking quinacrine and those not taking quinacrine, it is unlikely that taking quinacrine is a confound at the level of sensitivity of our study. Future longitudinal studies in a larger cohort of affected patients not undergoing treatment will be required to confirm the sensitivity of cerebral ADC changes specifically to the prion disease process.
Conventional MRI findings in inherited prion diseases report cortical atrophy, cerebellar atrophy, or increased T2 signal in the basal ganglia.32,36 In the EUROCJD experience with data on 23 specified PRNP mutations, conventional MRI scans were only positive in 50% of E200K mutations, 30% of Gerstmann-Sträussler-Scheinker syndrome, and 18% of fatal familial insomniacases,40 although few FLAIR and DWI sequences were used. In our study, conventional MRI, including visual assessment of DWI, was relatively insensitive to cerebral pathology in these patients. Despite this, we have shown that quantification of cerebral ADC provides both regional and global measures that correlate with clinical neurologic status and may therefore be useful markers in future therapeutic trials in patients with inherited prion diseases.
ACKNOWLEDGMENT
The authors thank the patients and relatives for taking part in this study, and the Dementia Research Group, National Hospital for Neurology and Neurosurgery, London, UK, for providing healthy volunteers. Statistical analysis was performed in conjunction with Dr. Sarah Walker, Statistician, MRC Clinical Trials Unit.
DISCLOSURE
Dr. Wroe and Dr. Siddique report no disclosures. Dr. Webb received an MRC Research Fellowship. Dr. Fox has served on scientific advisory boards for the Alzheimer's Research Forum, GE Healthcare, and Elan Corporation, and editorial boards of Alzheimer's Disease and Associated Disorders, Neurodegenerative Diseases, and BioMed Central–Alzheimer's Research and Therapy; may accrue revenue on Patent PCT/GB2008/001537 (issued: 04/05/2007): QA Box; has received honoraria from GE Healthcare and Lancet Neurology (reviewer fee); has served as a consultant to Eli Lilly and Company, Abbott, and Lundbeck Inc.; has received research support (to the Dementia Research Centre) from Elan Corporation, Wyeth, Lundbeck Inc., Sanofi-Aventis, IXICO Ltd., Pfizer Inc., and Neurochem Inc.; and receives research support from the MRC, the NIHR (Senior Investigator Award), the NIH (U01 AG024904 [Co-I]), and the Alzheimer Research Trust. Dr. Stevens reports no disclosures. Prof. Collinge serves on the editorial boards of Neurobiology of Disease (charter member), the Journal of Neurovirology, and Neurogenetics; has received speaker honoraria from GlaxoSmithKline; is a director and shareholder of D-Gen Ltd., an academic spin-out company working in the field of prion disease diagnosis, decontamination, and therapeutics; and receives research support from the Department of Health England, Medical Research Council, UK, the European Union, and Wellcome Trust. Dr. Yousry serves on a scientific advisory board for UCB S.A.; serves as a consultant for Biogen Idec and GlaxoSmithKline; and serves on the editorial board of European Radiology. Dr. Thornton reports no disclosures.
Address correspondence and reprint requests to Dr. Harpreet Hyare, National Prion Clinic, Box 98, National Hospital for Neurology and Neurosurgery, Queen Square, London, UK, WC1N 3BG harpreet.hyare@uclh.nhs.uk
Study funding: Supported by the Medical Research Council, UK.
Disclosure: Author disclosures are provided at the end of the article.
Received March 2, 2009. Accepted in final form November 24, 2009.
REFERENCES
- 1.Collinge J. Human prion diseases: aetiology and clinical features. In: Growdon JH, Rossor M, eds. The Dementias. Newton, MA: Butterworth-Heinemann; 1998:113–148. [Google Scholar]
- 2.Mallucci G, Collinge J. Update on Creutzfeldt-Jakob disease. Curr Opin Neurol 2004;17:641–647. [DOI] [PubMed] [Google Scholar]
- 3.Wroe SJ, Pal S, Siddique D, et al. Clinical and pre-mortem diagnosis of variant Creutzfeldt-Jakob disease associated with blood transfusion. Lancet 2006;368:2061–2067. [DOI] [PubMed] [Google Scholar]
- 4.Tschampa HJ, Kallenberg K, Urbach H, et al. MRI in the diagnosis of sporadic Creutzfeldt-Jakob disease: a study on inter-observer agreement. Brain 2005;128:2026–2033. [DOI] [PubMed] [Google Scholar]
- 5.Young GS, Geschwind MD, Fischbein NJ, et al. Diffusion-weighted and fluid-attenuated inversion recovery imaging in Creutzfeldt-Jakob disease: high sensitivity and specificity for diagnosis. AJNR Am J Neuroradiol 2005;26:1551–1562. [PMC free article] [PubMed] [Google Scholar]
- 6.Tschampa HJ, Kallenberg K, Kretzschmar HA, et al. Pattern of cortical changes in sporadic Creutzfeldt-Jakob disease. AJNR Am J Neuroradiol 2007;28:1114–1118. [DOI] [PMC free article] [PubMed] [Google Scholar]
- 7.Lin YR, Young GS, Chen NK, Dillon WP, Wong S. Creutzfeldt-Jakob disease involvement of rolandic cortex: a quantitative apparent diffusion coefficient evaluation. AJNR Am J Neuroradiol 2006;27:1755–1759. [PMC free article] [PubMed] [Google Scholar]
- 8.Tschampa HJ, Murtz P, Flacke S, Paus S, Schild HH, Urbach H. Thalamic involvement in sporadic Creutzfeldt-Jakob disease: a diffusion-weighted MR imaging study. AJNR Am J Neuroradiol 2003;24:908–915. [PMC free article] [PubMed] [Google Scholar]
- 9.Fulbright RK, Kingsley PB, Guo X, et al. The imaging appearance of Creutzfeldt-Jakob disease caused by the E200K mutation. Magn Reson Imaging 2006;24:1121–1129. [DOI] [PubMed] [Google Scholar]
- 10.Haik S, Galanaud D, Lingaru MG, et al. In vivo detection of thalamic gliosis. Neurology 2008;65:545–549. [DOI] [PubMed] [Google Scholar]
- 11.Lee H, Rosenman H, Chapman J, et al. Thalamo-striatal diffusion reductions precede disease onset in prion mutation carriers. Brain Epub 2009 Mar 24. Abstract. [DOI] [PMC free article] [PubMed]
- 12.Collinge J, Gorham M, Hudson F, et al. Safety and efficacy of quinacrine in human prion disease (PRION-1 study): a patient-preference trial. Lancet Neurol 2009;8:334–344. Abstract. [DOI] [PMC free article] [PubMed]
- 13.Folstein MF, Folstein SE, McHugh PR. “Mini-mental state”: a practical method for grading the cognitive state of patients for the clinician. J Psychiatr Res 1975;12:189–198. [DOI] [PubMed] [Google Scholar]
- 14.Morris JC. Clinical dementia rating: a reliable and valid diagnostic and staging measure for dementia of the Alzheimer type. Int Psychogeriatr 1997;9 suppl 1:173–176. [DOI] [PubMed] [Google Scholar]
- 15.Rankin J. Cerebral vascular accidents in patients over the age of 60. Scott Med J 1957;2:200–215. [DOI] [PubMed] [Google Scholar]
- 16.Rosen WG, Mohs RC, Davis KL. A new rating scale for Alzheimer's disease. Am J Psychiatry 1984;4:1356–1364. [DOI] [PubMed] [Google Scholar]
- 17.Collin C, Wade DT, Horne V, et al. The Barthel ADL Index: a reliability study. Int Disabil Stud 1988;10:61–63. [DOI] [PubMed] [Google Scholar]
- 18.Guy W. Clinical Global Impressions (CGI). In: Guy W, ed. ECDEU Assessment Manual for Psychopharmacology. Rockville, MD: US Department of Health and Human Services, Public Health Service, Alcohol Drug Abuse and Mental Health Administration, NIMH Psychopharmacology Research Branch; 1976:218–222. [Google Scholar]
- 19.Overall JE, Gorham DR. The Brief Psychiatric Rating Scale. Psychol Rep 1962;10:799–812. [Google Scholar]
- 20.Stejskal EO, Tanner JE. Spin diffusion measurements: spin echoes in the presence of a time dependent field gradient. J Chem Phys 1965;42:288–292. [Google Scholar]
- 21.Smith SM. Fast robust automated brain extraction. Hum Brain Mapp 2002;17:143–155. [DOI] [PMC free article] [PubMed] [Google Scholar]
- 22.Smith SM, De Stefano N, Jenkinson M, Matthews PM. Normalised accurate measurement of longitudinal brain change. J Comput Assist Tomogr 2001;25:466–475. [DOI] [PubMed] [Google Scholar]
- 23.Jenkinson M, Smith SM. A global optimisation method for robust affine registration of brain images. Med Image Anal 2001;5:143–156. [DOI] [PubMed] [Google Scholar]
- 24.Zhang Y, Brady M, Smith S. Segmentation of brain MR images through a hidden Markov random field model and the expectation maximization algorithm. IEEE Trans Med Imaging 2001;20:45–57. [DOI] [PubMed] [Google Scholar]
- 25.Plummer D. DispImage: a display and analysis tool for medical images. Rivista Neurologica 1992;5:489–495. Abstract.
- 26.DeArmond SJ, Bouzamondo E. Fundamentals of prion biology and diseases. Toxicology 2002;181–182:9–16. [DOI] [PubMed] [Google Scholar]
- 27.Tschampa HJ, Murtz P, Flacke S, Paus S, Schild HH, Urbach H. Thalamic involvement in sporadic Creutzfeldt-Jakob disease: a diffusion-weighted MR imaging study. AJNR Am J Neuroradiol 2003;24:908–915. [PMC free article] [PubMed] [Google Scholar]
- 28.Nitrini R, Mendonça RA, Huang N, LeBlanc A, Livramento JA, Marie SK. Diffusion-weighted MRI in two cases of familial Creutzfeldt-Jakob disease. J Neurol Sci 2001;184:163–167. [DOI] [PubMed] [Google Scholar]
- 29.Manners DN, Parchi P, Tonon C, et al. Pathologic correlates of diffusion MRI changes in Creutzfeldt-Jakob disease. Neurology 2009;72:1425–1431. Abstract. [DOI] [PubMed]
- 30.Oppenheim C, Brandel JP, Hauw JJ, Deslys JP, Fontaine B. MRI and the second French case of vCJD. Lancet 2000;356:253–254. [DOI] [PubMed] [Google Scholar]
- 31.DeArmond S, Kretschmer V, Prusiner DB. Prion diseases. In: Graham D, Lantos P, eds. Greenfield's Neuropathology. Hodder Arnold; 2002:273–323. [Google Scholar]
- 32.Brandner S, Isenmann S, Kühne G, Aguzzi A. Identification of the end stage of scrapie using infected neural grafts. Brain Pathol 1998;8:19–27. [DOI] [PMC free article] [PubMed] [Google Scholar]
- 33.Masalchi M, Lolli F, Nave RD, et al. Huntington disease: volumetric, diffusion-weighted, and magnetization transfer MR imaging of brain. Radiology 2004;232:867–873. [DOI] [PubMed] [Google Scholar]
- 34.Bozzali M, Franceschi M, Falini A, et al. Quantification of tissue damage in AD using diffusion tensor and magnetization transfer MRI. Neurology 2001;57:1135–1137. [DOI] [PubMed] [Google Scholar]
- 35.Kantarci K, Jack CR, Xu YC, et al. Regional diffusivity of water in mild cognitive impairment and Alzheimer's disease. Radiology 2001;219:101–107. [DOI] [PMC free article] [PubMed] [Google Scholar]
- 36.Kantarci K, Petersen C, Boeve BF, et al. DWI predicts future progression to Alzheimer disease in amnestic mild cognitive impairment. Neurology 2006;64:902–904. [DOI] [PMC free article] [PubMed] [Google Scholar]
- 37.Wimberger D, Uranitsch K, Schindler E, Kramer J. Gerstmann-Sträussler-Scheinker syndrome: MR findings. J Comput Assist Tomogr 1993;17:326–327. [DOI] [PubMed] [Google Scholar]
- 38.Montagna P, Cortelli P, Avoni P, et al. Clinical features of fatal familial insomnia: phenotypic variability in relation to a polymorphism at codon 129 of the prion protein gene. Brain Pathol 1998;8:515–520. [DOI] [PMC free article] [PubMed] [Google Scholar]
- 39.Rashid W, Hadjiprocopis A, Griffin C, et al. Diffusion tensor imaging of early relapsing-remitting multiple sclerosis with histogram analysis using automated segmentation and brain volume correction. Mult Scler 2004;10:9–15. [DOI] [PubMed] [Google Scholar]
- 40.Kovacs GG, Puopolo M, Ladogana A, et al. Genetic prion disease: the EUROCJD experience. Hum Genet 2005;118:166–174. [DOI] [PubMed] [Google Scholar]