

SUMMARY
Degraded sensory experience during critical periods of development can have adverse effects on brain function. In the auditory system, conductive hearing loss associated with childhood ear infections can produce long-lasting deficits in auditory perceptual acuity, much like amblyopia in the visual system. Here we explore the neural mechanisms that may underlie “amblyaudio” by inducing reversible monaural deprivation (MD) in infant, juvenile and adult rats. MD distorted tonotopic maps, weakened the deprived ear’s representation, strengthened the open ear’s representation and disrupted binaural integration of interaural level differences (ILD). Bidirectional plasticity effects were strictly governed by critical periods, were more strongly expressed in primary auditory cortex than inferior colliculus, and directly impacted neural coding accuracy. These findings highlight a remarkable degree of competitive plasticity between aural representations and suggest that the enduring perceptual sequelae of childhood hearing loss might be traced to maladaptive plasticity during critical periods of auditory cortex development.
INTRODUCTION
Beginning in infancy and extending well into adulthood, the functional architecture of key auditory brain regions is sculpted by statistical patterns within the acoustic environment and learned associations between sounds and their behavioral consequences (for recent reviews see Dahmen and King, 2007; Keuroghlian and Knudsen, 2007; Sanes and Bao, 2009; Tzounopoulos and Kraus, 2009). Much like the developing central visual and somatosensory systems, the role of experience in auditory system development is typically studied by manipulating sensory inputs during discrete windows of postnatal life and then studying the associated effects on the receptive field organization in the central auditory pathways. Unlike the retina or skin, the cochlea is not under voluntary motor control. Therefore, it is relatively easy to bathe young animals in spatially (i.e. spectrally) stereotyped sound environments, whereas continuously stimulating a restricted skin region or projecting a particular pattern of visual stimuli onto a fixed point of the retina of developing animals is not trivial. Auditory researchers have capitalized on this advantage by cataloguing a broad spectrum of cortical and collicular receptive field reorganization following passive developmental exposure to stimuli such as continuous broadband sound (Chang and Merzenich, 2003), temporally modulated broadband sound (Sanes and Constantine-Paton, 1985; Zhang et al., 2002), continuous narrowband sound (Poon and Chen, 1992; Zhou et al., 2008), temporally modulated narrowband sound (de Villers-Sidani et al., 2007; Yu et al., 2007; Zhang et al., 2001) frequency modulated sound (Insanally et al., 2009), or generally complex sound (Engineer et al., 2004).
Whereas the visual and somatosensory systems do not readily lend themselves to passive stimulation protocols, thousands of published studies underscore the relative ease of implementing innocuous and reversible sensory deprivation protocols such as eyelid suture or whisker trimming. The analogous manipulation in the auditory system is not easily accomplished, as the typical methods for the blockade of airborne sound in young animals (e.g. foam ear plugs or malleus removal) are either complete or reversible, but usually not both. Despite technical difficulties, there is a strong clinical motivation to develop animal models for the effects of early auditory deprivation on the brain, as childhood conductive hearing loss (CHL) stemming from disorders such as otitis media with effusion is the most commonly diagnosed illness among children in the United States (Lanphear et al., 1997; Schappert, 1992). Furthermore, severe and chronic otitis media in early childhood has been repeatedly associated with binaural hearing deficits that endure for years after peripheral hearing has returned to normal (Hogan and Moore, 2003; Moore et al., 1991; Pillsbury et al., 1991).
The persistence of auditory perceptual deficits after the ear is audiometrically normal is akin to poor vision through the “lazy”, but structurally normal eye in amblyopia patients. Like the etiology of amblyopia, the source for “amblyaudio” (from the Greek, amblyos – blunt; audio – hearing), may also stem from maladaptive plasticity in the central auditory system during developmental critical periods. In fact, CHL has been associated with a host of changes in subcortical auditory nuclei including alterations in metabolic activity (Tucci et al., 1999), protein synthesis (Hutson et al., 2007), stimulus-evoked spike rates (Mogdans and Knudsen, 1993; Silverman and Clopton, 1977; Sumner et al., 2005), and even cell morphology (Gray et al., 1982; Smith et al., 1983). A history of CHL has also been linked to alterations in temporal dynamics (Xu et al., 2007) and synaptic plasticity (Xu et al., 2010) in the auditory thalamocortical brain slice preparation. Moreover, a history of CHL in animals has been associated with behavioral deficits such as reduced binaural masking level difference thresholds (Moore et al., 1999) and impaired azimuthal sound localization (Clements and Kelly, 1978) in a similar fashion to individuals with a history of persistent and severe otitis media in childhood. Most recently, a series of elegant studies have shown that the progressive recalibration of sound localization accuracy following unilateral CHL is critically dependent upon the auditory cortex and its descending projections to lower auditory areas (Bajo et al., 2010; Kacelnik et al., 2006; Nodal et al., 2009).
Despite these advances in understanding the central auditory sequelae of developmental CHL, several fundamental questions remain before this class of study can be reconciled with the corpus of work describing the effects of sensory deprivation in the visual and somatosensory cortex and with the developmental sound exposure literature: I) How does a history of severe, yet reversible, CHL affect the receptive field organization of the auditory cortex? II) Unlike binocular selectivity in primary visual cortex (V1), binaural tuning first appears in subcortical auditory nuclei. Therefore, what aspects of auditory cortex reorganization are inherently cortical and what can be explained by plasticity at lower levels of the auditory system? III) Are these central plasticity effects governed by developmental critical periods? IV) How does experience-dependent reorganization relate to changes in the encoding accuracy for auditory stimuli? We address these questions by implementing a method for monaural deprivation (MD) through reversible unilateral ear canal ligation and then characterize its effects on the auditory brainstem response (ABR), tonotopic organization of topographic maps, tonal receptive fields, and binaural integration in the primary auditory cortex (AI) and central nucleus of the inferior colliculus (ICc). We find that MD induces a multifaceted reorganizational response across midbrain and cortical circuits, each of which is subject to unique developmental, hierarchical and topographic regulation. Subsequent application of a peri-stimulus time histogram (PSTH)-based classifier model suggests that these plasticity effects have clear implications for encoding basic attributes of sounds delivered to the developmentally ligated and open ears. The hierarchical and developmental regulation of this competitive plasticity reveals several fundamental similarities, as well as several intriguing differences, with the literature describing developmental plasticity in other sensory modalities.
RESULTS
Monaural Deprivation is Reversible, Stable and Low-Pass
As the principle interest of this study was to better understand how a history of prolonged MD affected auditory stimulus representations in midbrain and forebrain circuits, it was essential that the CHL achieved through ear canal ligation be reversible, otherwise it would be impossible to determine whether degraded auditory signal processing reflected central auditory reorganization or could simply be attributed to ongoing peripheral hearing loss. To disambiguate between these two possibilities and to better understand the nature of the CHL achieved through ear canal ligation, we measured frequency-dependent ABR thresholds without, during and after ear canal ligation (Fig. 1a). Comparison of ABR threshold differences between the ligated and normal ears revealed a gradually sloping high frequency hearing loss (~ 11 dB/octave) that was qualitatively similar immediately following ligation, as it was immediately prior to ligation removal 60 days later (Fig 1a, dotted and solid gray lines, respectively). ABR threshold differences measured within 60 minutes following ligation removal showed substantial recovery of auditory sensitivity, such that threshold differences in MD rats were similar to sham rats for all but the two highest frequencies tested (Fig 1a, black vs. unfilled symbols).
Figure 1. Reversible, stable and low-pass CHL.

ABR measurements were made either in a free field (gray data points) or closed field (black and open data points) based on tone burst response threshold (A) or click-evoked response amplitudes (B an C). In all cases, comparisons are made between ligated vs. open ear (MD) or right vs. left ear (sham). (A) Threshold differences are calculated as (ligated – open) or (right – left) for MD and sham rats, respectively. (B) Waves Ia, I and II are identified from the composite ABR waveforms evoked by an 80 dB SPL click. (C) Mean amplitudes of waves Ia (circles), I (squares) and II (triangles) are compared between the ligated vs. open (MD) or left vs. right ears (sham) with the ligation in place (gray), following ligation removal (black) or in sham rats (open). Points in the gray shaded region reflect hearing loss.
As a next step, we carried out a more thorough analysis of ABR waveforms in every rat to examine CHL reversal prior to unit recordings and to shed additional light on the mechanisms underlying the small amount of persistent high frequency hearing loss. We elected to use click stimuli, as clicks preferentially activate basal, high frequency regions of the cochlea that were the most suspect for non-reversible hearing loss (Eggermont and Don, 1980) and also because the individual waves of the click-ABR could be easily identified, permitting an analysis of recovery based on peripheral versus central generators of the gross electrical potential. We also chose to focus on ABR wave amplitude, rather than traditional threshold measurements, as it has been shown to be a more sensitive index of hearing loss (Kujawa and Liberman, 2009).
Comparison of representative 80 dB click-evoked ABR waveforms demonstrated that responses from the ligated ear were almost completely restored following ligation removal (Fig. 1b). Quantitative analysis of waves Ia, I and II, which are known to be generated by the inner hair cells, spiral ganglion cells and cochlear nucleus globular cells, respectively (Davis-Gunter et al., 2001; Melcher and Kiang, 1996) revealed a significant attenuation in response strength for all three peaks with the ligation present relative to the open ear (one-tailed paired t-tests, p < 0.1; Fig. 1c gray points). Following ligation removal, waves Ia and I amplitudes were immediately restored to equivalence with the open ear so as to overlap with sham data points, suggesting that peripheral hearing loss had been completely reversed (Fig, 1c, black vs. unfilled circles and squares, one-tailed paired t-tests p > 0.1 for each). Wave II response amplitudes continued to exhibit significant attenuation (Fig. 1c, black triangle, p < 0.001). These data suggest that residual high frequency ABR threshold shifts likely stemmed from changes in central auditory neurons, as only wave II failed to recover.
Three Facets of AI Reorganization following Monaural Deprivation
The ABR data motivated two hypotheses related to central auditory plasticity: I) the relative sparing of frequencies less than 4 kHz through the ligation (the cutoff point in the frequency transfer function) will confer a competitive advantage to – and tonotopic overrepresentation of – neurons with characteristic frequency (CF) tuning less than 4 kHz in the contralateral hemisphere; II) the non-reversible attenuation of wave II peak amplitude will manifest as an overall loss of neural responsiveness to stimuli presented to the developmentally ligated ear. To test these hypotheses, tonal receptive fields and their coordinated arrangement into tonotopic maps were measured in AI for stimuli presented to the contralateral (developmentally ligated) and ipsilateral (developmentally open) ears. Representative maps are shown from two rats that either underwent MD or a sham surgery on postnatal day 14 (2wks), the day when the ear canal fully opens in rats (Fig. 2). Comparison of the MD and sham maps supported both of these hypotheses, as the area of the contralateral CF map tuned to frequencies less than 4 kHz was enlarged and several positions within the MD map had no discernable tuning. We also observed a third reorganizational component, a remarkable enhancement of tonotopically organized ipsilateral receptive fields, which were normally incomplete in AI of the normal rat. These three observations raised two questions that are addressed in the following sections: I) To what extent do these three facets of AI plasticity reflect subcortical reorganization? II) Does the age at which MD begins affect the expression of plasticity?
Figure 2. Reorganization of contralateral and ipsilateral CF maps following MD in early life.
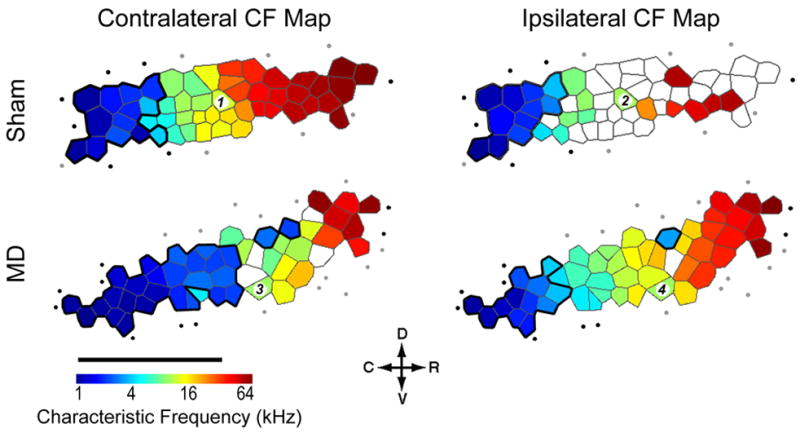
Representative CF maps derived from stimuli presented to the contralateral/ligated (left column) and ipsilateral/open (right column) ear in a sham (top row) and MD (bottom row) rat. Tonotopy is represented using a Voronoi tessellation, in which each polygon represents a single electrode penetration, the color of each polygon represents the CF for that site and the area of the polygon is proportional to the spacing between electrode penetrations. Recording sites with CFs < 4 kHz are enclosed with a bold black line to highlight sound frequencies that can more readily pass through the ear canal ligation. Unfilled polygons represent sites that were not responsive or poorly tuned to either contralateral or ipsilateral inputs. Filled circles = non-AI recording site, open circles = recording site unresponsive to either ear, D = dorsal, C = caudal, R = rostral, V = ventral, scale bar = 1 mm. Recording sites 1–4 yielded the FRAs shown in Fig 4.
Developmental and Hierarchical Restrictions on Tonotopic Map Plasticity
Contralateral CF gradients were analyzed in AI and ICc of rats ligated at 2wks, 4wks or adulthood. Both AI and ICc displayed a well-organized low-to-high CF gradient that ran either caudal-to-rostral or dorsal-to-ventral, respectively (Fig. 3a). In order to directly compare cortical and collicular maps, CF functions were fit with a polynomial and the position along the tonotopic axis at which the fit line crossed 4 kHz was defined as the boundary of the low frequency map region. In AI of sham rats, an average of 33 ± 0.02 % of the map was allocated to CFs less than 4 kHz (Fig. 3b). In MD rats ligated at 2wks, the low frequency map region expanded to 47± 0.03% (p < 0.05). This low frequency expansion occurred without a change in the overall AI map length, demonstrating a bona fide reallocation of preferred frequency (2.0 ± 0.11 vs. 2.3 ± 0.26 mm for sham vs. MD, respectively; p > 0.05). Significant differences in the low frequency map area were not observed in AI when ligation was performed at 4wks or adulthood and were not observed at any age in the ICc (Fig. 3c) (p > 0.05 for all comparisons).
Figure 3. A critical period for tonotopic map distortion.
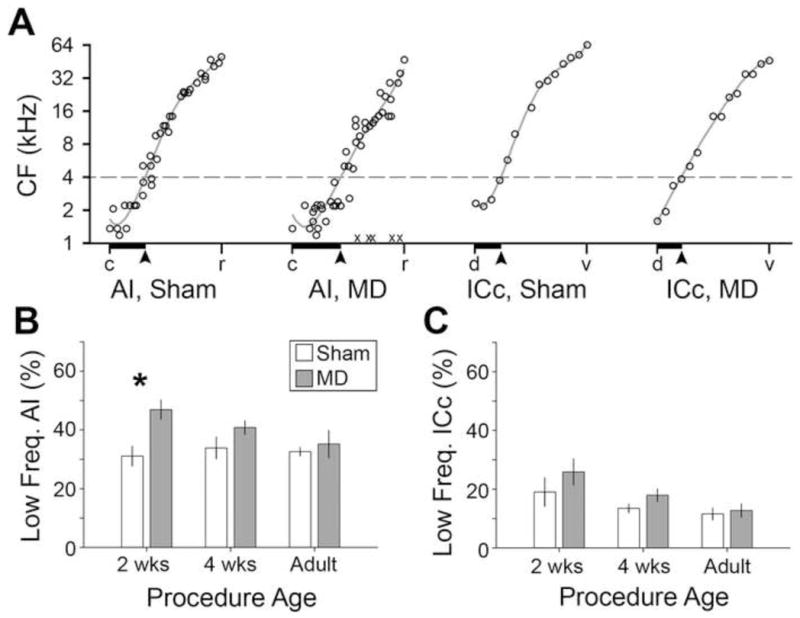
(A) CFs are plotted according to their normalized position along the tonotopic axis of AI or ICc maps and fit with a polynomial function (solid line). The point at which CF fit function crosses 4 kHz (broken line) is matched up with the tonotopic position at that point (solid arrow) and the cumulative percentage is defined as the low frequency map area (solid horizontal bars). (B an C) Mean low frequency map areas in AI (B) and ICc (C) in MD- (open bars) or sham-operated rats (shaded bars) are shown according to the age when the procedure was performed. Asterisk denotes significant difference with an unpaired t-test (p < 0.05). c = caudal, r = rostral, d = dorsal, v = ventral.
Experience-Dependent Shifts in Aural Dominance
Changes in the relative strength of contralateral and ipsilateral tuning were compared directly through an analysis of aural dominance. Contralateral and ipsilateral frequency response areas (FRAs) were delineated at each recording site and the firing rate for every individual frequency-intensity stimulus combination within the union of the two FRAs was assigned a 1, −1 or 0 depending on whether the spike count for that particular tone was greater for the contralateral ear, ipsilateral ear or was equivalent between the two ears, respectively (Fig. 4a). Individual data points were then averaged and categorically binned on a scale from 1 to 7, where category 1 scores represented complete contralateral dominance, category 4 scores for matched binaural receptive field strength and category 7 indicated complete ipsilateral dominance, in keeping with the traditional method of describing the effects of monocular deprivation in V1.
Figure 4. Bi-directional changes in contralateral and ipsilateral input efficacy underlie reorganization of aural dominance.

(A) FRAs derived from tones presented to the contralateral (left column) and ipsilateral (middle column) ears from a single sham (top row) and MD (bottom row) recording site from the CF maps shown in Fig. 2. Spike rates (spikes/sec) for each individual frequency-level combination were compared directly between contralateral and ipsilateral FRAs. Right column: Individual frequency-level combinations were assigned a numeric indicator to reflect contralateral dominance (1, white), ipsilateral dominance (−1, black) or bilateral equivalence (0, gray) in spike rate. (B and C) Mean aural dominance index for each recording site was divided into 7 categories reflecting the spectrum between complete contralateral dominance to complete ipsilateral dominance (1 to 7, respectively). Distributions of aural dominance scores across the entire sample of recordings sites in sham (red) and MD (gray) recordings are shown for AI (B) and ICc (C) for each age group. P values reflect outcome of Kolmogorov-Smirnov tests. (D and E) Average z scores from onset latency, minimum response threshold and receptive field continuity distributions. Higher z scores reflect more efficacious inputs. Data are shown from responses evoked by contra/ligated and ipsilateral/open (ipsi)ears in 2wks (2), 4wks (4) and adult (A) rats from sham (red) and MD (gray) AI (D) and ICc (E) recordings. Asterisks = p < 0.05 with unpaired t-test, N.S. = not significant. See also Figures S1, S2 and S3.
As reflected in the example tuning curves from the 2wk sham rat, contralateral FRAs were normally more complete and had lower thresholds than ipsilateral FRAs (Fig. 4a). This relationship was reversed in the 2wk MD rat example, in which the ipsilateral FRA, corresponding to the developmentally unobstructed ear, was more complete and the contralateral FRA was comparatively degraded. Looking at the distribution of aural dominance scores from AI recordings, one can observe a leftward skewness in 2wk, 4wk and adult sham distributions, indicating a clear contralateral bias at all ages (Fig. 4b). By contrast to sham recordings, MD aural dominance distributions in AI were shifted to the right, indicating a preponderance of recording sites with matched and ipsilaterally dominant receptive fields (Fig. 4b). Although the shift in aural dominance between sham and MD distributions was most striking in rats ligated at 2wks, it was statistically significant for all age groups, including adulthood (K-S tests, p < 0.001 each). Comparison of sham recordings from ICc revealed an even stronger contralateral bias present at each age (Fig. 4c). Unlike AI, however, contralateral ligation did not induce a significant shift towards an ipsilateral preference in ICc recordings at any age (K-S tests, p > 0.05 each).
Distinct Critical Period Regulation for Inputs from Developmentally Ligated and Open Ears
Aural dominance shifts represent a change in the ratio of contralateral/ipsilateral input efficacy. As with any ratio, the change could reflect a suppression of input strength from the developmentally ligated contralateral ear (i.e. change in the numerator) and/or an augmentation of input strength from the open ipsilateral ear (i.e. change in the denominator). In order to isolate the relative contributions from each source, responses to ligated and open inputs were analyzed independently. Working off the assumption that an efficacious input is one that drives the neuron at short latencies, at low intensities, and to which the neuron exhibits a well-defined receptive field, we measured onset latency, minimum response threshold and receptive field continuity for each recording site that yielded a measurable contralateral or ipsilateral FRA (see Figure S1 for a separate analysis of each response feature). Measurements from MD and sham recordings from a given combination of age and brain structure were than pooled and converted to z scores. The sign of the z score was inverted and averaged so that higher values would correspond to recording sites with shorter latencies, lower thresholds and more complete receptive fields.
In AI, evoked responses from the developmentally ligated ear were significantly suppressed at all ages (MD vs. sham, p < 0.001 each; Fig 4d). Responses from the open ipsilateral ear, by contrast, were significantly augmented in MD rats ligated at 2wks and 4wks (MD vs. sham, p < 0.001 each), but were not different from shams when the ligation was initiated in adulthood (p > 0.05; Fig 4d). The aural dominance shift observed in MD adult AI recordings, therefore, was exclusively mediated by a weakening of input strength from the developmentally ligated ear, whereas shifts in rats ligated as infants or juveniles reflected both an increased drive from the developmentally open ear as well as a suppression of inputs from the ligated ear. Despite the fact that significant shifts in the aural dominance distributions were not observed in ICc recordings, we did observe a significant decrease in the efficacy of inputs from the ligated ear at all ages (p < 0.05 for each, Fig. 4e). Significantly augmented responses from the open ear were not observed at any age (p > 0.05 for each, Fig. 4e). Thus, in ICc, where frank ipsilateral responses were not commonly observed, neurons were still disproportionately driven by contralateral inputs even though the receptive fields in MD rats were degraded relative to sham-operated controls. Further investigation into the spatial distribution of plasticity revealed that positions with significant augmentation of open ear inputs were restricted to a spatially restricted zone in the high frequency half of the tonotopic map (upper vs. lower half, χ2 = 4.4, p < 0.05) whereas suppression of ligated ear responses was more homogenously distributed across the tonotopic map (upper vs. lower half, χ2 = 2.7, p > 0.05, Fig S2).
Experience-Dependent Changes in Trial-by-Trial Variability
As a next step, we were interested in determining how shifts in aural dominance and tonotopic map organization affected the ability of neurons to encode elementary sound features presented to the developmentally ligated versus open ear. Because accurate encoding can depend upon having reliable responses to the presentation of an identical stimulus, we began this line of inquiry by investigating trial-by-trial variability in well-isolated single AI and ICc units in 2wk sham and MD rats. When presented with a brief 70 dB SPL tone at best frequency, sham AI units typically discharged 1–4 action potentials to contralateral stimuli at short latency (mean = 16.2 ± 0.4 ms) and responded at approximately twice that latency (mean = 34.1 ± 2.6 ms, p < 0.001) and with more variable spike counts to ipsilateral tones at best frequency (Fig. 5a). In MD units, slower contralateral onset latencies and faster ipsilateral onset latencies nearly eliminated the interaual onset disparity (means = 24.1 ± 1.9 vs. 27.1 ± 0.8 ms for contralateral and ipsilateral, respectively, p > 0.05), which complemented increased variability in the probability and temporal precision of contralaterally evoked spikes (Fig. 5b). Looking at the group averages, we observed a significant increase in the contralateral failure rate (trials without spikes) between AI sham and MD units (29.8 vs. 49.8%, p < 0.001; Fig. 5c) and significantly greater variability both in contralateral first spike latency (p < 0.05; Fig. 5e) and spikes per trial (p < 0.001; Fig. 5g). Variability in ipsilateral first spike latency (p = 0.16; Fig. 5e) and spikes per trial (p = 0.05; Fig. 5g) were somewhat reduced in MD compared to sham, although the difference did not reach statistical significance for either measurement. Other than a significant increase in the variability of contralateral first spike latency between MD and sham units (p < 0.05; Fig. 5f), no significant changes in trial-by-trial variability were observed in ICc (Fig. 5d and h).
Figure 5. Experience-dependent changes in trial-by-trial variability.

(A and B) Raster plots illustrate spike count and timing from single neurons recorded in sham 2wks (A) or MD 2wks (B) rats. Rasters are constructed from 20 repetitions of contralateral/ligated (C, black dots) and ipsilateral/open (I, gray dots) 70 dB SPL tones at the BF. Tones are presented independently to each ear with SOA = 800 ms. Inset: action potential waveforms for each single unit. (C and D) Percentage of trials with no spikes from contralateral/ligated and ipsilateral/open inputs in sham (open bars) and MD (shaded bars) AI (C) and ICc (D) recordings. (E–H) Coefficient of variation (CV) in first spike latency (E and F) and spike count (G and H, respectively) from AI (E and G) and ICc (F and H) recordings. Asterisks denote unpaired t-test, p < 0.05.
Bi-Directional Effects of Monaural Deprivation on Stimulus Classification
Collectively, these data indicate that MD beginning shortly after the onset of hearing induced marked alterations in the reliability and form of interaural stimulus representations, particularly in AI (see Fig. S3 for summary). Does this neurophysiological plasticity translate into appreciable differences in the ability of cortical or collicular ensembles to encode basic stimulus attributes? We addressed this question through the application of a PSTH-based classifier model that creates representational templates from population responses to stimuli that vary either in frequency or sound level and then, given a single trial of spatiotemporal activity across the ensemble, attempts to classify which stimulus within the set generated the response (Foffani and Moxon, 2004). A key feature of this model is that it does not make any assumptions as to what aspect of the neural response (i.e. spatial, rate or timing) promotes the most useful coding scheme. The utility of each feature is derived from the data themselves. To the extent that some aspect of the spatiotemporal activity patterns elicited by a given frequency or sound level are distinct from one another and are reliable from trial-to-trial, the model will accurately classify the stimulus that generated the response on a single-trial basis.
Classification accuracy was tested on single unit ensembles drawn evenly from all regions of the tonotopic maps. Ensembles were tested on their ability to accurately classify 9 tone frequencies (2–32 kHz in 0.5 octave increments) presented at high intensities (60–70 dB SPL) and separately on their ability to classify sound level (Figure S4). Frequency classification performance from AI and ICc sham ensembles was quite good, with the model correctly selecting the veridical frequency 87% of the time from each (Fig 6a and 6b, solid lines left column). When erroneous assignments occurred, they were typically made to frequencies just above or below the actual frequency presented on that trial. Ipsilateral frequency classification was substantially worse for sham ensembles, with accuracy at 32% and 24% for AI and ICc, respectively (Fig. 6a and 6b, solid lines, right column).
Figure 6. Bi-directional shifts in contralateral and ipsilateral classification accuracy.

(A and B) PSTH-based model performance for classification of tone frequency delivered to the contralateral/ligated (left column) and ipsilateral/open (right column) ears in single unit ensembles from sham (open symbols, solid line) and MD (gray symbols, broken line) rats. Asterisks denote significant differences between sham and MD classification accuracy based on unpaired t-tests (p < 0.05). See also Figure S4.
Classification performance from the MD AI ensemble revealed a double-dissociation, in which classification accuracy for stimuli presented to the developmentally ligated contralateral ear was significantly worse than sham (55%, p < 0.001) and frequency classification for the ipsilateral ear was significantly more accurate than sham (53%, p < 0.005; Fig. 6a, broken lines). These data demonstrate that augmentation of ipsilateral and suppression of contralateral tuning in AI had realizable benefits for the efficient coding of stimulus frequency. Importantly, performance from the ICc MD and sham ensembles did not differ for contralateral or ipsilateral frequency classification (p > 0.05 for all tests, Fig. 6b). Therefore, although responses to stimuli delivered to the developmentally ligated ear were suppressed in AI and ICc, it only affected coding accuracy in AI.
Monaural Deprivation Disrupts Binaural Integration
Thus far, the effects of MD have been characterized for inputs delivered to the contralateral or ipsilateral ears independently. In animals with small head circumferences and high frequency hearing, like rats, sound localization behavior depends critically upon the extraction and representation of interaural level differences (ILD) present in dichotic sound sources. Therefore, as a final step we turned our attention to the effects of MD on ILD tuning in ICc and AI in 2wk MD and 2wk sham rats. This was achieved by simultaneously presenting bandlimited noise bursts to each ear at sound levels ranging from 10–80 dB SPL. Control experiments confirmed that our recordings were not contaminated by transcranial bone conduction with these stimulus parameters (Figure S5). The resulting binaural interaction matrix presents firing rate variations across an 8 × 8 combinatorial array of sound levels, revealing a stereotyped triangular region of response inhibition at positions where the ipsilateral level is high and the contralateral level is low (Fig. 7a). Ipsilaterally mediated inhibition was characterized over a range of level combinations where ILD was ± 20 dB and average binaural level was between 0 - 40 dB of contralateral threshold (see blue zone in Fig. 7a). Ipsilaterally mediated inhibition was easily quantified at each site by expressing the fractional decrease in firing rate (or increase for facilitation) at each binaural combination relative to the linear sum of each monaural component (e.g. the blue cross in Fig. 7a relative to the sum of the red and green crosses, see Figure S6 for detailed quantification). As a final step, we measured the ability of the ipsilateral ear to directly excite neurons by summing the firing rates across all ILD combinations where the contralateral level was lowest (green box in Fig. 7a).
Figure 7. MD disrupts binaural integration.
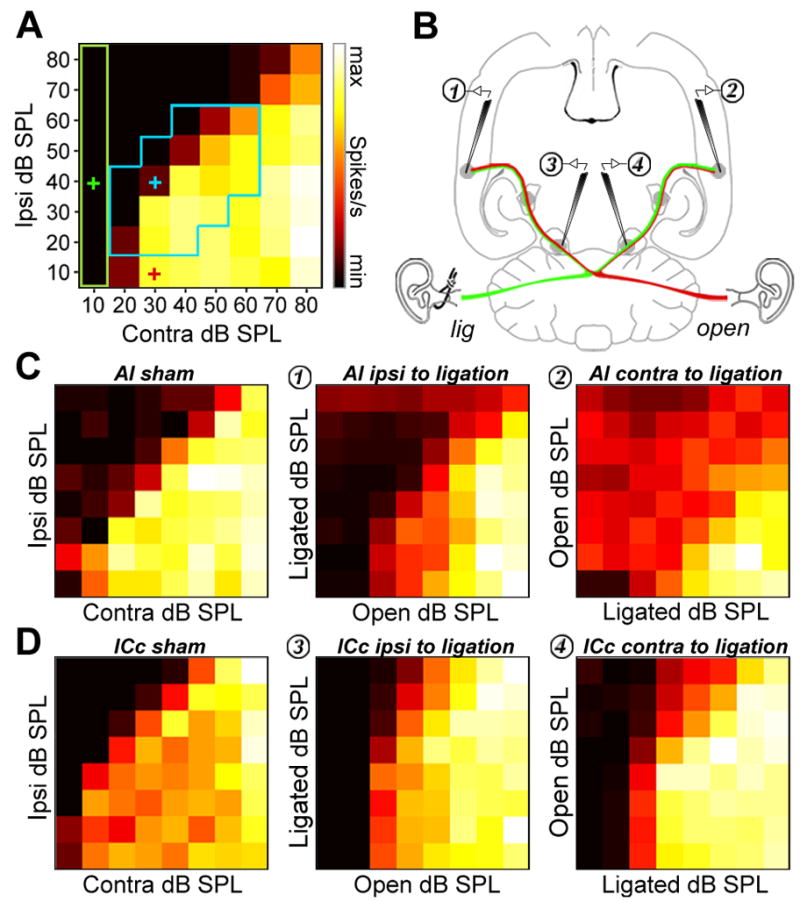
(A) Representative binaural interaction matrix reconstructed from an ICc unit recorded in a 2wk sham-operated rat. Bandlimited noise bursts centered on the CF of each neuron were presented at 64 interaural level combinations. Contralateral response suppression was greatest when ipsilateral level is high and contralateral level close to threshold, but diminished as ipsilateral level decreased and/or contralateral level increased. The blue box represents the set of 19 interaural level combinations selected for quantification of binaural integration, constrained to ILD ± 20 dB and absolute level within 40 dB of contralateral threshold. Binaural suppression was quantified by comparing the firing rate for each combination relative to the linear sum of their monaural intercepts (e.g. blue cross (ILD = −10) relative to sum of green and red cross). (B) Cartoon represents the placement of recording electrodes in ICc and AI from both hemispheres superimposed on a horizontal section of the rat brain. (C and D), Binaural interaction matrices from AI (C) and ICc (D) in sham rats (left column), MD rats ipsilateral to the ligated ear (middle column) and contralateral to the ligated ear (right column). Color scale and axis labels in A applies to all plots. See also Figure S6.
We formulated a three-part hypothesis about the effects of MD on ILD tuning based on the straightforward assumption that synaptic drive, be it excitatory or inhibitory, would be weakened for the developmentally ligated ear and augmented for the developmentally open ear: I) recordings ipsilateral to the open ear will show elevated levels of ipsilaterally mediated inhibition; II) recordings ipsilateral to the ligated ear will show reduced levels of ipsilaterally mediated inhibition; III) direct ipsilateral excitation will be greater than sham when recordings are made ipsilateral to the open ear and weaker than sham for recordings made ipsilateral to the ligated ear. To test these hypotheses, binaural interactions were measured from AI and ICc contralateral to the ligated ear, as with previous data sets, but also from ICc and AI in the hemisphere ipsilateral to the ligated ear (Fig. 7b). Comparing a representative sham AI recording (Fig. 7c left column) to a MD recording made from AI ipsilateral to the ligated ear (Fig. 7c middle column), we observed a subtle weakening of ipsilateral inhibition that reached significance for a few combinations centered on lower ipsilateral intensities (Fig. S6b). Recordings contralateral to the ligated ear revealed a substantially different pattern in which ipsilateral inputs alone elicit moderately high firing rates, but when combined with contralateral inputs, come to inhibit responses even further beneath the linear sum of its monaural contributions (Fig. 7c, right column), in keeping with our hypothesis. Recording from ICc ipsilateral to the ligated ear demonstrated a pronounced reduction in ipsilateral inhibition compared to sham, also in agreement with our hypothesis (Fig. 7d, middle vs. left column). However, inhibition was not enhanced in recordings made from ICc contralateral to the ligated ear (Fig. 7d, right column). If anything, ipsilateral inhibition was weaker than in sham recordings, particularly at higher stimulus intensities (Fig. S6c). Expressed in the traditional ILD parlance, binaural interactions in sham recordings, ICc contralateral to the ligated ear and in AI ipsilateral to the ligated ear in MD rats were typically EO/I. MD caused binaural interactions in ICc ipsilateral to the ligated ear to shift towards EO/O and in AI contralateral to the ligated ear shifted towards an exaggerated form of EE/I.
When quantified as a function of ILD, we observed the expected decay in binaural inhibition as ILD shifted towards more positive, contralaterally dominant combinations (Fig 8a and 8b for AI and ICc, respectively). The slope of this function was greatly reduced in AI recordings made contralateral to the ligated ear, such that ipsilateral inhibition remained significantly elevated relative to sham across all ILD combinations except −20 dB (Fig. 8a, gray vs. open symbols, p < 0.001 for all). This pattern of reorganization could not be accounted for by congruent shifts in ICc, as ipsilaterally mediated inhibition was equivalent to sham at all ILD combinations (Fig. 8b, gray vs. open symbols, p > 0.05 for all). Moving to the other hemisphere, recordings made ipsilateral to the ligated ear revealed substantially reduced levels of inhibition across all ILD combinations in ICc (Fig. 8b, black vs. open symbols, p < 0.025 for all), but only a modest change in inhibition from ipsilateral AI (Fig. 8a, black vs. open symbols).
Figure 8. Bilateral effects of MD on ILD encoding.

Ipsilaterally mediated inhibition expressed as a function of ILD (ipsilateral (I) level – contralateral (C) level) for AI (A) and ICC (B) recordings made in sham rats (open symbols), MD rats ipsilateral to the ligated ear (black symbols) and MD rats contralateral to the ligated ear (gray symbols). (C) Ipsilaterally mediated inhibition averaged across all ILD combinations above is plotted alongside levels of ipsilateral excitation for AI (circles) and ICc (squares). Asterisks denote significant differences for unpaired t-tests (p < 0.025 after correction for multiple comparisons) comparisons between sham vs. contra to ligation (gray *) and sham vs. ipsi to ligation (black *). See also Figure S6.
Returning to our final hypothesis regarding changes in the levels of direct ipsilateral excitation, we discovered several additional surprises. Recordings from ICc ipsilateral to the developmentally open ear did not demonstrate greater excitation than sham (gray vs. white squares in Fig. 8c, p > 0.05) but was nearly two times greater than sham in AI (gray vs. white circle in Fig. 8c, p < 0.001). Therefore, in keeping with the augmentation of ipsilateral inputs described in Fig. 4, both the excitatory and inhibitory influences of the developmentally open ear were greatly increased in AI but neither were changed in ICc. Turning to the hemisphere contralateral to the developmentally open ear, we found that the direct ipsilateral excitatory drive was significantly reduced relative to sham in ICc (Fig. 8c, black vs. white squares, p < 0.05), yet was unaffected in AI (Fig. 8c, black vs. gray circles, p > 0.05). Therefore, the greatly enhanced influence of the developmentally open ear in ipsilateral AI cannot be explained by changes in the balance of excitation and inhibition occurring in AI of the opposite hemisphere or ICc of the same hemisphere.
DISCUSSION
Periphery, brainstem, midbrain and cortex: unraveling the locus of plasticity
Unlike the canonical test beds for developmental plasticity research such as binocular tuning in V1 or audiovisual integration in the optic tectum, most auditory stimulus representations characterized in AI already appear at lower levels of the auditory system. Nevertheless, the scope and sensitivity of AI reorganization in response to experiential manipulations is remarkable and given the intimate association between AI and elementary properties of auditory perception (Atiani et al., 2009; Bendor and Wang, 2007; Petkov et al., 2007), AI should continue to serve as a premier model for plasticity studies, provided that additional precautions are taken to distinguish between effects that emerge there de novo versus those that are passively relayed from other nuclei. For example, by recording from the AI, ICc, and the medial geniculate body (MGB) of the thalamus, researchers have traced the locus of adult tonotopic map reorganization following basilar membrane lesions to reorganization occurring within MGB (Irvine et al., 2003; Kamke et al., 2003; Robertson and Irvine, 1989). By contrast, the physiological memory trace from acoustic fear conditioning originates in a distributed network involving AI, primary somatosensory cortex (S1), MGB, the amygdala and cholinergic inputs from nucleus basalis (Froemke et al., 2007; Suga, 2008; Weinberger, 2007), before being recapitulated at lower stations within the auditory pathway via corticofugal connections (Zhang and Yan, 2008).
What can this approach tell us about contributions from midbrain, brainstem and even the periphery to the effects of MD? By combining bilateral recordings in AI and ICc with detailed ABR measurements, we have been able to identify some reorganizational features that cannot be explained by low-level changes in the auditory system and others that must be. Specifically, we observed three facets of plasticity resulting from MD at 2wks: I) An overrepresentation of low frequency CF map regions, II) A suppression of excitatory and inhibitory influences from the developmentally ligated ear, and III) An enhancement of excitatory and inhibitory influences from the developmentally unobstructed ipsilateral ear. The first of these effects offers a relatively straightforward interpretation: low frequency map distortion was observed in AI, but not in ICc (Fig. 3). Therefore, the locus of plasticity must be downstream of ICc, either in the auditory cortex itself or in the MGB, which will be the target of future experiments.
It is equally clear that suppressed responses to the developmentally ligated ear do not appear in AI de novo, as suppression was observed in ICc and also in wave II of the ABR, reflecting synaptic transmission between the auditory nerve and globular cells of the cochlear nucleus (Melcher and Kiang, 1996). Four lines of evidence argue against attributing response suppression to unresolved peripheral hearing loss in the developmentally ligated ear: I) The amplitudes of peripherally generated ABR waves Ia and I were completely normal following ligation removal, even when measured with high intensity click stimuli that disproportionately activate basal high frequency regions of the cochlea; II) Responses evoked by the developmentally ligated ear were equivalent to sham controls when recordings were made in AI ipsilateral, rather than contralateral, to the ligated ear (Fig. 8c); III) Contralateral suppression is observed across the low-to-high frequency extent of AI maps, not only in high frequency regions (Fig. S2); IV) Direct stimulation of MGB in thalamocortical brain slices made from animals experiencing CHL also reveals significantly increased AI response latencies and single trial temporal jitter, in keeping with the AI measurements reported here using acoustic stimulation of the ligated ear (Xu et al., 2007) (Fig. 5). Collectively, these observations make a strong argument that response suppression to the ligated ear can be traced to alterations in brainstem circuitry, not the periphery, most probably in the cochlear nucleus.
The most striking effect of MD in young rats was the enhanced responsiveness to inputs from the developmentally open ipsilateral ear in AI. The elaboration of ipsilateral stimuli was observed in the increased quality of tonal receptive fields (Fig. 4), the emergence of a well organized ipsilateral tonotopic map (Fig. 2), the enhancement of ipsilaterally evoked excitation and ipsilateral inhibition (Fig. 7 and 8), and the combined effect of these neurophysiological changes amounted to improvements in classification accuracy for ipsilateral stimuli (Fig. 6). These effects could not be attributed to reorganization in ICc from the same hemisphere or to reorganization of AI from the opposite hemisphere (Fig. 8). How then could both excitatory and inhibitory inputs from the open ear approximately double in strength for AI recordings made contralateral to the ligated ear (Fig. 8c)? One possibility is that removing the principal excitatory drive from AI induces specific and intrinsic changes in these circuits, allowing neurons to select new presynaptic partners. Converging lines of evidence from the somatosensory and visual cortex suggest that unilateral sensory deprivation can disrupt the formation of extracellular matrix proteins that normally inhibit active synapse remodeling (McRae et al., 2007; Sur et al., 1988). The extracellular matrix undergoes dramatic bottom-up postnatal development in the rat auditory system, first appearing in the brainstem on postnatal day 4, ICc on day 8 and in AI on day 18 (Friauf, 2000). Therefore, AI circuits contralateral to the ligated ear may have been able to establish contacts with initially weak inputs arriving from the open ear via callosal fibers or MGB while the extracellular matrix formation was immature or actively retarded.
Critical period cascades within primary sensory cortex
Sensory experience can exert particularly profound effects on the functional organization of sensory brain regions during time-limited developmental windows known as critical periods (for review see Hensch, 2005; Keuroghlian and Knudsen, 2007). Recent evidence from developmental plasticity studies in AI and V1 support the concept that sensory feature representations develop sequentially - from rudimentary to complex - across early postnatal development, and that experience-dependent refinements for each feature are governed by temporally independent critical periods. In V1, the critical period for orientation selectivity precedes the critical period for ocular dominance (Fagiolini and Hensch, 2000) and binocular matching (Wang et al., 2010), and these sequential processes may reflect distinct molecular mechanisms (Fagiolini et al., 2003). In a similar vein, two recent studies in AI have demonstrated that basic organizational features such as static frequency tuning and rate selectivity undergo rapid development and critical period regulation shortly after the onset of hearing, while second-order features, such as tuning for the direction of frequency modulation, are shaped during a critical period occurring later in development (Insanally et al., 2009; Razak et al., 2008). In our study, unilateral ear canal ligation created two types of sensory imbalances, thereby permitting comparison of two separate experience-dependent plasticity processes: I) a global deprivation of contralateral inputs relative to ipsilateral inputs and II) within the global attenuation of contralateral inputs, a relative sparing of frequencies less than 4 kHz. The preservation of low frequency hearing induced an expansion of low frequency areas of the tonotopic map, but only in animals ligated at 2wks, in agreement with recent studies in the rat demonstrating that passive experience with spectrally modified sound environments only modifies the tonotopic map within the first few days after hearing onset (de Villers-Sidani et al., 2007; Insanally et al., 2009). Similar to binocular tuning in V1, binaural selectivity in AI emerges progressively over the first month of hearing (Razak and Fuzessery, 2007), as one would expect from the delay of organized connectivity for binaural versus topographic circuits in the developing auditory brainstem (Green and Sanes, 2005; Kim and Kandler, 2003). By demonstrating that ipsilateral augmentation is observed in rats ligated at 2wks or 4wks, but not in adulthood, our data confirm the prediction that interaural balance, like frequency modulation direction tuning, is shaped during a critical period extending into later postnatal development. Additional work will be necessary to reveal the molecular specializations that permit temporally separable refinement of distinct auditory feature representations within AI circuits.
Bi-directional plasticity: a comparison across sensory modalities
The effect of monaural deprivation in AI shares a hallmark feature with monocular deprivation in V1 or whisker trimming in the primary somatosensory cortex (S1): a loss of responsiveness to the normally dominant source of sensory input that has been blocked during early development (i.e. the contralateral eye/ear or principal whisker), and a gain in responsiveness to the normally weaker input source that has been left alone during early development (i.e. the ipsilateral eye/ear or surround whisker) (Fox, 1992; Mioche and Singer, 1989). Therefore, in all three sensory systems, a shift in preference toward the open eye, the open ear or the spared whisker is rooted in a bidirectional adjustment in the excitatory drive from deprived and non-deprived inputs. That suppression and augmentation can be teased apart according to when deprivation was initiated or where recordings are made, suggests that each reflects mechanisms that are distinct from one another, yet may be conserved across modalities.
Beyond this basic, but critical, similarity, differences between modalities begin to emerge. For instance, the age-dependent expression of each plasticity component is reversed in A1 compared to both V1 and S1. We found that augmentation of inputs from the non-deprived ipsilateral ear was observed when deprivation was initiated at 2wks or 4wks, but not in adulthood. Contralateral suppression, by contrast, was observed at all ages. In V1 and S1, suppression of responses to the closed eye or trimmed whisker are only observed when deprivation is initiated in early postnatal life, whereas potentiation of inputs from the spared eye or whisker can be observed into early adulthood, particularly when cortical recordings are made outside of layer 4 or with methods sensitive to subthreshold changes (Glazewski et al., 1996; Sawtell et al., 2003). The hierarchical expression profile was also distinct; whereas suppression of deprived whisker responses is observed in S1, but not in thalamic or brainstem nuclei (Glazewski et al., 1998), suppression of deprived ear responses was observed in both A1 and ICc. Further insight into these differences will require experimenting with shorter lengths of MD and targeting different lamina within AI so as to more closely approximate the experimental design used in visual and somatosensory deprivation experiments.
Amblyopia and Amblyaudio
Critical periods of brain development are windows of opportunity as well as vulnerability. Gone untreated, an inherent imbalance in the strength of visual signals transmitted from each eye to the central visual system can cause a permanent loss of acuity in the non-dominant eye and deficiencies in stereoscopic vision, a condition known as amblyopia. Similarly, particularly severe otitis media with effusion during early childhood that does not resolve spontaneously or through intervention with antibiotics and/or tympanostomy tubes can lead to long-lasting auditory perceptual deficits, a condition we are calling amblyaudio. In both cases, the critical factor may be linked to whether imbalanced signals arriving from the eyes or ears coincides with the critical period for binocular or binaural integration in the primary visual or auditory cortex, respectively.
In AI, the end of a critical period does not signify an end to experience-dependent plasticity. A growing literature suggests that the end of the critical period marks the transition between an early developmental stage in which cortical sound representations are shaped through passive experience and a later stage in which reorganization requires learned associations between sounds and behaviorally relevant consequences (for review see Keuroghlian and Knudsen, 2007; Polley et al., 2008). In this sense, it is more apt to describe the critical period as a developmental switch between exposure-based plasticity and reinforcement-based plasticity, rather than between a plastic period and a stable period. Indeed, training adult animals in auditory learning tasks can bring about specific and long-lasting changes in AI auditory feature representations (Fritz et al., 2005; Polley et al., 2006). Perceptual learning has been advanced as an effective method for improving visual acuity in adult amblyopia patients (Li et al., 2008), which raises the possibility that focused auditory training may also be a promising approach to accelerate recovery in individuals with unresolved auditory processing deficits stemming from childhood CHL.
EXPERIMENTAL PROCEDURES
Ear Canal Ligation
All procedures were approved by Vanderbilt University Animal Care and Use Committee and followed the guidelines of the National Institutes of Health guide for the care and use of laboratory animals. Sprague-Dawley rats underwent either an ear canal ligation surgery or a sham surgery on the morning of P14 (2wks), P28 (4wks) or P140 (adult). Rats were brought to a surgical plane of anesthesia (ketamine, 80 mg/kg, and medetomidine, 0.5 mg/kg), an incision was made behind the pinna, and a portion of the external meatus was isolated and ligated with surgical silk, producing complete atresia. For the sham procedure, the surgical silk was passed around the meatus but was not tied off. Surgery type (ligation or sham) and ear (left or right) was varied between rats in a single litter. Following wound closure, rats were returned to their home cage for 60–74 days. Home cages were positioned inside small sound attenuating booths outfitted with a ceiling-mounted speaker. A repertoire of sparse spectrotemporally varying natural sounds (max level = 65 dB SPL) was presented continuously during this period to accentuate the binaural disparity for airborne sounds versus self-generated sounds that could bypass the ligation via bone conduction.
Neurophysiological Recording
Auditory Brainstem Response
ABR was performed in every rat prior to recordings from AI or ICc. Rats were anesthetized with pentobarbital sodium (50 mg/kg followed by 10–15 mg/kg supplements as necessary). The external ears were removed bilaterally at the point where the meatus passes through the temporal bone. Any detritus or other buildup that obscured the tympanic membrane in the ligated ear canal was removed with extreme care. Provided that the tympanic membrane looked healthy in both ears, the rat was placed in a stereotaxic frame, supported by hollow ear bars that were custom-designed to form a tight seal with the external acoustic meatus and terminate ~1 mm from the tympanic membrane (David Kopf Instruments). Calibrated electrostatic transducers (Stax SR-003) were affixed to the distal ends of each ear bar.
ABR measurements were obtained within 60 minutes following ligation removal with platinum needle electrodes positioned at each pinna and a ground at the base of the neck, an orientation known to accentuate the earliest waves of the response. ABRs were generated from the ligated and normal ears of sham (N=22) and MD (N=24) rats using click stimuli (50 μs duration, positive monophasic at 27 Hz) that ranged from 0 – 80 dB SPL in 5 dB increments. Rats were excluded from further study if the click-evoked ABR threshold from the ligated ear exceeded the normal ear threshold by more than 10 dB (approximately 15% of cases). Additional free field ABR measurements were undertaken in a subset of rats ligated either at P14 or adulthood to characterize frequency-dependent threshold shifts before and after ligation removal. In these studies, ABR frequency response thresholds were characterized independently for both ears using tone bursts (5 ms duration with 0.5 ms cos2 ramps, 1 to 32 KHz in 0.5 octave increments, 2 dB SPL increments, presented at 27 Hz) immediately following ligation (N=2), immediately preceding ligation removal (N =4), immediately following ligation removal (N=3) and in sham rats (N=2).
Recordings from AI and ICc
If normal hearing was confirmed with ABR, the skull and soft tissue overlying auditory and occipital cortex were removed. Multiunit responses were recorded with epoxylite-coated tungsten microelectrodes (2.0 MΩ at 1 kHz, FHC) in AI and 16-channel silicon probes in ICc (150 μm inter-contact separation, Neuronexus). AI was identified based on the unique rostral-to-caudal tonotopy arising from dense spatial sampling (50–100 μm between penetrations) of the middle cortical layers (450 – 550 μm) as described previously (Polley et al., 2007). The silicon probe configuration allowed us to record simultaneously from multiple sites (mean = 13.3) spanning the entire low-to-high frequency extent of ICc. The borders of the tonotopic maps were identified in both structures either by the presence of unresponsive sites or reversals in CF tuning. Two to four separate penetrations were made from different positions within the ICc for a given animal. For each recording site, tone pips (20 ms duration, 5 ms cos2 ramps) were delivered to each ear independently (800 ms SOA). In some cases, bandlimited noise bursts (100 ms duration, 5 ms cos2 ramps, 0.3 octave wide, centered on CF for each neuron) were presented simultaneously to each ear at levels ranging from 10 – 80 dB SPL in 10 dB increments, for a total of 64 unique interaural SPL combinations (repeated 20 times each). Absence of contralateral cochlear excitation via bone conduction was confirmed in cochleectomized rats (Supplementary Figure 5). When indicated, single units were isolated offline according to waveform shape, separability in principal components space, autocorrelation and signal-to-noise ratio.
Data Analysis
ABR Measurements
ABR threshold was defined as the lowest sound level that could reliably produce a stimulus-evoked peak that followed the progressive trend for decreasing amplitude and increasing latency observed over the full range of sound levels. Amplitude measurements were made from waves Ia, I and II based on the difference between the corresponding peak and the immediately preceding local minima.
CF Gradients
Contralateral and ipsilateral frequency-intensity response areas were reconstructed from 488 tone pips (1–64 kHz in 0.1 octave increments; 0 – 70 dB SPL in 10 dB increments) delivered in a pseudorandom order for each ear. CF was defined for each tuning curve as the frequency that evoked a response at threshold. Normalized topographic position was defined as the relative point along a line connecting the low and high frequency boundaries of CF maps. CF-position plots were then fit with a 4th degree polynomial (e.g. Fig. 3). The percentage of the CF map allocated to frequencies ≤ 4 kHz was defined as the X intercept of the fit line at 4 kHz (x 100). For ICc maps, estimates were made separately for each penetration and then averaged. In all cases, 20–50 penetrations were contained within a single map per animal (AI 2wks, N = 4/6 (sham/MD); AI 4wks, N = 5/6; AI Adult, N = 4/4; ICc 2 wks, N = 6/4; ICc 4 wks, N = 5/5; ICc Adult, N = 6/4).
Binaural Analysis of Frequency Response Areas
FRAs were initially calculated based on spikes occurring between 5 – 50 ms from stimulus onset. The spike collection window was then refined by adjusting the early time point until the first spikes that fell within the high intensity regions of the FRA were identified (see Supplementary Figure 1). This point was defined as the onset latency. The end of the window was determined by identifying the latest spikes that unambiguously fell within the outline of the FRA. Receptive field continuity was defined as the percentage of points inside the FRA outline that had firing rates less than the average spontaneous rate defined from the 100 ms prior to stimulus onset. To quantify contralateral and ipsilateral efficacy, measurements of onset latency, minimum response threshold and continuity were pooled across MD and sham recordings for a given combination of deprivation age, brain structure and laterality (e.g. all AI MD and sham 2wk recording sites). The sample for all 3 measurements was then converted to a z score, multiplied by −1 and averaged. Thus, recording sites driven at short latencies and low intensities, featuring complete FRAs have more positive z scores.
The aural dominance index was calculated by comparing the firing rates (spikes/sec, adjusted for baseline activity) for each frequency-intensity combination that fell within the union of the contralateral and ipsilateral FRAs (see Fig. 4a, right column). Using a winner-take-all approach, the firing rate for each frequency-intensity point was scored as a 1, 0 or −1 based on whether contra > ipsi, contra = ipsi or contra < ipsi, respectively. The mean of all comparisons for each recording site was then assigned to one of seven aural dominance categories, each capturing a 0.286 range with lower categories reflecting more positive (contra dominant) aural dominance index scores.
Analysis of Binaural Integration
Binaural suppression was characterized from AI and ICc ipsilateral and contralateral to the developmentally ligated ear in 2 wk MD rats (N = 105/4 (recording sites/animals) for contralateral AI; N = 129/3 for ipsilateral AI; N = 55/4 for contralateral ICc; N = 93/5 for ipsilateral ICc). These recordings were compared against recordings from 2 wk sham rats (N = 105/4 for AI; N = 80/4 for ICc). A population PSTH with 1 ms bins was created from 1280 presentations of bandlimited noise bursts (64 interaural SPL combinations × 20 repetitions each). Spike counts within this period were determined for each unique interaural combination, the corresponding baseline firing rate subtracted, the result converted to spikes/sec, and finally normalized to the interaural combination with the greatest firing rate. Ipsilateral excitation were defined as the sum of the firing rates from the eight stimulus combinations where the sound level for the ipsilateral ear varied, and was held at minimum level for the contralateral ear (e.g. ILD combinations highlighted within the green box in Fig. 7a). Contralateral threshold was defined from the contralateral rate-level function by beginning at the peak and moving towards lower sound levels to identify the first instance where the evoked response was ≤ 2 standard deviations from the baseline rate. As a final step, we selected the 19 sound level combinations with ILD ± 20 dB and mean binaural SPLs from 0–40 dB above the contralateral threshold (e.g. blue box in Fig. 7a). Ipsilaterally mediated suppression was defined as the fractional change in firing for a given dichotic stimulus combination relative to the sum of its monaural intercepts using the formula (((Cref + Iref) − CIcomp)/(Cref + Iref)) * 100, where Cref is the contralateral reference firing rate (e.g. red cross in Fig. 7a), Iref is the ipsilateral reference firing rate (e.g. green cross in Fig. 7a) and CIcomp is the comparison firing rate evoked by both the simultaneous presentation of Cref and Iref (e.g. blue cross in Fig. 7a).
Trial-by-trial Variability
A subset of single units from the 2wk age group (N = 98 AI Sham, N = 96 AI MD, N = 88 ICc Sham, N = 98 ICc MD) were studied with a restricted set of 54 tone pips (9 frequencies, 2–32 kHz in 0.5 octave increments; 6 levels, 20–70 dB in 10 dB increments) pseudorandomly presented to each ear 20 times each. Neurons were drawn from across the entirety of the topographic maps to include the full range of preferred frequencies. The spike collection window and FRA outline were determined as described above. Next, trial-by-trial variability in response rate and first spike latency were characterized at 60 and 70 dB SPL at the best frequency (frequency that elicited evoked the greatest number of spikes) for contralateral and ipsilateral FRAs. A given trial was classified as a failure if no spikes were elicited within the overall spike collection window. For successful trials, the first spike latency was defined as the time of the first spike that occurred within the spike collection window and fell within the boundaries of the FRA. Spikes per trial was defined as the total number of spikes that fell within the spike collection window. The coefficient of variation (standard deviation divided by the mean) was then calculated for onset latency and spikes per trial.
Neurocomputational Model
Classifier Model
PSTH-based classification was performed on the same sample of single units and stimulus set described above. A post-stimulus time window of 100 ms divided into 1 ms bins was set to coincide with stimulus onset. The input to the model was a matrix with T * S rows and B * N columns, where T is the number of repetitions for each stimulus (T = 20), S is the total number of stimuli (S = 9 or 6 for frequency vs. level, respectively), B is the number of bins containing spike counts (B = 100) and N is the number of neurons (N = 88–98, depending on data set). Therefore, vi, j is equivalent to the spike counts in the ith row and jth column of the matrix, where i goes from 1 to S * T and j goes from 1 to N * B.
The model is then “trained” to create individual templates for each stimulus s defined as the vector with the jth element is calculated as
For an individual testing trial νi = νi,1,…,νi,N*B the Euclidean distance separating the trial from each stimulus template, v̄s is defined as
Each single-trial, i, is classified to the stimulus for which the single trial-to-template Euclidean distance is smallest. Each of the S * T single trials go through this two-step model. The current trial, to be tested in testing phase, is excluded from the template calculation in the training phase. Accuracy was defined as the absolute value of the discrepancy between the veridical stimulus and the classified stimulus (either in octaves or dB).
All data points are mean ± standard error unless otherwise specified. All statistical reports are based upon unpaired t-tests unless otherwise specified.
Supplementary Material
Acknowledgments
We are grateful to Z. Barnett for his invaluable technical assistance and to Drs. D. Blake and V. Khatri for commenting on an earlier version of manuscript. D.P. designed the experiment, collected data, analyzed data and wrote the manuscript. M.P. collected data, implemented the computational model and analyzed data. This work is supported by development funds from the Vanderbilt Kennedy Center, a Robin and Michael Fox Grant in Auditory Science from the National Organization of Hearing Research Foundation and NIH grant DC009836 to D.P.
Footnotes
Publisher's Disclaimer: This is a PDF file of an unedited manuscript that has been accepted for publication. As a service to our customers we are providing this early version of the manuscript. The manuscript will undergo copyediting, typesetting, and review of the resulting proof before it is published in its final citable form. Please note that during the production process errors may be discovered which could affect the content, and all legal disclaimers that apply to the journal pertain.
References
- Atiani S, Elhilali M, David SV, Fritz JB, Shamma SA. Task difficulty and performance induce diverse adaptive patterns in gain and shape of primary auditory cortical receptive fields. Neuron. 2009;61:467–480. doi: 10.1016/j.neuron.2008.12.027. [DOI] [PMC free article] [PubMed] [Google Scholar]
- Bajo VM, Nodal FR, Moore DR, King AJ. The descending corticocollicular pathway mediates learning-induced auditory plasticity. Nat Neurosci. 2010;13:253–260. doi: 10.1038/nn.2466. [DOI] [PMC free article] [PubMed] [Google Scholar]
- Bendor D, Wang X. Differential neural coding of acoustic flutter within primate auditory cortex. Nat Neurosci. 2007;10:763–771. doi: 10.1038/nn1888. [DOI] [PubMed] [Google Scholar]
- Chang EF, Merzenich MM. Environmental noise retards auditory cortical development. Science. 2003;300:498–502. doi: 10.1126/science.1082163. [DOI] [PubMed] [Google Scholar]
- Clements M, Kelly JB. Auditory spatial responses of young guinea pigs (Cavia porcellus) during and after ear blocking. J Comp Physiol Psychol. 1978;92:34–44. doi: 10.1037/h0077424. [DOI] [PubMed] [Google Scholar]
- Dahmen JC, King AJ. Learning to hear: plasticity of auditory cortical processing. Curr Opin Neurobiol. 2007;17:456–464. doi: 10.1016/j.conb.2007.07.004. [DOI] [PubMed] [Google Scholar]
- Davis-Gunter MJ, Lowenheim H, Gopal KV, Moore EJ. The I’ potential of the human auditory brainstem response to paired click stimuli. Scand Audiol. 2001;30:50–60. doi: 10.1080/010503901750069572. [DOI] [PubMed] [Google Scholar]
- de Villers-Sidani E, Chang EF, Bao S, Merzenich MM. Critical period window for spectral tuning defined in the primary auditory cortex (A1) in the rat. J Neurosci. 2007;27:180–189. doi: 10.1523/JNEUROSCI.3227-06.2007. [DOI] [PMC free article] [PubMed] [Google Scholar]
- Eggermont JJ, Don M. Analysis of the click-evoked brainstem potentials in humans using high-pass noise masking. II. Effect of click intensity. J Acoust Soc Am. 1980;68:1671–1675. doi: 10.1121/1.385199. [DOI] [PubMed] [Google Scholar]
- Engineer ND, Percaccio CR, Pandya PK, Moucha R, Rathbun DL, Kilgard MP. Environmental enrichment improves response strength, threshold, selectivity, and latency of auditory cortex neurons. J Neurophysiol. 2004;92:73–82. doi: 10.1152/jn.00059.2004. [DOI] [PubMed] [Google Scholar]
- Fagiolini M, Hensch TK. Inhibitory threshold for critical-period activation in primary visual cortex. Nature. 2000;404:183–186. doi: 10.1038/35004582. [DOI] [PubMed] [Google Scholar]
- Fagiolini M, Katagiri H, Miyamoto H, Mori H, Grant SG, Mishina M, Hensch TK. Separable features of visual cortical plasticity revealed by N-methyl-D-aspartate receptor 2A signaling. Proc Natl Acad Sci U S A. 2003;100:2854–2859. doi: 10.1073/pnas.0536089100. [DOI] [PMC free article] [PubMed] [Google Scholar]
- Foffani G, Moxon KA. PSTH-based classification of sensory stimuli using ensembles of single neurons. J Neurosci Methods. 2004;135:107–120. doi: 10.1016/j.jneumeth.2003.12.011. [DOI] [PubMed] [Google Scholar]
- Fox K. A critical period for experience-dependent synaptic plasticity in rat barrel cortex. Journal of Neuroscience. 1992;12:1826–1838. doi: 10.1523/JNEUROSCI.12-05-01826.1992. [DOI] [PMC free article] [PubMed] [Google Scholar]
- Friauf E. Development of chondroitin sulfate proteoglycans in the central auditory system of rats correlates with acquisition of mature properties. Audiol Neurootol. 2000;5:251–262. doi: 10.1159/000013889. [DOI] [PubMed] [Google Scholar]
- Fritz J, Elhilali M, Shamma S. Differential dynamic plasticity of A1 receptive fields during multiple spectral tasks. The Journal of Neuroscience. 2005;25:7623–7635. doi: 10.1523/JNEUROSCI.1318-05.2005. [DOI] [PMC free article] [PubMed] [Google Scholar]
- Froemke RC, Merzenich MM, Schreiner CE. A synaptic memory trace for cortical receptive field plasticity. Nature. 2007;450:425–429. doi: 10.1038/nature06289. [DOI] [PubMed] [Google Scholar]
- Glazewski S, Chen CM, Silva A, Fox K. Requirement for alpha-CaMKII in experience-dependent plasticity of the barrel cortex. Science. 1996;272:421–423. doi: 10.1126/science.272.5260.421. [DOI] [PubMed] [Google Scholar]
- Glazewski S, McKenna M, Jacquin M, Fox K. Experience-dependent depression of vibrissae responses in adolescent rat barrel cortex. European Journal of Neuroscience. 1998;10:2107–2116. doi: 10.1046/j.1460-9568.1998.00222.x. [DOI] [PubMed] [Google Scholar]
- Gray L, Smith Z, Rubel EW. Developmental and experimental changes in dendritic symmetry in n. laminaris of the chick. Brain Res. 1982;244:360–364. doi: 10.1016/0006-8993(82)90098-1. [DOI] [PubMed] [Google Scholar]
- Green JS, Sanes DH. Early appearance of inhibitory input to the MNTB supports binaural processing during development. J Neurophysiol. 2005;94:3826–3835. doi: 10.1152/jn.00601.2005. [DOI] [PubMed] [Google Scholar]
- Hensch TK. Critical period plasticity in local cortical circuits. Nat Rev Neurosci. 2005;6:877–888. doi: 10.1038/nrn1787. [DOI] [PubMed] [Google Scholar]
- Hogan SC, Moore DR. Impaired binaural hearing in children produced by a threshold level of middle ear disease. J Assoc Res Otolaryngol. 2003;4:123–129. doi: 10.1007/s10162-002-3007-9. [DOI] [PMC free article] [PubMed] [Google Scholar]
- Hutson KA, Durham D, Tucci DL. Consequences of unilateral hearing loss: time dependent regulation of protein synthesis in auditory brainstem nuclei. Hear Res. 2007;233:124–134. doi: 10.1016/j.heares.2007.08.003. [DOI] [PubMed] [Google Scholar]
- Insanally MN, Kover H, Kim H, Bao S. Feature-dependent sensitive periods in the development of complex sound representation. J Neurosci. 2009;29:5456–5462. doi: 10.1523/JNEUROSCI.5311-08.2009. [DOI] [PMC free article] [PubMed] [Google Scholar]
- Irvine DR, Rajan R, Smith S. Effects of restricted cochlear lesions in adult cats on the frequency organization of the inferior colliculus. J Comp Neurol. 2003;467:354–374. doi: 10.1002/cne.10921. [DOI] [PubMed] [Google Scholar]
- Kacelnik O, Nodal FR, Parsons CH, King AJ. Training-induced plasticity of auditory localization in adult mammals. PLoS Biol. 2006;4:e71. doi: 10.1371/journal.pbio.0040071. [DOI] [PMC free article] [PubMed] [Google Scholar]
- Kamke MR, Brown M, Irvine DR. Plasticity in the tonotopic organization of the medial geniculate body in adult cats following restricted unilateral cochlear lesions. J Comp Neurol. 2003;459:355–367. doi: 10.1002/cne.10586. [DOI] [PubMed] [Google Scholar]
- Keuroghlian AS, Knudsen EI. Adaptive auditory plasticity in developing and adult animals. Prog Neurobiol. 2007;82:109–121. doi: 10.1016/j.pneurobio.2007.03.005. [DOI] [PubMed] [Google Scholar]
- Kim G, Kandler K. Elimination and strengthening of glycinergic/GABAergic connections during tonotopic map formation. Nat Neurosci. 2003;6:282–290. doi: 10.1038/nn1015. [DOI] [PubMed] [Google Scholar]
- Kujawa SG, Liberman MC. Adding insult to injury: cochlear nerve degeneration after “temporary” noise-induced hearing loss. J Neurosci. 2009;29:14077–14085. doi: 10.1523/JNEUROSCI.2845-09.2009. [DOI] [PMC free article] [PubMed] [Google Scholar]
- Lanphear BP, Byrd RS, Auinger P, Hall CB. Increasing prevalence of recurrent otitis media among children in the United States. Pediatrics. 1997;99:E1. doi: 10.1542/peds.99.3.e1. [DOI] [PubMed] [Google Scholar]
- Li RW, Klein SA, Levi DM. Prolonged perceptual learning of positional acuity in adult amblyopia: perceptual template retuning dynamics. J Neurosci. 2008;28:14223–14229. doi: 10.1523/JNEUROSCI.4271-08.2008. [DOI] [PMC free article] [PubMed] [Google Scholar]
- McRae PA, Rocco MM, Kelly G, Brumberg JC, Matthews RT. Sensory deprivation alters aggrecan and perineuronal net expression in the mouse barrel cortex. J Neurosci. 2007;27:5405–5413. doi: 10.1523/JNEUROSCI.5425-06.2007. [DOI] [PMC free article] [PubMed] [Google Scholar]
- Melcher JR, Kiang NY. Generators of the brainstem auditory evoked potential in cat. III: Identified cell populations. Hear Res. 1996;93:52–71. doi: 10.1016/0378-5955(95)00200-6. [DOI] [PubMed] [Google Scholar]
- Mioche L, Singer W. Chronic recordings from single sites of kitten striate cortex during experience-dependent modifications of receptive-field properties. J Neurophysiol. 1989;62:185–197. doi: 10.1152/jn.1989.62.1.185. [DOI] [PubMed] [Google Scholar]
- Mogdans J, Knudsen EI. Early monaural occlusion alters the neural map of interaural level differences in the inferior colliculus of the barn owl. Brain Res. 1993;619:29–38. doi: 10.1016/0006-8993(93)91593-h. [DOI] [PubMed] [Google Scholar]
- Moore DR, Hine JE, Jiang ZD, Matsuda H, Parsons CH, King AJ. Conductive hearing loss produces a reversible binaural hearing impairment. J Neurosci. 1999;19:8704–8711. doi: 10.1523/JNEUROSCI.19-19-08704.1999. [DOI] [PMC free article] [PubMed] [Google Scholar]
- Moore DR, Hutchings ME, Meyer SE. Binaural masking level differences in children with a history of otitis media. Audiology. 1991;30:91–101. doi: 10.3109/00206099109072874. [DOI] [PubMed] [Google Scholar]
- Nodal FR, Kacelnik O, Bajo VM, Bizley JK, Moore DR, King AJ. Lesions of the auditory cortex impair azimuthal sound localization and its recalibration in ferrets. J Neurophysiol. 2009 doi: 10.1152/jn.00991.2009. [DOI] [PMC free article] [PubMed] [Google Scholar]
- Petkov CI, O’Connor KN, Sutter ML. Encoding of illusory continuity in primary auditory cortex. Neuron. 2007;54:153–165. doi: 10.1016/j.neuron.2007.02.031. [DOI] [PMC free article] [PubMed] [Google Scholar]
- Pillsbury HC, Grose JH, Hall JW., 3rd Otitis media with effusion in children. Binaural hearing before and after corrective surgery. Arch Otolaryngol Head Neck Surg. 1991;117:718–723. doi: 10.1001/archotol.1991.01870190030008. [DOI] [PubMed] [Google Scholar]
- Polley DB, Hillock AR, Spankovich C, Popescu MV, Royal DW, Wallace MT. Development and plasticity of intra- and intersensory information processing. J Am Acad Audiol. 2008;19:780–798. doi: 10.3766/jaaa.19.10.6. [DOI] [PMC free article] [PubMed] [Google Scholar]
- Polley DB, Read HL, Storace DA, Merzenich MM. Multiparametric auditory receptive field organization across five cortical fields in the albino rat. J Neurophysiol. 2007;97:3621–3638. doi: 10.1152/jn.01298.2006. [DOI] [PubMed] [Google Scholar]
- Polley DB, Steinberg EE, Merzenich MM. Perceptual learning directs auditory cortical map reorganization through top-down influences. J Neurosci. 2006;26:4970–4982. doi: 10.1523/JNEUROSCI.3771-05.2006. [DOI] [PMC free article] [PubMed] [Google Scholar]
- Poon PW, Chen X. Postnatal exposure to tones alters the tuning characteristics of inferior collicular neurons in the rat. Brain Res. 1992;585:391–394. doi: 10.1016/0006-8993(92)91243-8. [DOI] [PubMed] [Google Scholar]
- Razak KA, Fuzessery ZM. Development of functional organization of the pallid bat auditory cortex. Hear Res. 2007;228:69–81. doi: 10.1016/j.heares.2007.01.020. [DOI] [PMC free article] [PubMed] [Google Scholar]
- Razak KA, Richardson MD, Fuzessery ZM. Experience is required for the maintenance and refinement of FM sweep selectivity in the developing auditory cortex. Proc Natl Acad Sci U S A. 2008;105:4465–4470. doi: 10.1073/pnas.0709504105. [DOI] [PMC free article] [PubMed] [Google Scholar]
- Robertson D, Irvine DR. Plasticity of frequency organization in auditory cortex of guinea pigs with partial unilateral deafness. Journal of Compartive Neurology. 1989;282:456–471. doi: 10.1002/cne.902820311. [DOI] [PubMed] [Google Scholar]
- Sanes DH, Bao S. Tuning up the developing auditory CNS. Curr Opin Neurobiol. 2009 doi: 10.1016/j.conb.2009.05.014. [DOI] [PMC free article] [PubMed] [Google Scholar]
- Sanes DH, Constantine-Paton M. The sharpening of frequency tuning curves requires patterned activity during development in the mouse, Mus musculus. J Neurosci. 1985;5:1152–1166. doi: 10.1523/JNEUROSCI.05-05-01152.1985. [DOI] [PMC free article] [PubMed] [Google Scholar]
- Sawtell NB, Frenkel MY, Philpot BD, Nakazawa K, Tonegawa S, Bear MF. NMDA receptor-dependent ocular dominance plasticity in adult visual cortex. Neuron. 2003;38:977–985. doi: 10.1016/s0896-6273(03)00323-4. [DOI] [PubMed] [Google Scholar]
- Schappert S. National Center for Health Care Statistics: advance data Number 214. 1992. Office visits for otitis media: United States, 1975–90. [PubMed] [Google Scholar]
- Silverman MS, Clopton BM. Plasticity of binaural interaction. I. Effect of early auditory deprivation. J Neurophysiol. 1977;40:1266–1274. doi: 10.1152/jn.1977.40.6.1266. [DOI] [PubMed] [Google Scholar]
- Smith ZD, Gray L, Rubel EW. Afferent influences on brainstem auditory nuclei of the chicken: n. laminaris dendritic length following monaural conductive hearing loss. J Comp Neurol. 1983;220:199–205. doi: 10.1002/cne.902200207. [DOI] [PubMed] [Google Scholar]
- Suga N. The neural circuit for tone-specific plasticity in the auditory system elicited by conditioning. Learn Mem . 2008;15:198–201. doi: 10.1101/lm.791408. author reply 202–197. [DOI] [PubMed] [Google Scholar]
- Sumner CJ, Tucci DL, Shore SE. Responses of ventral cochlear nucleus neurons to contralateral sound after conductive hearing loss. J Neurophysiol. 2005;94:4234–4243. doi: 10.1152/jn.00401.2005. [DOI] [PubMed] [Google Scholar]
- Sur M, Frost DO, Hockfield S. Expression of a surface-associated antigen on Y-cells in the cat lateral geniculate nucleus is regulated by visual experience. J Neurosci. 1988;8:874–882. doi: 10.1523/JNEUROSCI.08-03-00874.1988. [DOI] [PMC free article] [PubMed] [Google Scholar]
- Tucci DL, Cant NB, Durham D. Conductive hearing loss results in a decrease in central auditory system activity in the young gerbil. Laryngoscope. 1999;109:1359–1371. doi: 10.1097/00005537-199909000-00001. [DOI] [PubMed] [Google Scholar]
- Tzounopoulos T, Kraus N. Learning to encode timing: mechanisms of plasticity in the auditory brainstem. Neuron. 2009;62:463–469. doi: 10.1016/j.neuron.2009.05.002. [DOI] [PMC free article] [PubMed] [Google Scholar]
- Wang B, Sarnaik R, Cang J. Critical period plasticity matches binocular orientation preference in the visual cortex. Neuron. 2010;65:246–256. doi: 10.1016/j.neuron.2010.01.002. [DOI] [PMC free article] [PubMed] [Google Scholar]
- Weinberger NM. Auditory associative memory and representational plasticity in the primary auditory cortex. Hear Res. 2007;229:54–68. doi: 10.1016/j.heares.2007.01.004. [DOI] [PMC free article] [PubMed] [Google Scholar]
- Xu H, Kotak VC, Sanes DH. Conductive hearing loss disrupts synaptic and spike adaptation in developing auditory cortex. J Neurosci. 2007;27:9417–9426. doi: 10.1523/JNEUROSCI.1992-07.2007. [DOI] [PMC free article] [PubMed] [Google Scholar]
- Xu H, Kotak VC, Sanes DH. Normal hearing is required for the emergence of long-lasting inhibitory potentiation in cortex. J Neurosci. 2010;30:331–341. doi: 10.1523/JNEUROSCI.4554-09.2010. [DOI] [PMC free article] [PubMed] [Google Scholar]
- Yu X, Sanes DH, Aristizabal O, Wadghiri YZ, Turnbull DH. Large-scale reorganization of the tonotopic map in mouse auditory midbrain revealed by MRI. Proc Natl Acad Sci U S A. 2007;104:12193–12198. doi: 10.1073/pnas.0700960104. [DOI] [PMC free article] [PubMed] [Google Scholar]
- Zhang LI, Bao S, Merzenich MM. Persistent and specific influences of early acoustic environments on primary auditory cortex. Nat Neurosci. 2001;4:1123–1130. doi: 10.1038/nn745. [DOI] [PubMed] [Google Scholar]
- Zhang LI, Bao S, Merzenich MM. Disruption of primary auditory cortex by synchronous auditory inputs during a critical period. Proc Natl Acad Sci U S A. 2002;99:2309–2314. doi: 10.1073/pnas.261707398. [DOI] [PMC free article] [PubMed] [Google Scholar]
- Zhang Y, Yan J. Corticothalamic feedback for sound-specific plasticity of auditory thalamic neurons elicited by tones paired with basal forebrain stimulation. Cereb Cortex. 2008;18:1521–1528. doi: 10.1093/cercor/bhm188. [DOI] [PubMed] [Google Scholar]
- Zhou X, Nagarajan N, Mossop BJ, Merzenich MM. Influences of un-modulated acoustic inputs on functional maturation and critical-period plasticity of the primary auditory cortex. Neuroscience. 2008;154:390–396. doi: 10.1016/j.neuroscience.2008.01.026. [DOI] [PMC free article] [PubMed] [Google Scholar]
Associated Data
This section collects any data citations, data availability statements, or supplementary materials included in this article.