

Abstract
Human serum albumin (HSA) was explored for use as a stationary phase and ligand in affinity microcolumns for the ultrafast extraction of free drug fractions and the use of this information for the analysis of drug-protein binding. Warfarin, imipramine, and ibuprofen were used as model analytes in this study. It was found that greater than 95% extraction of all these drugs could be achieved in as little as 250 ms on HSA microcolumns. The retained drug fraction was then eluted from the same column under isocratic conditions, giving elution in less than 40 s when working at 4.5 mL/min. The chromatographic behavior of this system gave a good fit with that predicted by computer simulations based on a reversible, saturable model for the binding of an injected drug with immobilized HSA. The free fractions measured by this method were found to be comparable to those determined by ultrafiltration, and equilibrium constants estimated by this approach gave good agreement with literature values. Advantages of this method include its speed and the relatively low cost of microcolumns that contain HSA. The ability of HSA to bind many types of drugs also creates the possibility of using the same affinity microcolumn to study and measure the free fractions for a variety of pharmaceutical agents. These properties make this technique appealing for use in drug binding studies and in the high-throughput screening of new drug candidates.
Keywords: Affinity chromatography, Affinity microcolumns, Human serum albumin, Drug-protein binding, High-throughput screening, Warfarin, Ibuprofen, Imipramine
1. Introduction
Many drugs are non-covalently bound to serum proteins or other binding agents in the circulation [1,2]. This feature makes the determination of free drug fractions and studies of binding by drugs with serum proteins a topic of great interest in clinical and pharmaceutical research [3]. Several previous methods have been developed for the measurement of drug-protein binding and free drug fractions [5–16]. Two reference methods for such work are equilibrium dialysis and ultrafiltration [1,4]. However, these techniques often involve long analysis time (e.g., equilibrium dialysis) or suffer from errors due to nonspecific interactions between the drugs or proteins and components of the analysis system (e.g., dialysis or filtration membranes). Other methods that have been used for drug-protein binding studies include nuclear magnetic resonance spectroscopy (NMR) [5–8], UV/Vis spectroscopy [9], circular dichroism [10], surface plasmon resonance (SPR) [10–15]. However, these methods also have limitations, such as potential interferences from the sample, the ability to work with only certain types of analytes, the need for analytes with suitably high concentrations or levels of binding for detection, and/or the requirement for relatively specialized equipment.
Additional methods for examining drug-protein binding include HPLC and CE methods that employ proteins as stationary phases or buffer additives (see reviews in Refs. [17–19]). These methods include numerous reports in which immobilized human serum albumin (HSA) has been used in standard-size HPLC columns for thermodynamic studies of drug-protein binding and for chiral separations [19–31]. This approach can be viewed as type of weak affinity chromatography that is used to study interactions between drugs and proteins [32–34]. More recently, affinity microcolumns that contain immobilized antibodies have been used for the ultrafast extraction and determination of free drug fractions, giving results that show good agreement with reference methods [35–37].
This report will consider the use of a general binding agent such as HSA in affinity microcolumns for the rapid extraction and measurement of free drug fractions. HSA is the most abundant serum protein and is an important binding agent for a wide range of drugs and small solutes in serum [17–19,21–23]. An advantage of using HSA in place of antibodies in affinity microcolumns for the rapid extraction of free drug fractions is the lower association equilibrium constants of drugs for HSA (103–105 M−1) vs. antibodies (106–1012 M−1) [17,18,38]. This lower binding affinity should make it possible to use isocratic elution with HSA microcolumns during the extraction and measurement of free drug fractions (see Figure 1). This feature should, in term, eliminate the time-consuming elution and regeneration steps that are often needed with immobilized antibody columns [38]. A second advantage of using HSA is the ability of this protein to bind to many different drugs [17–19,21–23], thus providing an affinity microcolumn that could be adapted for use with more than one analyte in free fraction measurements.
Figure 1.

General scheme for the separation of the free and protein-bound fractions of a drug in a sample through the use of an affinity microcolumn that contains immobilized human serum albumin (HSA).
The feasibility of using HSA microcolumns in ultrafast extraction and free fraction measurements will be examined in this work by using warfarin, ibuprofen, and imipramine as model drugs [27–30]. These drugs all have well-characterized interactions with HSA, with R- and S-warfarin also having been used previously in the initial development of antibody-based microcolumns for the ultrafast extraction and determination of free drug fractions [36]. The creation of HSA microcolumns will be described in this report and the behavior of these microcolumns will be compared with that predicted by computer simulations for the degree of free drug extraction and retention by immobilized HSA. The use of such columns in measuring free drug fractions and in examining drug-protein binding will then be considered. The results of this work should provide important clues concerning the conditions that can be employed in the use of HSA microcolumns for ultrafast extraction and in the extension of this method to other drugs or small solutes.
2. Materials and methods
2.1 Reagents
The R-(+) and S-(−)-warfarin were donated by Du Pont Pharmaceuticals (Wilmington, DE, USA). The S-(+)-ibuprofen was from Acros Organics (Morris Plains, NJ, USA). The HSA (Cohn fraction V, essentially fatty acid free) and imipramine hydrochloride were from Sigma (St. Louis, MO, USA). The Nucleosil Si-300 silica (7 μm particle diameter, 300 Å pore size) and aminopropyl Nucleosil Si-300 used to make the SMCC silica (7 μm particle diameter, 300 Å pore size) were from Macherey Nagel (D ren, Germany). The succinimidyl 4-(N-maleimidomethyl)cyclohexane-1-carboxylate (SMCC) and reagents for the bicinchoninic acid (BCA) protein assay were from Pierce (Rockford, IL, USA). All aqueous solutions were prepared using water from a Nanopure water system (Barnstead, Dubuque, IA, USA) and filtered using Osmonics 0.22 μm nylon filters from Fisher (Pittsburgh, PA, USA).
2.2 Apparatus
The affinity microcolumns were packed using a LC-10 AT pump from Shimadzu (Columbia, MD, USA) and a Rheodyne six port manual valve (Cotati, CA, USA) equipped with a 200 μL sample loop. The system used in the chromatographic studies consisted of a Shimadzu LC-10 AD pump and a Shimadzu RF-535 fluorescence detector, with samples being injected using a Rheodyne LabPro valve and 1.1 μL sample loop. Chromatographic data were collected and processed using in-house programs written in LabView 5.1 (National Instruments, Austin, TX, USA). The ultrafiltration studies were performed using a Sorvall RC 5B Plus centrifuge with temperature control from DuPont (Wilmington, DE, USA).
2.3 Column preparation
The stationary phase in these studies consisted of immobilized HSA on Nucleosil Si-300 silica particles. The Schiff base immobilization technique (i.e., an amine-based coupling technique) and the SMCC technique (i.e, a method which couples proteins through free sulfhydryl groups) were performed according to the literature [39,40]. Control supports were prepared in the same manner but with no HSA being added during the immobilization step. The protein contents of the final HSA supports were determined in triplicate by a BCA assay using HSA as the standard and the control support as the blank, giving 49 (± 6) mg HSA/g silica (± 1 S.D.) for the Schiff base method and 46 (± 1) mg HSA/g silica for the SMCC method.
An HPLC pump was used to pack 4.5 × 2.1 mm i.d. columns when using the Schiff base method, and similar 2.5 or 3.5 mm long columns for the SMCC method. A special column housing was used to hold this small column, as described in Ref. [41]. These columns were packed according to procedures given in Ref. [36] and gave a packing density for the supports of 0.49 g/mL. The packing solution was pH 7.4, 0.067 M potassium phosphate buffer, and the packing pressure was 2500 psi.
2.4 Chromatographic studies
The mobile phase was pH 7.4, 0.067 M potassium phosphate buffer. All samples were prepared in this buffer and allowed to incubate for at 25°C at least 15 min prior to injection. The relatively fast association and dissociation kinetics that are typical of these drug-protein interactions [8,24,28] made this period of time more than sufficient to reach equilibrium in the samples prior to analysis. All injections made in this study were done in triplicate. In the initial work conducted with HSA microcolumns prepared by the Schiff base method, the enantiomers of warfarin were detected by monitoring their fluorescence emission at 445 nm when using an excitation wavelength of 310 nm; the samples used in these studies contained 8.5–10.0 μM R- or S-warfarin and 0.0 μM or 20.0 μM HSA (note: the sample concentrations used in this particular study were chosen based on the detection limits of the given drugs and in keeping with the goal of using the proposed method for screening drug-protein binding and obtaining simple measurements of binding affinity with HSA). In later work using HSA microcolumns prepared by the SMCC method, wavelengths utilized for the absorbance detection of warfarin, imipramine, and ibuprofen were 310 nm, 251 nm, and 225 nm, respectively. The samples in this second group of studies contained approximately 20.0 μM S-warfarin plus 0.0 μM or 25.0 μM HSA, or 40.0 μM S-ibuprofen or imipramine plus 0.0 μM or 45.0 μM HSA. All columns were enclosed in water jackets for temperature control. All chromatographic work in this study was performed at 25 (± 1) °C. The retention times and peak areas were measured by using Peakfit 4.12 (Systat Software, San Jose, CA, USA). The residence time of a non-retained solute was determined by making injections of a 20.0 μM sample of sodium nitrate onto the HSA columns at each tested flow rate.
2.5 Ultrafiltration studies
Centricon centrifugal filters containing an Ultracel YM-3 membrane (3000 MW cut-off) were purchased from Millipore (Billerica, MA, USA). All samples measured by ultrafiltration were examined in triplicate. Before introduction of the sample, each of these filtration devices was filled with 2 mL of pH 7.4, 0.067 M potassium phosphate buffer. The membrane was washed by spinning the filtration device at 5000 × g until more than 1.8 mL of the pH 7.4 buffer had passed into the filtrate vial, a process which took approximately 2 h. To remove the remaining buffer, the device was inverted and spun at 1000 × g for about 1 min. Immediately after this washing process, 1 mL portions of the desired drug solution or drug/protein sample were introduced into three centrifugal filters and capped to avoid evaporation. These samples were spun in the centrifugal filters at 7500 × g and 25 °C for 45 min. The filtrates were collected and their contents were analyzed by HPLC. This analysis was conducted by making three 20 μL injections of each sample at 1.0 mL/min under isocratic conditions using pH 7.4, 0.067 M potassium phosphate buffer as the mobile phase and a standard HSA column prepared in the same method as described earlier [39]. The elution of these drugs was detected by using the same conditions for fluorescence or absorbance measurements as described in Section 2.4. The concentration of drug in each filtrate was determined by comparing the measured peak area for the filtrate to that obtained under the same conditions for standards containing the desired drug. In each case, the standards were pretreated by ultrafiltration in the same manner as the samples to correct for any non-specific binding of the drug to the ultrafiltration membranes.
2.6 Chromatographic simulations
Simulations of drug extraction and elution on HSA microcolumns were conducted using programs written in Matlab R14SP3 (Mathworks, Nattick, MA, USA). These simulations were based on a grid propagation algorithm and saturable binding with second-order association kinetics, as used previously to examine the ultrafast extraction of analytes by immobilized antibodies in affinity microcolumns [36], but with reversible binding between the analyte and ligand now being present. The simulations were typically conducted with a column divided into 50 slices of equal width, with no significant differences being noted when using up to 150 slices per column. The association equilibrium constants and association/dissociation rate constants employed in these simulations were based on literature values for the binding of R- and S-warfarin with immobilized HSA under the same buffer and temperature conditions as used in this report [42,43]. Other adjustable parameters (e.g., column size, amount of immobilized ligand, and flow rate) were selected based on the experimental conditions employed in this study.
It was assumed in these simulations that mass transfer of the analyte between the flowing mobile phase and stagnant mobile phase (i.e., as based diffusion) was much faster than the rates of analyte association and dissociation with the immobilized ligand. This assumption was supported by previous kinetic studies of R- and S-warfarin on immobilized HSA columns [43]. During the simulation, this situation was modeled by first allowing the analyte to partition between the flowing mobile phase and stagnant mobile phase regions of each slice using a local equilibrium model and a 1:1 volume ratio for these two regions (i.e., the approximate volume ratio present for the support used in this report, based on data from the manufacturer). Association and dissociation of the analyte with the immobilized ligand in contact with the stagnant mobile phase region of each slice was then allowed to occur, as described by using mass balance and differential equations for reversible second-order association and first-order dissociation reactions. The moles of analyte in the mobile phase and stationary phase regions of each slice and during each interval of time during the simulation were determined by using these equations and the ODE15S ordinary differential equation solving algorithm in MATLAB [44,45]. Flow through the column was modeled by moving the analyte in the flowing mobile phase region of one slice into the same region of the next slice after each iteration of the simulation. The amount of analyte eluting from the last slice of the column was monitored and used to generate the simulated chromatograms.
3. Results and discussion
3.1 Initial selection of conditions
The general scheme examined in this report for the measurement of free drug fractions is shown in Figure 1. In this scheme, the injection of a mixture containing a drug and HSA (or other binding protein) onto an HSA microcolumn and under appropriate flow rate conditions gives a non-retained peak for a drug-protein complex, while the free drug fraction is extracted and retained by the column. The result is a separation of the free and protein-bound drug fractions in the sample. According to this scheme, the area of the peak due to the free drug fraction can be measured and compared to injections for standards to determine the free drug concentration in the original sample. If the time allowed for this extraction and separation is sufficiently small, it should be possible with this approach to avoid any appreciable errors in this measurement due to dissociation of drug-protein complexes in the sample as these complexes pass through the column [36,39,46].
The approach shown in Figure 1 was initially evaluated by using R- and S-warfarin as model analytes. It has been noted in previous modeling studies for the warfarin/HSA system that an extraction time of less than a few hundred milliseconds is needed to avoid significant dissociation of R- and S-warfarin from soluble HSA during the isolation of free fractions for these drugs by antibody microcolumns [36]. Similar time scales for ultrafast affinity extraction have been calculated and observed for other drugs and hormones [39,46]. Based on previous equilibrium and rate constants reported for the binding and dissociation of R- and S-warfarin with HSA [42,43], the same types of calculations were conducted in this current study. In a worse-case scenario (e.g., a case with no re-association of drug released from proteins in the sample and complete extraction of the released drugs) [36], less than 10–15% error was predicted in the measured free fractions for R- and S-warfarin in the tested warfarin/HSA mixtures when using an extraction time of approximately 300 ms or less. Similar column residence times were used for the other drugs examined in this study. For example, an injection flow rate of 4.5 mL/min on a 4.5 mm × 2.1 mm i.d. HSA microcolumn was determined experimentally to give an effective extraction time and column residence time of approximately 250 ms for a non-retained solute in the HSA microcolumns.
The HSA microcolumns prepared in this study were first tested for their ability to extract R- and S-warfarin in this desired time domain. The injected samples consisted of 1.1 μL injections containing up to 8.5 μM S-warfarin or 10 μM R-warfarin. These sample conditions corresponded to an amount of injected analyte that was less than 0.18% of the estimated column binding capacity, or more than a 580-fold mol excess of HSA versus S- or R-warfarin. At all flow rates used in this study (i.e., 0.5 to 5.0 mL/min), more than 95% extraction occurred for both R- and S-warfarin in the absence of any soluble HSA. This result confirmed it was possible to use HSA microcolumns (in this case, a 4.5 mm × 2.1 mm i.d. column) to quantitatively remove these drugs from injected samples on the time scale of a few hundred milliseconds.
The next set of studies examined the ability of HSA microcolumns to separate the free and protein-bound fractions of R- and S-warfarin in mixtures of these drugs with an excess of soluble HSA. Figure 2 shows some representative chromatograms obtained for R-warfarin; similar results were noted for S-warfarin. The peak in Figure 2(a) was obtained by injecting only R-warfarin onto an HSA microcolumn. It was noted that essentially all of the R-warfarin was extracted and removed from the non-retained peak, which appeared at an elution time of 2–4 s on a control column. The retained R-warfarin was then later eluted from the HSA microcolumn under the same mobile phase and flow rate conditions. This retained peak had a maximum at approximately 15–17 s, with all the retained drug being eluted within 35–40 s.
Figure 2.

Typical chromatograms obtained at 4.5 mL/min for 1.1 μL injections of (a) 10 μM R-warfarin onto an HSA microcolumn, (b) 20.0 μM HSA plus 10.0 μM R-warfarin onto an HSA microcolumn, or (c) 20.0 μM HSA plus 10.0 μM R-warfarin onto a control column. The HSA microcolumn was prepared by the Schiff base method. The size of both this column and the control column was 4.5 mm × 2.1 mm i.d. Other conditions are given in the text.
Figure 2(b) shows the results when the same amount of R-warfarin was injected onto an HSA microcolumn in a sample that now contained an excess of soluble HSA. In this case, a large non-retained peak was noted at 2–5 s due to soluble HSA in the sample and the non-extracted complex of R-warfarin with this HSA. The second, smaller peak that eluted later with a maximum at 17–18 s represents R-warfarin that was extracted by the HSA microcolumn and that presumably represented the free fraction of R-warfarin in the sample. Sufficient resolution was obtained between the non-retained and retained peaks in this separation to allow the extracted fraction of R-warfarin to be measured. Figure 2(c) shows a chromatogram obtained when the same mixture of R-warfarin and soluble HSA was injected onto an inert control column. In this case, only a non-retained peak was noted, indicating that neither R-warfarin nor HSA, as well as the corresponding complex of R-warfarin with soluble HSA, had any appreciable non-specific interactions with the support. Similar results were obtained for S-warfarin at the flow rates used in this study (e.g., see Section 3.4).
3.2 Simulations of free drug extraction and retention using HSA microcolumns
The extraction and retention behavior noted experimentally for R- and S-warfarin on HSA microcolumns were compared to theoretical chromatographic simulations of this system. These simulations made use a reversible, saturable model for binding of the injected drugs with immobilized HSA. The equilibrium and rate constants utilized in these simulations were based on measured values obtained for immobilized HSA that had been prepared according to the same general approach as employed in this current study [42,43]. The column size, amount of immobilized HSA, sample content, and flow rates employed in these simulations were selected based on the experimental conditions used in the previous section of this report.
Figure 3(a) shows the simulation results for R-warfarin under the conditions used to obtain the experimental data in Figure 2. A comparison of these results indicates there was agreement between the experimental data and simulated chromatograms. Similar agreement between the experimental and simulated data was noted for S-warfarin (data not shown). Based on these simulations, it was confirmed that more than 95% extraction of the free drug fractions for R- and S-warfarin should have occurred at the flow rates used in this report with the HSA microcolumns. It was also confirmed that the extracted and retained portion of these drugs would later elute under isocratic conditions in the presence of the pH 7.4 application buffer.
Figure 3.
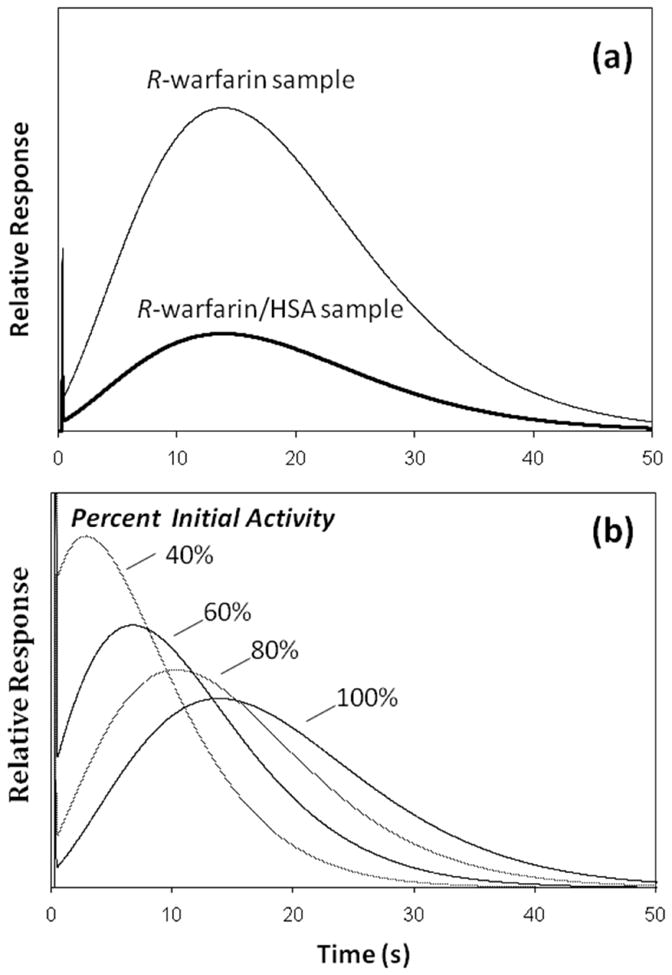
Simulated chromatograms for the binding and elution of samples containing R-warfarin on an HSA microcolumn. The results in (a) show the predicted response for the injection of R-warfarin or a mixture of R-warfarin and HSA onto an HSA microcolumn at 25 °C and pH 7.4 under the same sample, column, and flow rate conditions as were present for the experimental results shown in Figure 2. The R-warfarin/HSA sample used in these simulations had 30% R-warfarin in the free form, in line with experimental results presented later in this report. Estimates of the activity for the original immobilized HSA (i.e., around 70–75%) were based on previous data from the literature for similar columns [8,13]. The plots in (b) show how the peak for the retained fraction of R-warfarin would be expected to change under these same conditions as the relative amount of active protein is decreased by 80%, 60% or 40% of its initial value. Further details on the simulation model can be found in the Experimental section.
Good agreement was also noted in the relative shape and position of the retained peaks in the experimental and simulated chromatograms, as can be seen by comparing the results for R-warfarin in Figures 2 and 3(a). This observation indicated that a reversible, saturable model for drug association and dissociation gave a reasonable description of the retention and elution that was actually noted for R- and S-warfarin on the HSA microcolumns. The good fit of this model to the experimental data further indicated that the broad nature of the retained peaks for R- and S-warfarin was mainly related to the kinetics of dissociation and association for these drugs with the immobilized HSA (i.e., stationary phase mass transfer) rather than to stagnant mobile phase mass transfer under the conditions used in these experiments. However, sufficient resolution was still obtained in this study between the peaks for the retained and non-retained fractions of these analytes to make free drug fraction measurements possible with the HSA microcolumns.
Along with column size and flow rate, the amount of active ligand in an affinity microcolumn is another factor that was found to be important in determining the final degree of resolution that is obtained between retained and non-retained drug fractions. The effect of varying this parameter is illustrated in Figure 3(b). As the amount of active ligand (e.g., immobilized HSA) was decreased in the simulations, there was a corresponding decrease in the peak elution time for the retained drug. This shift resulted in lower resolution and greater overlap with the non-retained sample components. In addition, these results indicate that an increase in the amount of active ligand within an affinity microcolumn would be expected to lead to higher retention and resolution between the retained and non-retained fractions in a sample. Further studies are now underway to improve the amount of active ligand within such columns as a means for expanding the range of drugs that can be examined by this approach.
The data in Figure 3(b) demonstrate the need to have affinity microcolumns that are sufficiently stable in their activity to avoid shifts in retention during the analysis of free drug fractions. This was not a problem in this current study because the particular type of immobilized HSA support that was employed has been shown in many previous reports to be quite stable over a relatively long period of time (e.g., typically more than six months and over 500 sample injections) [17,42,43,47]. The microcolumns employed in this report were used over a much shorter period of time, which explains why significant shifts in the position of the retained drug peaks were not noted experimentally. Even if such changes did occur, these shifts could have been detected by making routine injections of control drug samples, with a new HSA microcolumn then being placed into the system as needed.
3.3 Analysis of free drug fractions
Based on results such as shown in Figure 2, it was possible to calculate the free fraction of R-warfarin or S-warfarin in samples containing these drugs and soluble HSA. For example, this was accomplished by dividing the retained peak area in Figure 2(b) (representing the free fraction of R-warfarin) by the total peak area for the same drug in Figure 2(a) in the absence of any soluble HSA. In this case, the chromatogram obtained for a mixture of R-warfarin and HSA on the control column, as given in Figure 2(c), was also used to make a small correction for any overlap that was present between the retained peak for R-warfarin in Figure 2(b) and the non-retained peak for HSA plus the complex of R-warfarin with soluble HSA in the injected samples.
The effect of flow rate on this type of free fraction measurement was considered during the optimization of this method. It is known from earlier work with antibody-based microcolumns that using low flow rates for sample injection will allow for a maximum level of drug extraction, but low flow rates also increase the amount of time over which the protein-bound form of an analyte in a sample can dissociate. This situation is undesirable because it can lead to a positive error in free fraction measurements [36,39,46]. This second effect is illustrated in Figure 4 for ultrafast extraction on a 4.5 mm × 2.1 mm i.d. HSA microcolumn when using samples that contained 8.5 μM S-warfarin and 20 μM HSA. The degree of extraction for S-warfarin in the absence of soluble HSA was 95% at all of the flow rates in this plot, as discussed earlier. As expected, the size of the apparent free fraction measured for S-warfarin increased as the injection flow rate was decreased and longer times were allowed for dissociation of S-warfarin from soluble HSA. It was also noted in Figure 4 that this effect was not significant when an injection flow rate of 4.0 mL/min or higher was used on a 4.5 mm × 2.1 mm i.d. HSA microcolumn. Similar results were obtained for R-warfarin. Based on this information, a flow rate of at least 4.0 mL/min (i.e., an extraction time of 280 ms or less) was used in all further free fraction determinations made in this report on 4.5 mm × 2.1 mm i.d. HSA microcolumns.
Figure 4.

Effect of flow rate on the apparent free fractions measured for S-warfarin in samples containing soluble HSA and injected onto an HSA microcolumn. These results were obtained for 1.1 μL injections of a sample containing 20.0 μM HSA plus 8.5 μM S-warfarin. The HSA microcolumn was prepared by the Schiff base method and had a size of 4.5 mm × 2.1 mm i.d. Other conditions are given in the text.
Table 1 shows some free fractions that were measured on these HSA microcolumns (prepared by the Schiff base method) for R- and S-warfarin in the presence of excess soluble HSA. The free fractions measured by ultrafiltraiton for the same samples are also provided. The results obtained by ultrafast extraction in this case were acquired using a 4.5 mm × 2.1 mm i.d. HSA column operated at 4.5 mL/min (i.e., an extraction time of 250 ms). It was found under these conditions that the free fractions measured for both R- and S-warfarin by ultrafiltration and ultrafast extraction using HSA microcolumns were statistically identical, giving values that agreed within 10% and ± 1 S.D. The precision of these two methods was also comparable, with relative standard deviations of ±7–10% and ±15–16%, respectively, for the results in Table 1.
Table 1.
Free drug fractions measured for mixtures of various drugs with soluble HSA
| Measured free fractiona | ||
|---|---|---|
| Immobilization Method & Sample | HSA microcolumns (Ultrafast extraction) | Ultrafiltration (Reference method) |
| Schiff Base Method | ||
| S-Warfarin + HSA | 0.20 (± 0.03) | 0.20 (± 0.02) |
| R-Warfarin + HSA | 0.31 (± 0.05) | 0.28 (± 0.02) |
| SMCC Method | ||
| S-Warfarin + HSA | 0.23 (± 0.02) | 0.21 (± 0.03) |
| S-Ibuprofen + HSA | 0.28 (± 0.02) | 0.25 (± 0.07) |
| Imipramine + HSA | 0.92 (± 0.02) | 0.86 (± 0.07) |
These values were measured for the given samples at 25 °C in pH 7.4, 0.067 M potassium phosphate buffer. The numbers in parentheses represent a range of ± 1 S.D. The sample concentrations and other conditions are given in Section 2.
One potential advantage of using HSA microcolumns and ultrafast extraction for this type of measurement is the ability of this approach to rapidly examine individual samples. For example, in this study the time required for one sample injection at 4.5 mL/min on the 4.5 mm × 2.1 mm i.d. HSA microcolumn was less than 1 min (i.e., 40 s in Figure 2). The total time needed for single injections of a sample and standard was 1.5–2 min, and the time needed for the triplicate analysis of both the sample and standard was 4–6 min. The total time needed for comparable ultrafiltration studies in this report was 64 min for single measurements of the sample and standard and 72 min for triplicate analyses of the sample and standard. This latter period of time included both the ultrafiltration step and the time needed for sequential analysis of samples and standards on an HPLC column. Besides being much faster, the HSA microcolumn was also more convenient to use than ultrafiltration in free fraction measurements because all operations on the sample were conducted in a single step. In contrast to this, the ultrafiltration method required separate steps for the isolation of free drug fractions and for their measurement.
3.4 Extension of method to other drugs
The next stage of this research examined the use of HSA microcolumns with other drugs. Both ibuprofen and imipramine were considered in this study because these drugs also have relatively well-characterized binding to HSA (note: only the S-enantiomer of ibuprofen was used in this current study for the sake of cost and because R- and S-ibuprofen have similar affinities in their binding to HSA) [29]. Neither of these drugs has any appreciable fluorescence, so one modification that was made in the method was the use of absorbance detection to monitor the free drug fractions that were captured and later eluted from the HSA microcolumns. Shorter HSA microcolumns with a higher relative level of active HSA were also used to provide good retention while also allowing free fraction measurements to be made at more reasonable flow rates that were utilized in the initial studies with R- and S-warfarin. This second modification was made to allow higher resolution to be obtained between the non-retained and retained peaks on the HSA microcolumns, thus making it easier to measure free fractions for drugs like imipramine and ibuprofen that have weaker binding to HSA than warfarin [27–30].
The affinity microcolumns used in this second round of studies were 2.0 or 3.0 mm long with an inner diameter of 2.1 mm and contained HSA that had been immobilized by the SMCC method. This immobilization scheme selectively couples HSA through its lone free cysteine (Cys-34), an amino acid that is in a part of this protein that is distant from both of the major drug binding sites. The result is a preparation of immobilized HSA that has a significant improvement in its overall level of activity (i.e., an observed 1.6-fold increase) versus a general amine-based coupling method such as the Schiff base method [40]. The higher relative activity that this change in immobilization scheme provided made it possible to prepare shorter HSA microcolumns without a significant loss in binding capacity, extraction efficiency or in the level of retention that was seen on such columns. Under the sample conditions that were used in this study, the amount of each drug that was applied to these small HSA microcolumns was between 13% and 20% of the estimated column binding capacity, which still provided at least a five-fold mol excess of HSA versus the drug that was applied in each sample.
Figure 5 shows some typical chromatograms obtained in free drug measurements when using HSA microcolumns prepared by the SMCC method. The results shown here for S-warfarin and imipramine where obtained on 2.5 mm × 2.1 mm i.d. HSA microcolumns at 2.0 mL/min and 3.0 mL/min, respectively. Preliminary studies with warfarin, imipramine and ibuprofen indicated that at least 95% of the free fractions of all these analytes were extracted by these HSA microcolumns under such conditions. The smaller length of these columns versus those used earlier in this study made it possible to use slightly lower flow rates and still obtain column residence times for the sample of approximately 300 ms or less (i.e., 208–318 ms for the examples shown in Figure 5; column residence times up to 350 ms were found to also be effective in the analysis of S-ibuprofen). Although the use of flow rates in the range of 2.0 to 3.0 mL/min did increase the elution times needed for the retained drug fractions up to 120–150 s for the most highly retained analytes (e.g., S-warfarin), retention times at higher flow rates were similar to those in the work with HSA microcolumns prepared by using the Schiff base (see Section 3.1–3.3). The free fractions measured for various mixtures of these drugs with HSA are listed in Table 1. Good agreement was again seen between the results that were measured with the HSA microcolumns that those that were determined by ultrafiltration. For each drug that was tested, these values agreed within ± 1 S.D and had a relative difference of only 6–10%.
Figure 5.

Chromatograms obtained on 2.5 mm × 2.1 mm i.d. HSA microcolumns that had been prepared by the SMCC method. The results shown in (a) were obtained at 2.0 mL/min for 20 μL samples of 20.6 μM S-warfarin or 20.6 μM S-warfarin plus 25.0 μM HSA. The results shown in (b) were obtained at 3.0 mL/min for 40.0 μM imipramine or 40.0 μM imipramine plus 45.0 μM HSA. Other conditions are given in the text.
The smaller HSA microcolumns prepared by the SMCC method allowed for improved resolution in the isolation of free drug fractions through at least two effects. First, the use of shorter columns with a decreased void volume allowed for faster removal of the non-retained protein and drug-protein complex. There was also an apparent increase in resolution for these shorter affinity microcolumns at the lower flow rates at which they could be operated versus the affinity microcolumns made earlier by the Schiff base method (e.g., see Figures 1 versus 5). The reason for this improvement in resolution is believed to be due to the relatively sharp increase in plate height that occurs when working at high flow rates in this type of HSA column [23,48,49], which results in part from the importance of stationary phase mass transfer within such columns (e.g., see discussion in Section 3.2). As a result, the ability to use even slightly lower flow rates for this particular analysis should have resulted in a smaller plate heights and better column efficiency even through the overall column length had been reduced. Further studies examining this effect are currently being performed, but the net result was that the shorter and more active HSA microcolumns were easier to use in work with drugs that were detected through absorbance measurements and that had lower affinities than R- or S-warfarin for HSA.
3.5 Estimation of association equilibrium constants
HSA microcolumns were next tested for use in estimating the association equilibrium constant (Ka) for a drug-protein interaction. This was accomplished by using the free fraction data acquired on these columns along with the following equation that describes a drug and protein interaction that involves 1:1 binding.
| (1) |
Eq 1 is simply an expanded form of the equilibrium expression for the reaction of drug D with protein P, in which [D-P] is the concentration of the drug-protein complex in the sample, Cd is the total concentration of drug in the original sample (including both the free and protein-bound fractions), and Cp is the total concentration of protein in the sample. The value of [D-P] in this case can be calculated from the measured free fraction (F) as shown below.
| (2) |
Comparable equations can be derived for more complex drug-protein interactions.
Table 2 shows the Ka values determined for the various tested drugs with soluble HSA by using eqs 1–2 and data acquired with the HSA microcolumns. These results again gave a good match with values estimated from ultrafiltration data, with Ka values that differed by less than 15% and overlapped within ± 1 S.D. In addition, the association equilibrium constants determined for R- and S-warfarin using HSA microcolumns agreed within ± 2 S.D. and differed by only 9–35% versus literature values for a study that examined the interactions of R- and S-warfarin with immobilized HSA at the same pH and temperature used in this current report [42].
Table 2.
Association equilibrium constants measured for various drugs with soluble HSA
| Immobilization Method & System Studied | Apparent Association Equilibrium Constant, Ka (M−1)a | |||
|---|---|---|---|---|
| Ultrafast Extraction | Ultrafiltration | Literature Value | [Ref.] | |
| Schiff base Method | ||||
| R-Warfarin binding to HSA | 1.7 (± 0.4) × 105 | 2.0 (± 0.3) × 105 | 2.6 (± 0.1) × 105 | [28] |
| S-Warfarin binding to HSA | 3.1 (± 0.6) × 105 | 3.1 (± 0.4) × 105 | 3.4 (± 0.1) × 105 | [28] |
| SMCC Method | ||||
| S-Warfarin binding to HSAa | 3.4 (± 0.5) × 105 | 4.1 (± 0.7) × 105 | 3.4 (± 0.1) × 105 | [28] |
| S-Ibuprofen binding to HSAb | 1.6 (± 0.3) × 105 | 2.0 (± 0.4) × 105 | 1.1–1.2 × 10⁵ | [29] |
| Imipramine binding to HSA | 2.1 (± 0.3) × 103 | 4.1 (± 0.2) × 103 | 1.8 × 10³ | [40] |
The numbers in parentheses represent a range of ± 1 S.D. The listed values were measured at 25 °C and, except where indicated otherwise, in the presence of pH 7.4 phosphate buffer or phosphate-buffered saline. The value from Ref. [29] was measured at pH 6.9 and is the average of two similar binding sites for S-ibuprofen on HSA; the value from Ref. [40] is also a weighted average for two sets of binding sites, as obtained under conditions similar to those used in this report [30]. The values given for the HSA microcolumns and ultrafiltration are for soluble HSA. The values from Refs. [28] and [29] were obtained with immobilized HSA. The value from Ref. [40] was obtained using soluble HSA. The sample concentrations and conditions used in this current study are provided in Section 2.
It was noted in the previous section how the use of ultrafast extraction and HSA microcolumns was much faster than ultrafiltration for the determination of free drug fractions. This same feature makes the use of HSA microcolumns a more rapid means for estimating association equilibrium constants based on such data. The free drug measurements made here on HSA microcolumns were also faster than the experiments conducted for R- and S-warfarin in Ref. [42] using frontal analysis, in which 20–25 min were required per sample application. One disadvantage of using HSA microcolumns for free fraction measurements is the precision is not as high as it is when employing frontal analysis or a comparable technique (e.g., ±20–23% for the Ka values in Table 2 determined using HSA microcolumns vs. ±3–10% for the literature values).
The use of only a few data points to calculate an association equilibrium constant through free fraction measurements ideally requires that the type of binding present is known in advance. In this study, R- and S-warfarin were known to have a single high affinity site on HSA [42,43]. If such information is not available, it should be kept in mind that the estimated Ka will only be an apparent, weighted average that may reflect the contributions of multiple interactions for a more complex system. This type of estimate may be acceptable for the high-throughput screening of drug-protein binding [23,48,49], but a more detailed analysis will require additional experiments and a wider range of drug or protein concentrations to examine the desired interaction [17–19,21–23,42].
The results for S-ibuprofen and imipramine in Table 2 can be used to illustrate this last concept. For instance, S-ibuprofen has been noted to have two binding sites on HSA with similar affinities (1.1 × 10⁵ M−1 and 1.2 × 10⁵ M−1 at 25 °C) [29]; in this situation, the results shown in Table 2 for ultrafiltration and the HSA microcolumn screening method would give a weighted average of these values. A slightly more complex situation occurs in the case of imipramine, which has been shown to have a relatively high affinity site on HSA (Ka = 1.6 × 10⁵ M−1 at 37 °C) plus a large number of weaker binding regions (8–9 sites, average Ka = 1.5 × 10³ M−1 at 37 °C). In this case, the use of a single-site model and the conditions employed for imipramine and soluble HSA in Table 2 would be anticipated to give a value that is heavily weighted towards the weaker affinity sites [30]. However, it is interesting to note that the elution times seen on the HSA microcolumns for the retained, free fraction of imipramine (see Figure 5b) was consistent with a solute that has binding to HSA with an apparent Ka in the range of 105 M−1. This behavior was expected because the amount of injected, free imipramine was much lower than the amount of HSA in the microcolumn, creating retention that mainly reflected the binding of imipramine with its high affinity region on the immobilized HSA. Thus, complementary information can be obtained on a drug interaction with HSA by examining both the size of the retained free fraction and this fraction’s retention profile. This feature should be useful in future studies as a means for identifying drugs that do have more than one type of interaction with HSA, especially if these interactions have significant differences in their affinities.
4. Conclusion
It was found that ultrafast extraction based on HSA microcolumns can be used for measuring the free fractions of some drugs in drug-protein mixtures. An advantage of this method is its speed, which was approximately 40 s per injection at 4.5 mL/min in the case of R- and S-warfarin. This approach was adapted for use with other drugs and fluorescence or absorbance detection. The free fractions measured by this method gave good agreement with those determined by ultrafiltration, a common reference method for drug-protein binding studies. Association equilibrium constants determined by this approach also agreed with ultrafiltration and literature values. The availability of HSA and its low cost make this approach less expensive to perform than ultrafast extraction based on columns containing immobilized antibodies [35–37].
It was found in this study that ultrafast affinity extraction with HSA microcolumns worked well for drugs with relatively strong binding to HSA (i.e., Ka ~ 105 M−1 or greater, as occurs for R/S-warfarin, S-ibuprofen and the high affinity site of imipramine on HSA) [42,43]. Further work is now being conducted with computer simulations, other model analytes and additional optimization to allow even lower affinity drugs to be examined by this technique. The information in this report should also be useful in developing affinity microcolumns that contain other proteins for drug-binding studies. In addition, the ability of these affinity microcolumns to rapidly measure free fractions and to estimate association equilibrium constants is expected to make this technique appealing for future use in the high-throughput screening of drug candidates and in the study of drug-protein interactions [17,19,23,48,49].
Acknowledgments
This research was supported by the National Institutes of Health under grant R01 GM044931 and was conducted in facilities that were renovated under NIH grant RR015468-01.
Footnotes
Publisher's Disclaimer: This is a PDF file of an unedited manuscript that has been accepted for publication. As a service to our customers we are providing this early version of the manuscript. The manuscript will undergo copyediting, typesetting, and review of the resulting proof before it is published in its final citable form. Please note that during the production process errors may be discovered which could affect the content, and all legal disclaimers that apply to the journal pertain.
References
- 1.MacKichan JJ. J Clin Pharmacokin. 1984;9:32. doi: 10.2165/00003088-198400091-00005. [DOI] [PubMed] [Google Scholar]
- 2.Gilman AG, Rall TW, Nies AS, Taylor P. The Pharmacological Basis of Therapeutics. Pergamon Press; New York: 1990. [Google Scholar]
- 3.Herve F, Urien S, Albengres E, Duche JC, Tillement JP. Clin Pharmacokin. 1994;26:44. doi: 10.2165/00003088-199426010-00004. [DOI] [PubMed] [Google Scholar]
- 4.Kwong TC. Clin Chim Acta. 1985;151:193. doi: 10.1016/0009-8981(85)90082-8. [DOI] [PubMed] [Google Scholar]
- 5.Liu M, Nicholson JK, Lindon JC. Anal Comm. 1997;34:225. [Google Scholar]
- 6.Sun C, Huth JR, Hajduk PJ. ChemBioChem. 2005;6:1592. doi: 10.1002/cbic.200500028. [DOI] [PubMed] [Google Scholar]
- 7.Chen A, Shapiro MJ. Anal Chem. 1999;71:669A. doi: 10.1021/ac9907179. [DOI] [PubMed] [Google Scholar]
- 8.Jenkins BG, Lauffer RB. Mol Pharmacol. 1990;37:111. [PubMed] [Google Scholar]
- 9.Kandagal PB, Ashoka S, Seetharamappa J, Shaikh SMT, Jadegoud Y, Ijare OB. J Pharm Biomed Anal. 2006;41:393. doi: 10.1016/j.jpba.2005.11.037. [DOI] [PubMed] [Google Scholar]
- 10.Chuang VTG, Maruyama T, Otagiri M. Drug Metab Pharmacokinet. 2009;24:358. doi: 10.2133/dmpk.24.358. [DOI] [PubMed] [Google Scholar]
- 11.Day YSN, Myszka DG. J Pharm Sci. 2003;92:333. doi: 10.1002/jps.10293. [DOI] [PubMed] [Google Scholar]
- 12.Kuroda Y, Saito M, Sakai H, Yamaoka T. Drug Metab Pharmacokinet. 2008;23:120. doi: 10.2133/dmpk.23.120. [DOI] [PubMed] [Google Scholar]
- 13.Frostell-Karlsson A, Remaeus A, Roos H, Andersson K, Borg P, Hamalainen M, Karlsson R. J Med Chem. 2000;43:1986. doi: 10.1021/jm991174y. [DOI] [PubMed] [Google Scholar]
- 14.Karlsson R. J Mol Recog. 2004;17:151. doi: 10.1002/jmr.660. [DOI] [PubMed] [Google Scholar]
- 15.Sandblad P, Arnell R, Samuelsson J, Fornstedt T. Anal Chem. 2009;81:3551. doi: 10.1021/ac900299p. [DOI] [PubMed] [Google Scholar]
- 16.Tietz NW. Textbook of Clinical Chemistry. Saunders; Philadelphia: 1986. [Google Scholar]
- 17.Hage DS, Jackson A, Sobansky M, Schiel JE, Yoo MJ, Joseph KS. J Sep Sci. 2009;32:835. doi: 10.1002/jssc.200800640. [DOI] [PMC free article] [PubMed] [Google Scholar]
- 18.Heegaard NHH, Schou C. In: Handbook of Affinity Chromatography. 2. Hage DS, editor. Taylor & Francis/CRC Press; Boca Raton: 2006. p. 699. [Google Scholar]
- 19.Patel S, Wainer IW, Lough WJ. In: Handbook of Affinity Chromatography. Hage DS, editor. Taylor & Francis/CRC Press; Boca Raton: 2006. p. 663. [Google Scholar]
- 20.Noctor TAG, Wainer IW. J Liq Chromatogr. 1993;16:783. [Google Scholar]
- 21.Hage DS, Noctor TAG, Wainer IW. J Chromatogr A. 1995;693:23. doi: 10.1016/0021-9673(94)01009-4. [DOI] [PubMed] [Google Scholar]
- 22.Kim HS, Hage DS. J Chromatogr B. 2005;816:57. doi: 10.1016/j.jchromb.2004.11.006. [DOI] [PubMed] [Google Scholar]
- 23.Kim HS, Wainer IW. J Chromatogr B. 2008;870:22. doi: 10.1016/j.jchromb.2008.05.029. [DOI] [PMC free article] [PubMed] [Google Scholar]
- 24.Xuan H, Hage DS. Anal Biochem. 2005;346:300. doi: 10.1016/j.ab.2005.08.025. [DOI] [PubMed] [Google Scholar]
- 25.Haginaka J. J Chromatogr A. 2001;906:253. doi: 10.1016/s0021-9673(00)00504-5. [DOI] [PubMed] [Google Scholar]
- 26.Chen J, Fritos I, Hage DS. Chirality. 2005;18:24. doi: 10.1002/chir.20216. [DOI] [PubMed] [Google Scholar]
- 27.Grandison MK, Boudinot FD. Clin Pharmacokin. 2000;38:271. doi: 10.2165/00003088-200038030-00005. [DOI] [PubMed] [Google Scholar]
- 28.Haginaka J. Trends Glycosci Glycotechnol. 1997;9:399. [Google Scholar]
- 29.Kaliszan R. J Chromatogr B. 1998;715:229. doi: 10.1016/s0378-4347(98)00175-3. [DOI] [PubMed] [Google Scholar]
- 30.Mallik R, Hage DS. J Sep Sci. 2006;29:1686. doi: 10.1002/jssc.200600152. [DOI] [PubMed] [Google Scholar]
- 31.Schiel JE, Mallik R, Soman S, Joseph KS, Hage DS. J Sep Sci. 2006;29 doi: 10.1002/jssc.200500501. [DOI] [PubMed] [Google Scholar]
- 32.Ohlson S, Shoravi S, Fex T, Isaksson R. Anal Biochem. 2006;359:120. doi: 10.1016/j.ab.2006.09.007. [DOI] [PubMed] [Google Scholar]
- 33.Engstrom HA, Johansson R, Koch-Schmidt P, Gregorius K, Ohlson S, Bergstrom M. Biomed Chromatogr. 2008;22:272. doi: 10.1002/bmc.924. [DOI] [PubMed] [Google Scholar]
- 34.Ohlson S, Bergstrom M, Pahlsson P, Lundblad A. J Chromatogr A. 1997;758:199. doi: 10.1016/s0021-9673(96)00733-9. [DOI] [PubMed] [Google Scholar]
- 35.Clarke W, Hage DS. Anal Chem. 2001;73:1366. doi: 10.1021/ac000870z. [DOI] [PubMed] [Google Scholar]
- 36.Clarke W, Chowduri AR, Hage DS. Anal Chem. 2001;73:2157. doi: 10.1021/ac0009752. [DOI] [PubMed] [Google Scholar]
- 37.Jiang T, Mallik R, Hage DS. Anal Chem. 2005;77:2362. doi: 10.1021/ac0483668. [DOI] [PubMed] [Google Scholar]
- 38.Hage DS, Nelson MA. Anal Chem. 2001;73:198A. [PubMed] [Google Scholar]
- 39.Ohnmacht CM, Schiel JE, Hage DS. Anal Chem. 2006;78:7547. doi: 10.1021/ac061215f. [DOI] [PMC free article] [PubMed] [Google Scholar]
- 40.Mallik R, Wa C, Hage DS. Anal Chem. 2007;79:1411. doi: 10.1021/ac061779j. [DOI] [PMC free article] [PubMed] [Google Scholar]
- 41.Mallik R, Jiang T, Hage DS. Anal Chem. 2004;76:7013. doi: 10.1021/ac049001q. [DOI] [PubMed] [Google Scholar]
- 42.Loun B, Hage DS. Anal Chem. 1994;66:3814. doi: 10.1021/ac00093a043. [DOI] [PubMed] [Google Scholar]
- 43.Loun B, Hage DS. Anal Chem. 1996;68:1218. doi: 10.1021/ac950827p. [DOI] [PubMed] [Google Scholar]
- 44.Shampine LF, Reichelt MW. SIAM Rev. 1997;18:1. [Google Scholar]
- 45.Shampine LF, Reichelt MW, Kierzenka JA. SIAM Rev. 1999;41:538. [Google Scholar]
- 46.Clarke W, Schiel JE, Moser A, Hage DS. Anal Chem. 2005;77:1859. doi: 10.1021/ac040127x. [DOI] [PubMed] [Google Scholar]
- 47.Hage DS, Austin J. J Chromatogr B. 2000;739:39. doi: 10.1016/s0378-4347(99)00445-4. [DOI] [PubMed] [Google Scholar]
- 48.Yoo MJ, Hage DS. J Sep Sci. 2009;32:2776. doi: 10.1002/jssc.200900346. [DOI] [PMC free article] [PubMed] [Google Scholar]
- 49.Ohson S, Shoravi S, Fex T, Isaksson R. Anal Biochem. 2006;359:120. doi: 10.1016/j.ab.2006.09.007. [DOI] [PubMed] [Google Scholar]