

Abstract
The purpose of the present study was to compare the diagnostic accuracy of dual-view digital mammography (DM), single-view breast tomosynthesis (BT) and BT combined with the opposite DM view. Patients with subtle lesions were selected to undergo BT examinations. Two radiologists who are non-participants in the study and have experience in using DM and BT determined the locations and extents of lesions in the images. Five expert mammographers interpreted the cases using the free-response paradigm. The task was to mark and rate clinically reportable findings suspicious for malignancy and clinically relevant benign findings. The marks were scored with reference to the outlined regions into lesion localization or non-lesion localization, and analysed by the jackknife alternative free-response receiver operating characteristic method. The analysis yielded statistically significant differences between the combined modality and dual-view DM (p < 0.05). No differences were found between single-view BT and dual-view DM or between single-view BT and the combined modality.
INTRODUCTION
It has been reported(1) that 16–30 % of detectable cancers in screening programmes are not detected using screen-film mammography (SFM). The sensitivity of digital mammography (DM) has been shown to be equal or superior to SFM. However, the difference in most studies has not been statistically significant(2–4). One hypothesis is that the anatomic background, rather than the detector, is the limiting factor in breast cancer detection. Mammograms have normal dense structures superimposed onto a two-dimensional (2D) plane, resulting in anatomic noise that hampers breast cancer detection. The anatomic noise has been shown to have a greater impact than quantum noise on the non-detection of certain lesion types and sizes(5). Breast tomosynthesis (BT) is a promising method that separates the overlapping tissue by collecting images over a limited angular range and reconstructing image slices that contain little of the overlap noise. Accordingly, BT may improve the diagnostic performance of mammography for breast cancer detection when compared with DM. Two recent clinical pilot studies from Svahn and co-workers suggested an increased diagnostic performance of BT over DM(6,7). Two other recent studies showed an improved specificity of BT when compared with DM(8,9). The aim of the current study was to compare the diagnostic accuracy of dual-view DM, single-view BT and single-view BT combined with the opposite DM view on the same breasts (ipsilateral), for the detection of malignant lesions.
MATERIALS AND METHODS
Patient population
The study was approved by the Regional ethics vetting board at Lund University (Dnr 159/2006) and the local Radiation Safety Committee. The patients underwent informed consent and all examinations were voluntary. The selection of the cases was done by constrained selection as described elsewhere(6,10), including women with subtle, but suspicious, findings detected by DM screening and symptomatic women with subtle or negative findings on DM but suspicious lesions on ultrasonography (US). Normal/benign cases were included as controls. Patients with suspicious lesions underwent surgery and histopathological examination of the specimens. Patients not undergoing surgery had a 1-year follow-up.
Image acquisition
Digital mammography was performed using a Mammomat NovationDR unit (Siemens, Erlangen, Germany), and BT was performed using a prototype device based on the Novation platform. The detector used in this prototype BT system is a direct-converter amorphous selenium flat-panel detector(11). No anti-scatter grid was used. Each examination with DM consisted of two views: mediolateral oblique (MLO) and craniocaudal (CC). The BT images were acquired using the same tube voltage and anode/filter (W Rh−1) combination as for the DM images, determined by the automatic exposure control of the DM unit. The BT examinations were performed using a total tube loading of about twice that of a single DM image, resulting in approximately the same dose as a dual-view mammography examination. A third modality consisted of a combination of single-view BT plus the complementary DM view (e.g. BT in the MLO projection plus DM in the CC projection), hereinafter referred to as the ‘combined modality’. For the combined modality, the resulting dose would be of approximately 1.5 times that of the other modalities. For the BT examinations, 25 projection images were acquired over an angular range of approximately ±20°. The images were reconstructed using a filtered back projection for Readers 1, 2, 3 and 4, employing a spectral filter (cut-off parameter 1.5 times the Nyquist frequency) and a slice thickness filter (cut-off 0.07 times the Nyquist frequency), and for Reader 5 employing slightly different settings (cut-off parameter 0.3 times the Nyquist frequency, no slice thickness filter), in addition to the ramp filter(12). The settings for Reader 5 were previously used as standard at our laboratory and the authors believe that the differences in settings had negligible influence on the result.
Graphical user interface
A graphical user interface, ViewDEX(13), was used to display the images and to collect and score the observer data. The ViewDEX software recorded the observers' marks and ratings at any given location in the DM and BT cases. The software contains a free-hand drawing feature to enable the scoring by outlining regions of suspicious malignancy. The interpretations of the images were made on a Sun Microsystem Ultra 24 Workstation using two 5 mega-pixel (MP) flat-panel monitors (SMD21500, EIZO GmbH, Karlsruhe, Germany), calibrated according to DICOM part 14(14). The maximum dark value was 0.4 cd m−2 and the maximum white level 355 cd m−2 measured with a spotmeter using the Verilum pattern AAPM TG 18. The ambient light level was lower than 3 lux. The cases were displayed one at a time using one 5-MP monitor per view.
Observer study
Five expert mammographers interpreted the cases independently in a free-response study(15,16). They were blinded to the true state (positive/negative) of the images. The observers initially had a training session of 30 BT and the corresponding 30 DM cases to become familiar with the appearance of the normal tissue and the general appearance of various cancer types in BT. Fifty patient cases (25 abnormal and 25 normal/benign) were randomly selected from a larger 200 cases' study comparing the potential of single-view BT versus dual-view DM to be published later. The wash-out period for the combined modality was 1 month after the reading of the other modalities was completed for all observers. The observer's task was to mark and rate any finding suspicious for malignancy and any benign finding that they would normally report in the screening programme. For each mark, the type of finding had to be classified into the type of mammographic finding; mass/mass like, cluster of calcifications or architectural distortion. The probability of malignancy was rated on a BIRADS-based scale(17) which consists of five levels (3, 4A, 4B, 4C and 5) of increasing probability for malignancy. Since this was a laboratory study with no clinical consequences true BIRADS ratings were not possible. The intent was to put the ratings into terminology more familiar to the radiologists. The zero rating was not allowed. A BIRADS 1 would correspond to no marks and 2 to a benign lesion which the observers were asked to ignore. Although optimal window/level settings were pre-set by the built-in software of the DM system, and by an experienced radiologist (I.A.) for the BT cases, the observers were free to alter these settings during the study. Optionally, the observers could use the zoom function, pan function and the cine-loop mode, which displays the slices for each BT case in sequence at an observer-determined rate. No time limit was imposed on the observers' interpretations.
Definition of ground truth
The free response paradigm requires regions suspicious for malignancy to be marked and rated by the observers(16). It benefits from a good definition of true lesion location and extent. Two radiologists (I.A. and D.I., here referred to as the ‘truth panel’), who were non-participants in the study and experienced in BT and DM, outlined the malignant regions using all available data: BT, DM, US, needle biopsy and pathology. In the DM cases, the malignant regions were outlined in the CC and the MLO views. In the BT images, the outlines were made in three slices where the lesion appeared: the initial, focus and final slice. In cases where a lesion was not visible in the BT or DM to the truth panel, but was seen and localised to a quadrant on US images and the histopathological examination, the lesion-containing quadrant was recorded.
Scoring the marks
The observer data were scored by a medical physicist (T.S.). If a mark with rating ≥3 was located inside the boundary of a malignancy (or in the correct quadrant), it was scored as a lesion localization (LL). Otherwise, it was scored as a non-lesion localization (NL). If two marks were located in the same malignant region because the radiologist indicated two different types of mammographic findings, they were scored as one LL. For this preliminary work, only the BIRADS-based scale was used (i.e. not the information of lesion types).
Statistical analysis
The scored FROC data analysed by the jackknife alternative free-response receiver operating characteristic (JAFROC) method(16) software version 3e. The JAFROC figure of merit (FOM) is the probability that a lesion is rated higher than NL marks on normal images (JAFROC does not use NL marks on abnormal images). The analysis yields an F-statistic and a p-value for rejecting the null hypothesis (NH) that the three modalities (single-view BT, dual-view DM and combined) have identical performance, as well as 95 % confidence intervals for differences in FOMs for all pairings of modalities. We also performed ROC analysis using the rating of the highest rated mark on each image (which could be due to a lesion or a non-lesion on an abnormal case) as the single ROC-equivalent rating for the case and the trapezoidal area under the curve (AUC) as the figure of merit.
RESULTS
Table 1 lists the individual observer JAFROC FOMs and their means for each modality. All radiologists had higher FOM for the combined BT modality (A) followed by BT (B) and DM (C), i.e., A>B>C. The F-statistic was 3.86 and p = 0.0264, indicating that the FOM difference between at least two modalities was statistically significant. Which pairings of modalities were significantly different was determined by constructing 95% confidence intervals (CI) for the reader-averaged differences Δ in FOMs between pairs of modalities. If the CI excluded zero, the difference was significant. Table 2 lists the results of JAFROC and ROC analysis. JAFROC analysis showed that the combined modality (A) was significantly better than DM (C) as indicated by the asterisk. ROC analysis did not reject the NH (p = 0.27). The mean AUCs for ROC analysis were 0.833, 0.810 and 0.762 for modalities A, B and C, respectively, which were in the same order as the JAFROC FOMs (A>B>C). The differences were also in the same order (A-C>B-C>A-B). The JAFROC effect sizes (i.e., the Δ's) were consistently larger than the corresponding ROC values. Table 3 lists the number of LLs on abnormal cases and the highest rated NLs on the normal/benign cases in the study.
Table 1.
The individual reader and the mean JAFROC FOMs for the three modalities.
| Reader | Combination of BT and DM (A) | Single-view BT (B) | Dual-view DM (C) |
|---|---|---|---|
| 1 | 0.811 | 0.764 | 0.663 |
| 2 | 0.807 | 0.781 | 0.642 |
| 3 | 0.788 | 0.741 | 0.681 |
| 4 | 0.841 | 0.731 | 0.789 |
| 5 | 0.844 | 0.837 | 0.750 |
| Mean | 0.818 | 0.771 | 0.705 |
Δ(<FOMA–C >) was significantly different from zero, indicating that the combined BT modality was significantly superior to DM.
Table 2.
Results of JAFROC and ROC analysis of the differences between modalities; CI=95% confidence interval and the asterisk indicates a significant difference.
| Method | A–B | A–C | B–C | |
|---|---|---|---|---|
| JAFROC | Δ | 0.0474 | 0.114* | 0.0661 |
| CI | −0.035, 0.129 | 0.0314, 0.196 | −0.016, 0.148 | |
| ROC | Δ | 0.023 | 0.071 | 0.048 |
| CI | −0.066, 0.112 | −0.018, 0.16 | −0.041, 0.137 |
Table 3.
The number of cases with one or more LLs (out of 28 possible lesions) and the number of normal cases or cases with benign lesions, with at least one NL, for five readers.
| Reader | Combination of BT and DM (A) | Single-view BT (B) | Dual-view DM (C) |
|---|---|---|---|
| 1 | 26/16 | 22/16 | 18/14 |
| 2 | 21/3 | 23/8 | 18/7 |
| 3 | 22/8 | 21/12 | 17/7 |
| 4 | 25/20 | 22/18 | 22/12 |
| 5 | 19/4 | 19/7 | 16/7 |
Figure 1 illustrates an example of a case that was non-detected by the readers (4/5) on dual-view DM, but detected on the other modalities.
Figure 1.
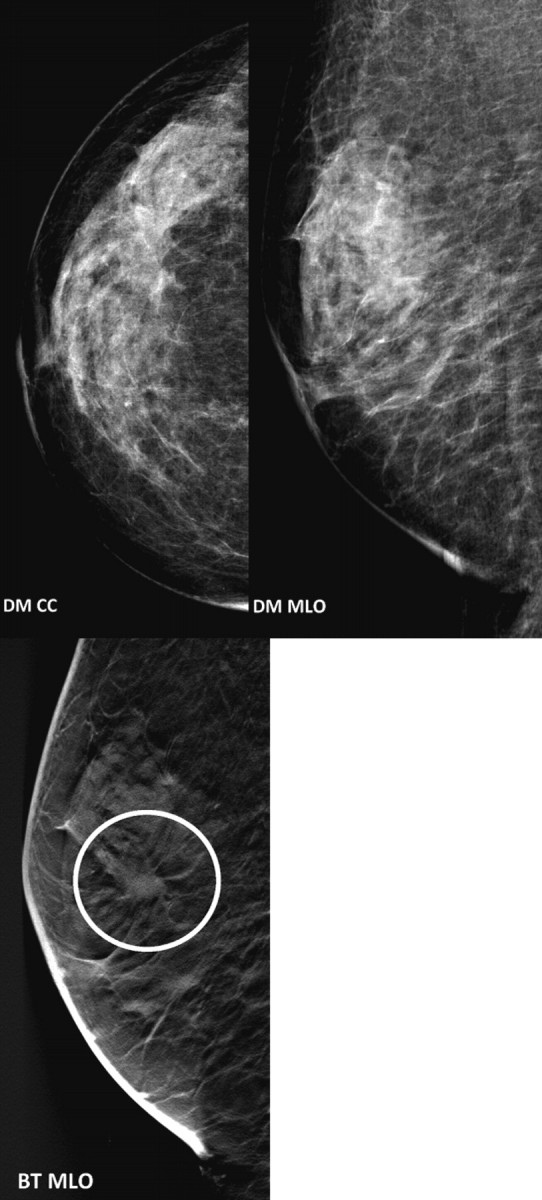
An example of a case that was not detected for four-fifth of the readers on dual-view DM, but detected by all readers on BT and on the combined modality.
DISCUSSION
JAFROC analysis showed that the combined modality was significantly superior to dual-view DM (A vs C). This is expected since adding the second modality provides more information to the radiologist, which should improve the observer performance. The improvement was rather large, 0.114 in JAFROC FOM units and 0.07 in ROC AUC units. Differences between the other pairings of modalities (A vs B and B vs C) were not significant. ROC analysis was consistent with JAFROC but did not achieve significance. The mean ROC AUCs, 0.833, 0.810 and 0.762 for modalities A, B and C, respectively, suggest that the biggest improvement occurs in going from 2D to 3D; with a larger sample size it should be possible to show a significant difference between DM and single view BT.
The participating radiologists gave feedback on their experience with the modalities. Some of them would have liked to see both CC and MLO views in the BT modality. This may be due to their training and what they are accustomed to in the clinic, but adding a second BT view would provide more information. Since the sampling is not complete in BT the anatomical noise is reduced but not eliminated. A cancer can be missed due to incomplete elimination of anatomical noise. The breast is compressed and the tissue lies in different positions in the breast for each view and breast cancers such as spicules may be preferentially oriented in one plane and thus difficult to identify in other planes. It would be of interest to determine if two view BT performs better than single view BT+the opposite DM view.
Another issue concerns the detection of clusters of calcifications. The general impressions of the radiologists when interpreting BT and DM were that the noise from the filtered-back projection in the BT images might yield additional NLs on clusters of calcifications when compared with the DM images. This will be further investigated in future work by taking into account the lesion distribution.
The experience of the radiologists (average 20 y) is based on dual-view DM. Although the mammographic decisions are similar when imaging with a 3D technique, this may have affected the results in favour of DM. Furthermore, the combined modality could potentially have benefited from the reading order, being the last modality read when using the same patient cases for all modalities. However, according to the feedback from the radiologists, they were not able to remember any specific cases when reading the combined modality. Therefore, this effect was probably negligible.
CONCLUSIONS
In conclusion, the results of the present study show that combining single-view BT with the opposite DM view yields significantly superior diagnostic accuracy over dual-view DM.
FUNDING
The present study was supported by the Cancer Research Foundation at the Department of Oncology, Franke and Margareta Bergqvist Foundation, EIZO and Siemens. One of the authors (D.I.) was supported by the Sidney B. Frank Foundation and another (D.C.) was supported by the Department of Health and Human Services, National Institutes of Health, R01-EB005243 and R01-EB008688.
ACKNOWLEDGEMENTS
The authors acknowledge all the readers.
REFERENCES
- 1.Laming D., Warren R. Improving the detection of cancer in the screening of mammograms. J. Med. Screen. 2000;7:24–30. doi: 10.1136/jms.7.1.24. [DOI] [PubMed] [Google Scholar]
- 2.Lewin J. M., Hendrick R. E., D'Orsi C. J., Isaacs P. K., Moss L. J., Karellas A., Sisney G. A., Kuni C. C., Cutter G. R. Comparison of full-field digital mammography with screen-film mammography for cancer detection: results of 4,945 paired examinations. Radiology. 2001;218:873–880. doi: 10.1148/radiology.218.3.r01mr29873. [DOI] [PubMed] [Google Scholar]
- 3.Skaane P., Skjennald A. Screen-film mammography versus full-field digital mammography with soft-copy reading: randomized trial in a population-based screening program-the Oslo II study. Radiology. 2004;232:197–204. doi: 10.1148/radiol.2321031624. [DOI] [PubMed] [Google Scholar]
- 4.Pisano E. D., Gatsonis C., Hendrick E., Yaffe M., Baum K. J., Acharyya S., Conant E. F., Fajardo L. L., Bassett L., D'Orsi C., et al. Diagnostic performance of digital versus film mammography for breast-cancer screening. N. Engl. J. Med. 2005;353:1773–1783. doi: 10.1056/NEJMoa052911. [DOI] [PubMed] [Google Scholar]
- 5.Bochud F. O., Valley J. F., Verdun F. R., Hessler C., Schnyder P. Estimation of the noisy component of anatomical backgrounds. Med. Phys. 1999;26:1365–1370. doi: 10.1118/1.598632. [DOI] [PubMed] [Google Scholar]
- 6.Andersson I., Ikeda D. M., Zackrisson S., Ruschin M., Svahn T., Timberg P., Tingberg A. Breast tomosynthesis and digital mammography: a comparison of breast cancer visibility and BIRADS classification in a population of cancers with subtle mammographic findings. Eur. Radiol. 2008;18:2817–2825. doi: 10.1007/s00330-008-1076-9. [DOI] [PubMed] [Google Scholar]
- 7.Förnvik D., Zackrisson S., Ljungberg O., Svahn T., Timberg P., Tingberg A., Andersson I. Breast tomosynthesis: accuracy of tumor measurement compared with digital mammography and ultrasonography. Acta Radiol. 2009 doi: 10.3109/02841850903524447. doi:10.3109/02841850903524447. [DOI] [PubMed] [Google Scholar]
- 8.Poplack S. P., Tosteson T. D., Kogel C. A., Nagy H. M. Digital breast tomosynthesis: initial experience in 98 women with abnormal digital screening mammography. AJR Am. J. Roentgenol. 2007;189:616–623. doi: 10.2214/AJR.07.2231. [DOI] [PubMed] [Google Scholar]
- 9.Gur D., Abrams G. S., Chough D. M., Ganott M. A., Hakim C. M., Perrin R. L., Rathfon G. Y., Sumkin J. H., Zuley M. L., Bandos A. I. Digital breast tomosynthesis: observer performance study. AJR Am. J. Roentgenol. 2009;193:586–591. doi: 10.2214/AJR.08.2031. [DOI] [PubMed] [Google Scholar]
- 10.Metz C. E. Some practical issues of experimental design and data analysis in radiological ROC studies. Invest. Radiol. 1989;24:234–245. doi: 10.1097/00004424-198903000-00012. [DOI] [PubMed] [Google Scholar]
- 11.Bisonette M., Hansroul M., Masson E., Cadieux S., Warmoes P., Gravel D., Agopyan J., Polischuk B., Haerer W., Mertelmeier T., et al. Digital breast tomosynthesis using an amorphous selenium flat panel detector. Proc. SPIE. 2005;5745:529–540. [Google Scholar]
- 12.Mertelmeier T., Orman J., Haerer W., Dudam M. K. Optimizing filtered backprojection reconstruction for a breast tomosynthesis prototype device. Proc. SPIE. 2006;6142:131–142. [Google Scholar]
- 13.Håkansson M., Svensson S., Zachrisson S., Svalkvist A., Båth M., Månsson L. G. ViewDEX 2.0: a Java-based DICOM-compatible software for observer performance studies. Proc. SPIE. 2009;7263:72631G.1–72631G.10. doi: 10.1093/rpd/ncq057. [DOI] [PubMed] [Google Scholar]
- 14.NEMA. Rosslyn, VA: National Electrical Manufacturers Association; 2004. Digital imaging and communications in medicine (DICOM) part 14: grayscale standard display function. NEMA PS 3.14-2004. [Google Scholar]
- 15.Chakraborty D. P., Berbaum K. S. Observer studies involving detection and localization: modeling, analysis and validation. Med. Phys. 2004;31:2313–2330. doi: 10.1118/1.1769352. [DOI] [PubMed] [Google Scholar]
- 16.Chakraborty D. P. Recent advances in observer performance methodology: jackknife free-response receiver operating characteristic (JAFROC) methodology. Radiat. Prot. Dosim. 2005;114:45–52. doi: 10.1093/rpd/nch512. [DOI] [PubMed] [Google Scholar]
- 17.ACR. second edn. Reston, VA: American College of Radiology; 1995. Breast Imaging Reporting and Data System (BI-RADS) [Google Scholar]