Abstract
Although the qualitative nucleocytoplasmic transport of nuclear hormone receptors (NHRs) has been studied, there is little documentation of the cellular kinetics of this transport. Here, translocation studies using the human androgen receptor (hAR) and the human glucocorticoid receptor (hGR) were performed to aid in identifying the mechanism by which anabolic-androgenic steroids (AAS) were activating hAR and potentially interacting with hGR and how glucocorticoid ligands were interacting with the hGR and hAR. The real-time analysis of EGFP-labeled hAR and hGR ligand-induced cytoplasm-to-nucleus translocation was performed using fluorescence microscopy to better understand the action of these NHRs in a physiologically relevant cell-based model. After transient transfection, the hAR and hGR individually translocate as expected (i.e., transport is ligand-induced and dose-dependent) in this model biological system. Testosterone (TEST) had the fastest translocation rate for the hAR of 0.0525 min−1. The other endogenous steroids, androstenedione (ANE) and dihydrotestosterone (DHT), had considerably lower hAR transport rates. The rates of hAR transport for the exogenous steroids methyltrienelone (MET), nandrolone (NAN), and oxandrolone (OXA) are lower than testosterone and similar to the endogenous steroids ANE and DHT. The hGR transport rates for cortisol (COR) and dexamethasone (DEX) are also presented. The synthetic GC, DEX, had a more rapid translocation rate (0.1599 min−1) at the highest dose of 100 nM compared to the endogenous GC COR (0.0431 min−1). The data obtained agrees with the existing qualitative data and adds an important ligand-dependent kinetic component to hAR and hGR transport. These kinetic data can aid our understanding of NHR action, interaction with other regulatory proteins, and be useful in the development of new therapies.
Keywords: Androgen receptor, glucocorticoid receptor, transport, translocation, anabolic-androgenic steroids
Introduction
The human androgen receptor (hAR) and the human glucocorticoid receptor (hGR) are nuclear hormone receptor (NHR) transcription factors that shuttle from the cytoplasm to the nucleus upon ligand binding. Once in the nucleus, they bind to hormone response elements (HREs) in the promoter region of their target genes and activate or repress transcription. This transport to the nucleus is a necessary component of ligand-mediated NHR action; hAR and hGR have been extensively studied and their nucleocytoplasmic shuttling is documented 1-16. However, there are few reports of the cellular kinetics of NHR transport 17.
The exact mechanism of action (MOA) of anabolic-androgenic steroids (AAS) is still not completely understood 18, 19. Studies suggest the MOA of AAS may differ between steroid compounds because of variation in the structure of the steroid molecule and its affinity to the hAR or the hGR 18. Synthetic steroids, which are commonly abused for their muscle building effects, have been developed via the modification of testosterone in an attempt to enhance pharmacologic properties of the steroids. However, the reasons for the variation of resulting pharmacologic activity are unclear. These synthetic AAS do activate the hAR, but there has been no assessment of the kinetics and rate of transport variation between the compounds. In addition, the competitive antagonism of hGR by AAS (complementary to their agonist activity at hAR) has been reported 20-22, but it is unclear if the hAR ligands are causing hGR transport.
This study determines the rate of import of hAR and hGR individually into the nucleus of living cells in real time with representative ligands specific to each receptor. The ligands included in this study are representative endogenous steroids and synthetic steroids. The real time imaging to determine dynamic effects which occur after ligand binding may aid in our understanding of the mechanism of action of AAS on a subcellular level.
Materials and Methods
Reagents
COS-7 cells were purchased from American Type Culture Collection, CRL-1651 (Manassas, VA). RPMI-1642, penicillin, streptomycin, fetal bovine serum (FBS), and charcoal stripped FBS were from HyClone (Logan, UT). Amphotericin B was from Sigma-Aldrich (St. Louis, MO). Androstenedione (ANE), dihydrotestosterone (DHT), epitestosterone (EPI), estradiol (E2), nandrolone (NAN), oxandrolone (OXA), testosterone (TEST), cortisol (COR), and dexamethasone (DEX) were purchased from Steraloids (Newport, RI). Methyltrienelone (MET) was from PerkinElmer (Waltham, MA). Flutamide (FLU) was purchased from Sigma-Aldrich (St. Louis, MO). Liopfectamine 2000 CD™ was purchased from Invitrogen (Carlsbad, CA).
Plasmids
A pEGFP-hAR (enhanced green fluorescent protein-hAR) plasmid (gift from A. Saporita, Northwestern University 23) and a pEGFP-hGR plasmid (gift from S. Her, Ph.D, Stanford University 24) were generated to express an EGFP fusion protein by cloning the coding sequence of full length hAR or hGR into the expression plasmid pEGFP-C1 (Clontech, Mountain View, CA).
Cell Culture and Transient Transfection
COS-7 cells were maintained in RPMI-1640 media with 10% fetal bovine serum and 100 μg/mL penicillin, streptomycin, and amphotericin B. The cells were kept in an incubator at 37°C and 5% CO2. COS-7 cells were transiently transfected using Lipofectamine 2000 CD™ according to optimized manufacturer’s instructions. A 1:5 ratio of DNA:Lipofectamine in 400 μl plain RPMI-1640 was used for transfection in live cell chambers (Lab-tek chamber slide system, 2 ml, Nalge NUNC International, Naperville, IL) seeded with COS-7 cells at 90% confluency. For transport assays, 1 μg of EGFP-labeled NHR was used.
Transport Studies
Approximately 24 hours after transfection, media on the COS-7 cells was changed to phenol red-free RPMI-1640 containing 10% charcoal stripped FBS. After an hour, the cells were treated with steroid (concentration of 1 nM, 10 nM, 50 nM, or 100 nM or ethanol vehicle). These four concentrations of steroids range from very low to supraphysiological and encompassed normal physiological levels. Translocation of receptors was viewed with fluorescence microscopy; images were taken at 0, 5, 10, 15, 20, 30, 45, 60, 90, 120, and 240 minutes for individual experiments. Time points were chosen based on previous studies and the observation that import reaches steady state (or plateaus) after 2 hours 3, 17. The fastest import rates occur during the first 30 minutes after ligand induction 17.
Microscopy
An Olympus IX701F inverted fluorescence microscope (Scientific Instrument Company, Aurora, CO) with high-quantity narrow band GFP filter (excitation HQ480/20 nm, emission HQ510/20 nm, with beam splitter Q4951p) was used. Cells were photographed at a magnification of 40× using an F-view monochrome CCD camera. To minimize photobleaching of the EGFP chromophores, cells were imaged using neutral density filters at short (500 ms) exposure times. An air stream incubator (Nevtek ASI 400, Burnsville, VA) with temperature control was used to maintain the microscope stage at 37 °C.
Quantitation of Receptor Translocation Data Analysis and Statistics
Fluorescence microscopy was used to study and quantify the amount of protein present in a cellular compartment as done previously 25-29. Fluorescence intensity of a particular compartment relates to the amount of protein present in that compartment; therefore, quantitation of protein in the nucleus and cytoplasm was carried out by measuring the fluorescence intensity of EGFP tagged to the protein construct as previously described 26, 29, 30. All the images were analyzed using analySIS® software (Soft Imaging System, Lakewood, CO), which calculates values for total cell intensity and nucleus intensity. To obtain percent intensity in nucleus (which indicated the amount of protein in the nucleus compared to cytosol), nucleus intensity was divided by total cell intensity and multiplied by 100.
Curve Fitting and Statistical Analysis
For individual translocation studies all doses of steroids were repeated in triplicate (n=3) and 10 cells representative of the whole population were analyzed in each experiment (n=30 cells total, unless noted). The mean ± SEM of percent intensity in the nucleus was calculated for each time point. One-way ANOVA with Dunnett’s post test was used to assess differences between values (p-value < 0.05 considered significant). The value for percent nucleus intensity at each time point for each dose was compared to the vehicle percent nucleus intensity at the same time point. To determine the rate of transport, the relationship between time and percent intensity in the nucleus for each steroid and dose was fitted to a monoexponential function using non-linear regression with the following equation:
Where Y = percent intensity in nucleus, t = time, Y0 = percent intensity in nucleus in the absence of ligand (at time 0), YMAX = relative nuclear intensity in the presence of ligand at steady state, K = rate of nuclear import 29. The fitted curves and rates were compared to vehicle using one-way ANOVA with Dunnett’s post test (p-value < 0.05 considered significant). The rate relative to vehicle (RRV) was calculated for comparison of the rates. All rate values were divided by the rate value for vehicle (therefore, vehicle RRV is equal to 1.0). All statistics were performed using GraphPad Prism version 4.00 for Windows, San Diego, CA.
Results
hAR Transport
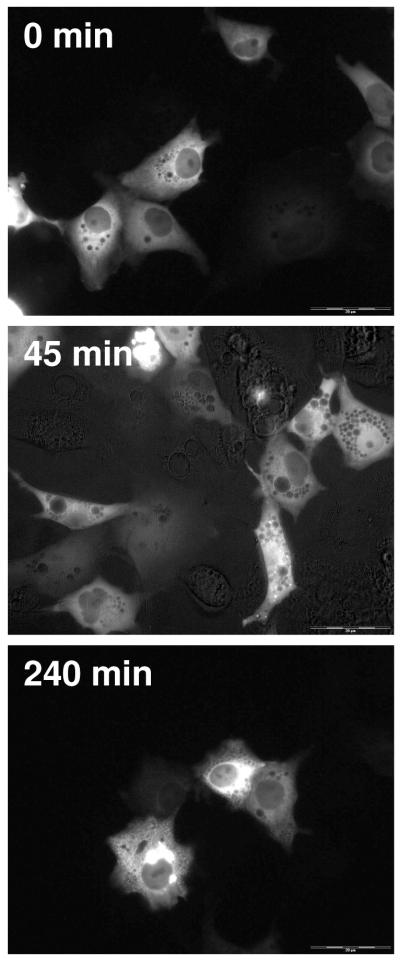
After transient transfection of EGFP-hAR into COS-7 cells, the majority of the receptor is located the cytoplasm of the cells. Figure 1 shows COS-7 cells treated with vehicle; over time, there is no change in the localization of EGFP-hAR. At all time points the approximate percent intensity in the nucleus is 20%. The initial 20% intensity in the nucleus is likely due to the use of normal fluorescence microscopy, which allows for the recording and assessment of all GFP signals generated from each cell.
Figure 1.
Translocation of EGFP-hAR in COS-7 cells after vehicle treatment. Representative time points of 0 minutes, 45 minutes, and 240 minutes are shown. At all time points, the majority of EGFP-hAR is cytosolic.
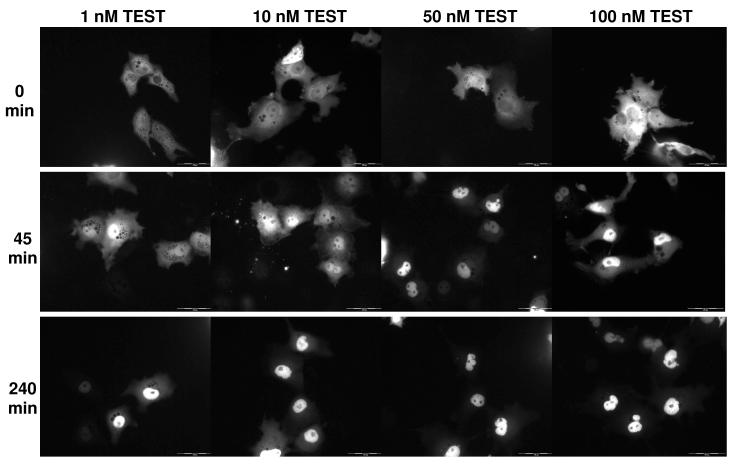
Figure 2 shows COS-7 cells treated with four different concentration of TEST at three time points. At time 0 for all treatment groups there is approximately 20% of cellular intensity in the nucleus. At 45 minutes, more of the receptor has shuttled from the cytosol to the nucleus in a dose-dependent manner; there is a higher percentage of nuclear intensity at higher doses. At 240 minutes, the maximal amount of receptor per dose has been shuttled into the nucleus. The cells for other AAS studies are similar (data not shown).
Figure 2.
Translocation of EGFP-hAR in COS-7 cells after TEST treatment. Representative time points of 0 minutes, 45 minutes, and 240 minutes are shown for 4 treatment concentrations of TEST (1 nM, 10 nM, 50 nM, and 100 nM). At 0 minutes, the majority of EGFP-hAR is cytosolic. At 45 minutes, EGFP-hAR has translocated to the nucleus. At 240 minutes, transport of EGFP-hAR to the nucleus has plateaued in a dose-dependent manner; more EGFP-hAR is nuclear in the cells treated with the highest dose of TEST. Translocation of other AAS was similar.
Several AAS were chosen for analysis in these studies. These AAS were chosen and used because they have varying affinities for the hAR and varying reported potencies 19, 31-34. The selected AAS are also representative of the major structural modifications made to AAS: varied conjugation of A, B, and C rings in the steroid and varying functional groups on carbon 17. In addition, the hAR antagonist FLU was assessed.
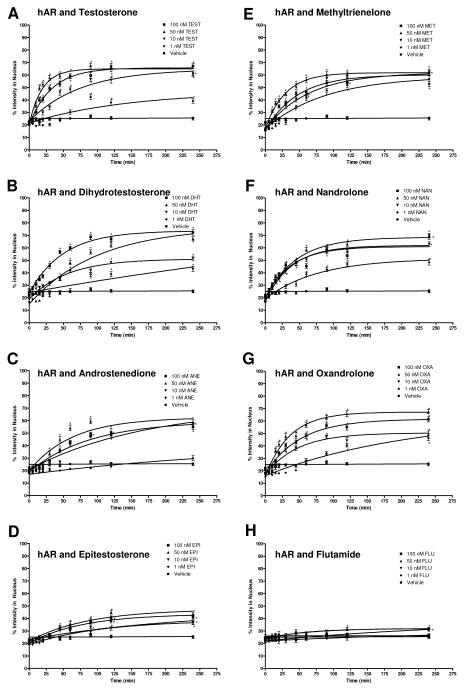
Figure 3 shows the data for hAR ligand transport of TEST, ANE, DHT, EPI, MET, NAN, OXA, and FLU in graphical form along with vehicle. The dose-dependent rate of transport is evident by the varying steepness of the fitted curves. The rates, as determined from the curve fit, and the RRVs are summarized in Table 1. TEST had the highest rates followed by MET, OXA, NAN, DHT, ANE, and EPI. This trend, although dose-dependent, was not was expected based on affinity; the results were not affinity-dependent. FLU showed little transport except at the highest dose. For TEST, ANE, MET, and OXA, the highest rate was seen at the 50 nM dose, which is the dose closest to physiological levels of endogenous AAS.
Figure 3.
Translocation data for hAR after treatment with hAR ligands. The graphs depict the change in percent intensity of EGFP-hAR in the nucleus over time after induction with 1 nM, 10 nM, 50 nM, or 100 nM of the ligand. Translocation was observed for 240 minutes. Data reported is mean ± SEM, n = 3 experiments with 10 cells analyzed per experiment. The varying steepness of the curves represents the varying rate of hAR transport depending on the dose of ligand. See Table 2.1 for rates. Significant difference from corresponding vehicle time point indicated with *, p < 0.05. A, testosterone (TEST); B, dihydrotestosterone (DHT); C, androstenedione (ANE); D, epitestosterone (EPI); E, methyltrienelone (MET); F, nandrolone (NAN); G, oxandrolone (OXA); H, flutamide (FLU).
Table 1.
Rates and rates relative to vehicle (RRV) of EGFP-hAR transport for 4 doses of TEST, ANE, DHT, EPI, MET, NAN, OXA, and FLU and for VEH. Rate is min−1.
| 1 nM | 10 nM | 50 nM | 100 nM | |||||
|---|---|---|---|---|---|---|---|---|
| rate | RRV | rate | RRV | rate | RRV | rate | RRV | |
| TEST | 0.0069 | 2.13 | 0.0134* | 4.12 | 0.0525* | 16.11 | 0.0301* | 9.24 |
| ANE | 0.0029 | 0.90 | 0.0058 | 1.78 | 0.0157* | 4.83 | 0.0112* | 3.45 |
| DHT | 0.0012 | 0.38 | 0.0179* | 5.51 | 0.0100* | 3.06 | 0.0200* | 6.15 |
| EPI | 0.0046 | 1.42 | 0.0096 | 2.96 | 0.0118* | 3.63 | 0.0130* | 4.00 |
| MET | 0.0114 | 3.50 | 0.0157* | 4.81 | 0.0339* | 10.41 | 0.0212* | 6.51 |
| NAN | 0.0130* | 4.00 | 0.0261* | 8.03 | 0.0220* | 6.76 | 0.0261* | 8.01 |
| OXA | 0.0047 | 1.43 | 0.0213* | 6.53 | 0.0276* | 8.48 | 0.0196* | 6.02 |
| FLU | 0.0059 | 1.80 | 0.0035 | 1.06 | 0.0153* | 4.71 | 0.0033 | 1.02 |
| VEH | 0.0033 | 1.00 | ||||||
Rates significantly different from vehicle, p < 0.05.
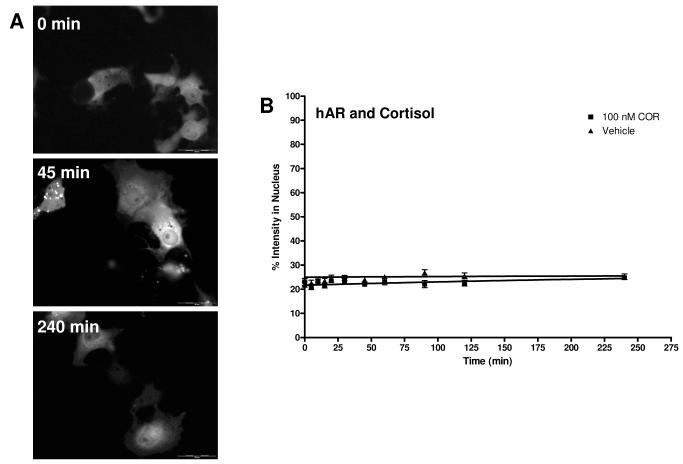
Figure 4A shows COS-7 cells treated with 100 nM COR at three time points. At all time points, there is no nuclear translocation of EGFP-hAR observed. The cells treated with DEX and E2 are similar, as expected (no translocation; data not shown). Figure 4B shows the hAR transport data of COR; the hAR transport data for DEX and E2 look similar (data not shown). There was no change in receptor localization due to these ligands; the best fit lines and rates are similar to vehicle. The rates determined from the curve fit and the rate relative to vehicle for COR, DEX, and E2 are summarized in Table 2. Although these results were predicted, as non-hAR ligands are not expected to cause the translocation of hAR, these data do demonstrate that there is no transport of hAR mediated by glucocorticoids.
Figure 4.
Translocation of EGFP-hAR in COS-7 cells after 100 nM COR treatment. A. Cells at representative time points of 0 minutes, 45 minutes, and 240 minutes are shown. At all time points, the majority of EGFP-hAR is cytosolic. Transport of DEX and E2 were similar. B. Translocation data for COR and hAR. The graph depicts the change in percent intensity of EGFP-hAR in the nucleus over time after induction with 100 nM COR. Translocation was observed for 240 minutes. Data reported is mean ± SEM, n = 3 experiments with 10 cells analyzed per experiment. There was no change in the rate of hAR transport with the highest dose of COR used. See Table 2.3 for rate. No significant difference from corresponding vehicle time point was seen.
Table 2.
Rates and rates relative to vehicle (RRV) of EGFP-hAR transport for 1 dose of COR, DEX, and E2, and for VEH. Rate is min−1.
| 100 nM | ||
|---|---|---|
| rate | RRV | |
| COR | 0.0022 | 0.69 |
| DEX | 0.0025 | 0.76 |
| E2 | 1.00E-07 | 3.07E-05 |
| VEH | 0.0033 | 1.00 |
No rates significantly different from vehicle, p < 0.05.
hGR Transport
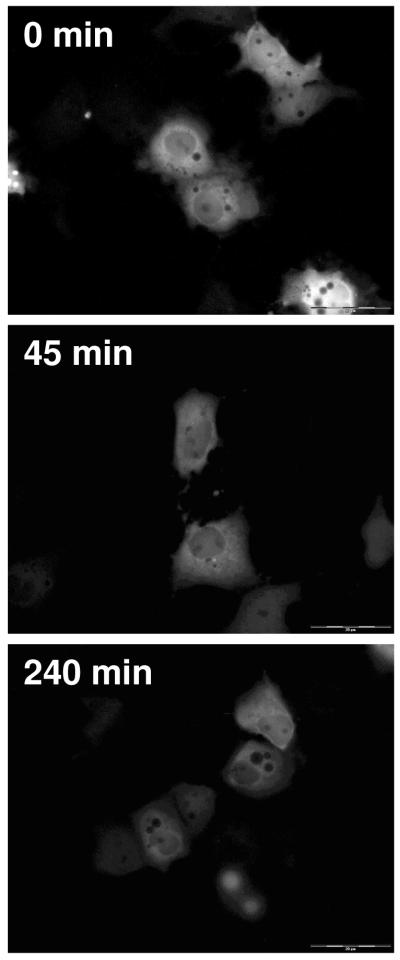
As with EGFP-hAR, after transient transfection of EGFP-hGR into COS-7 cells the majority of the receptor is located the cytoplasm. Figure 5 shows COS-7 cells transfected with hGR and treated with vehicle. Over time and similar to vehicle treated EGFP-hAR, there is no change in the localization of EGFP-hGR; at all time points, the approximate percent intensity in the nucleus is 20%.
Figure 5.
Translocation of EGFP-hGR in COS-7 cells after vehicle treatment. Representative time points of 0 minutes, 45 minutes, and 240 minutes are shown. At all time points, the majority of EGFP-hGR is cytosolic.
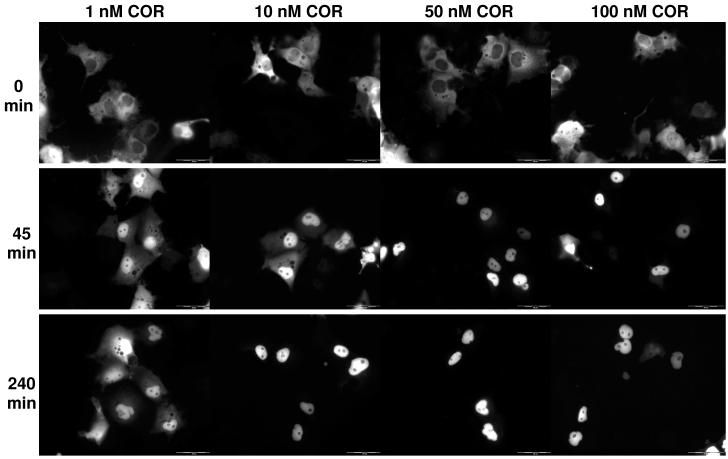
Figure 6 shows COS-7 cells transfected with hGR and treated with four different concentrations of COR at three time points. At time 0 for all treatment groups there is approximately 20% of cellular intensity in the nucleus. At 45 minutes, more of the receptor has shuttled from the cytosol to the nucleus in a dose-dependent manner. At 240 minutes, the maximal amount of receptor per dose has been shuttled into the nucleus. The results for DEX follow the same trend as expected (data not shown).
Figure 6.
Translocation of EGFP-hGR in COS-7 cells after COR treatment. Representative time points of 0 minutes, 45 minutes, and 240 minutes are shown for 4 treatment concentrations of COR (1 nM, 10 nM, 50 nM, and 100 nM). At 0 minutes, the majority of EGFP-hGR is cytosolic. At 45 minutes, EGFP-hGR has translocated to the nucleus. At 240 minutes, transport of EGFP-hGR to the nucleus has plateaued in a dose-dependent manner; more EGFP-hGR is nuclear in the cells treated with the highest dose of TEST. Translocation of DEX was similar.
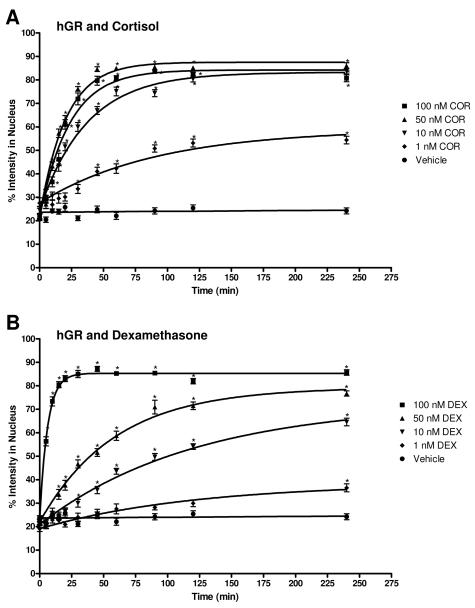
Figure 7 shows the data for COR and DEX induced hGR transport in graphical form along with vehicle. COR and DEX were chosen as representative hGR ligands because they have varying structures and affinity for the hGR 35, 36. As with hAR and AAS, the dose-dependent rate of transport is evident by the varying steepness of the fitted curve. The rates of COR and DEX mediated hGR transport, as determined from the curve fit, and the rate relative to vehicle are summarized in Table 3. COR has higher rates than DEX at 1 nM, 10 nM, and 50 nM while DEX has a higher rate at 100 nM.
Figure 7.
Translocation data for hGR after COR and DEX treatment. The graph depicts the change in percent intensity of EGFP-hGR in the nucleus over time after induction with 1 nM, 10 nM, 50 nM, or 100 nM COR or DEX. Translocation was observed for 240 minutes. Data reported is mean ± SEM, n = 3 experiments with 10 cells analyzed per experiment. The varying steepness of the curves represents the varying rate of hGR transport depending on the dose of COR or DEX. See Table 2.4 for rates. Significant difference from corresponding vehicle time point indicated with *, p < 0.05. A, cortisol (COR); B, dexamethasone (DEX).
Table 3.
Rates and rates relative to vehicle (RRV) of EGFP-hGR transport for 4 doses of COR and DEX and for VEH. Rate is min−1.
| 1 nM | 10 nM | 50 nM | 100 nM | |||||
|---|---|---|---|---|---|---|---|---|
| rate | RRV | rate | RRV | rate | RRV | rate | RRV | |
| COR | 0.0109* | 7.70 | 0.0271* | 19.09 | 0.0491* | 34.54 | 0.0431* | 30.33 |
| DEX | 0.0082 | 5.84 | 0.0083* | 5.80 | 0.0170* | 11.98 | 0.1599* | 112.61 |
| VEH | 0.0014 | 1.00 | ||||||
Rates significantly different from vehicle, p < 0.05.
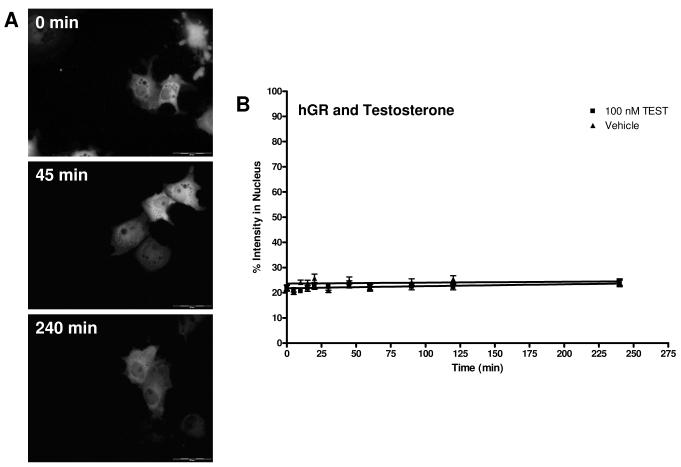
Figure 8A shows COS-7 cells treated with 100 nM TEST at three time points. At all time points, there is no nuclear translocation of EGFP-hGR observed. The cells treated with the other hAR ligands (ANE, DHT, EPI, MET, NAN, OXA, and FLU) and E2 are similar (data not shown). Figure 8B shows the graphical representation of TEST-induced hGR transport. There was no change in receptor localization due to this ligand; the best fit line and rate is similar to vehicle. Data for ANE, DHT, EPI, MET, NAN, OXA, FLU, and E2 are similar (data not shown). The rates determined from the curve fit and the rate relative to vehicle for these ligands are summarized in Table 4. These results were predicted, as non-hGR ligands are not expected to cause the translocation of hAR. These data demonstrate that there is no transport of hGR mediated by AAS.
Figure 8.
Translocation of EGFP-hGR in COS-7 cells after 100 nM TEST treatment. A. Cells at representative time points of 0 minutes, 45 minutes, and 240 minutes are shown. At all time points, the majority of EGFP-hGR is cytosolic. Transport of other AAS, FLU, and E2 was similar. B. Translocation data for TEST and hGR. The graph depicts the change in percent intensity of EGFP-hGR in the nucleus over time after induction with 100 nM TEST. Translocation was observed for 240 minutes. Data reported is mean ± SEM, n = 3 experiments with 10 cells analyzed per experiment. There was no change in the rate of hGR transport with the highest dose of TEST used. See Table 2.5 for rate. No significant difference from corresponding vehicle time point was seen.
Table 4.
Rates and rates relative to vehicle (RRV) of EGFP-hGR transport for 1 dose of TEST, ANE, DHT, EPI, MET, NAN, OXA, FLU, and E2, and for VEH. Rate is min−1.
| 100 nM | ||
|---|---|---|
| rate | RRV | |
| TEST | 0.0012 | 0.81 |
| ANE | 0.0008 | 0.59 |
| DHT | 0.0001 | 0.10 |
| EPI | 0.0010 | 0.68 |
| MET | 4.22E-07 | 2.97E-04 |
| NAN | 1.02E-06 | 7.18E-04 |
| OXA | 0.0016 | 1.15 |
| FLU | 0.0009 | 0.62 |
| E2 | 0.0036 | 2.56 |
| VEH | 0.0014 | 1.00 |
No rates significantly different from vehicle, p < 0.05.
Discussion
This study used real time imaging to determine dynamic effects which occur to the hAR and the hGR after ligand binding. The hAR and the hGR are transcription factors, which after ligand binding, shuttle to the nucleus. This ligand-induced cytoplasm-to-nucleus translocation is a very early step in the transcription process which can be exploited to aid in the understanding of the MOA of these receptors as well as aid in the identification of agonists (and their potency), antagonists and other NHR modulators. Additionally, the kinetic data obtained from these studies can aid in our understanding of of the pharmacodynamic actions of AAS and related compound and can be potentially be used for the development of drug delivery systems which utilize nucleocytoplasmic transport.
Although qualitative hAR transport is well documented in the literature, only TEST, DHT, and MET have been evaluated and there has been no report of the kinetics of transport nor a comparison of any rates for hAR 2, 3, 6-8, 12, 14-16. The transport of hGR has also been studied, but again, no analysis of rate was performed 1, 4, 5, 9-11, 13, 25. Additionally, there has been no evaluation of the effects of hAR ligands on the transport of hGR and vice versa. The hAR ligands chosen for analysis vary in their reported affinities for the hAR and have several common structural modifications made to AAS in order to alter the pharmacology of the compounds. DEX and COR, chosen to assess hGR transport have very different reported affinities to the hGR. With a better understanding of the relative rates of ligand-induced hAR and hGR transport, it may be possible to better understand why different AAS and GCs produce differing effects on a cellular level. Although these studies utilize non-physiologic transient transfection, the data obtained add an important kinetic component to the study of NHR transport.
Figures 3 and 4 show the graphical transport data of hAR in the presence of hAR ligands and hGR ligands, respectively. TEST and other AAS produce a robust and dose-dependent transport of the hAR while there is no COR-induced transport (Figures 1, 2, and 4 show transport of hAR in representative cells). The rates of hAR transport for 11 ligands and 4 doses (unless there was no transport; only the highest dose was used) are reported in Tables 1 and 2. Unexpectedly, the translocation rates obtained are not affinity-dependent and not distinct correlations were determined because of structural variations.
For the hAR and hAR ligands, rate of transport is generally dose dependent, that is, at higher doses, there is a higher rate of transport. It is interesting to the note that for some of the ligands tested (TEST, ANE, MET, OXA), there was a slightly higher rate of transport calculated for the 50 nM dose than the 100 nM dose. This could be of physiological significance since the 50 nM dose is close to physiological concentrations of androgens. Extremely high doses of ligands may be causing the NHRs present in the COS-7 cells to act irregularly. Savory reports that the strength of NHR dimer (and oligomer) interactions are regulated by ligand binding 37. The very high doses of AAS may increase the stability of dimers or oligomers of NHRs that do not typically occur and can hinder transport. It has been reported that COS-7 cells have extremely low levels of GR present 38. With very high doses of AAS, there may be some binding of the AAS to GRs which are present endogenously in COS-7 cells. After ligand binding, GR homodimer and/or hAR:GR heterodimer interaction with importin α/β machinery at the nuclear pore complex may be affecting the apparent import of hAR homodimers because of a lower affinity of the AR dimer to the importin complex. This lower affinity can occur due to steric effects or differences in the strengths of nuclear localization signals. Additionally, the high doses of AAS may alter coregulator recruitment. Coactivators are known to stabilize ligand bound dimers 39. At the high doses of AAS, mixed dimers, which may have a reduced transport rate due to reduced affinity for the importin complex may be stabilized.
Until recently, it was thought that EPI had no biological relevance or steroidal activity; however, it has now been postulated that EPI may act as an endogenous anti-androgen that aids in the regulation of androgen dependent events 40. We show that EPI does cause a dose-dependent hAR transport. This information adds to the theory that EPI may have some biological relevance.
FLU, which is an anti-androgen and hAR antagonist, causes little transport at low dose, but does cause transport at higher doses. This is contrary to a previous study which says that antagonist do not cause nuclear hAR translocation 3. As expected, neither the GCs tested nor E2 caused hAR translocation.
Figures 7 and 8 show graphical representation of hGR transport after induction with COR, DEX, and TEST. These data show the robust and dose-dependent COR- and DEX-induced transport of hGR, while no hGR transport was seen in the presence of TEST (Figures 5, 6, and 8 show transport of hGR in representative cells). The rates of hGR transport for 11 ligands and 4 doses (unless there was no transport; only the highest dose was used) are reported in Tables 3 and 4.
The rate of transport of the hGR ligands COR and DEX was dose-dependent. At high doses, COR and DEX transport was also affinity dependent; at 100 nM, DEX, with a much higher affinity for the hGR than COR, had a much higher rate of transport (see Table 3). This affinity dependence does not hold true for lower doses, however. At all three lower doses, COR caused a higher rate of hGR translocation. Although it is likely that under normal physiologic conditions, DEX and COR may saturate the binding of hGR at low concentrations, translocation was not saturated at these low doses here. This is likely due to the transient transfection method used. Excess (much more than under normal physiologic conditions) hGR was present in the cells, allowing for greater binding and translocation. None of the AAS tested or E2 caused hGR translocation (see Table 4).
It has been suggested that ligand binding induces a conformational change in the NHRs depending on ligand structure and affinity 7, 13, 41. This differential conformation (specifically of helix 12) then recruits different coregulators which in turn may alter the molecular dynamics and mobility of the NHR 7, 41-44. It has been documented that co-repressors are recruited to AR in the presence of flutamide 45. It is possible that the differential rates of hAR transport determined in this study can be explained using conformational arguments; the AAS of varying structure induce different conformation of the hAR and therefore cause differential translocation and perhaps differential association with nuclear import machinery (including the nuclear pore complex and the importin α/β system) 46, 47. It is also plausible that the different conformations induced by the ligands expose differential NLSs on the receptors. Since NLSs on the receptors dictate nuclear import, ligand-dependent NLS exposure could account for the varying rates of nuclear translocation seen in these studies 47-49.
Further studies attempting to determine the mechanism underlying varying translocation rates are warranted to fully understand ligand-mediated NHR translocation. Mechanistic studies assessing the affinity of hAR and hGR to importin α as well as the utilization of mutants of hAR and hGR which have defective NLSs can aid in the elucidation of the translocation mechanism. Additionally, assessment of the ligand-induced conformational changes and subsequent coregulator protein recruitment may aid in the determination of mechanism of action.
This study was a first step in attempting to better understand the mechanism of action of the AR. The information reported in the manuscript does add a kinetic component to the translocation of the receptor. However, it does not fully explain the mechanims of the AR. Additional studies, not within the scope of the presented data are required to more fully understand the mechanism of AR action, especially assessment of the confomational changes induced by each ligand and how this conformational change recruits other regulating proteins and import/export machinery.
Acknowledgements
The authors would like to thank Austin Gillen and Clarissa Gregory for their aid in data analysis.
Funding These studies were supported by NIH NRSA grant F31DA022809 from the National Institute on Drug Abuse, NIH grants DA07820 and DK070060, and a University of Utah Funding Incentive Seed Grant. The content is solely the responsibility of the authors and does not necessarily represent the official views of the National Institute on Drug Abuse or the National Institutes of Health.
References
- 1.Agler M, Prack M, Zhu Y, Kolb J, Nowak K, Ryseck R, Shen D, Cvijic ME, Somerville J, Nadler S, Chen T. J Biomol Screen. 2007;12(8):1029–41. doi: 10.1177/1087057107309353. [DOI] [PubMed] [Google Scholar]
- 2.Cogan PS, Koch TH. J Med Chem. 2004;47(23):5690–9. doi: 10.1021/jm0495226. [DOI] [PubMed] [Google Scholar]
- 3.Georget V, Lobaccaro JM, Terouanne B, Mangeat P, Nicolas JC, Sultan C. Mol Cell Endocrinol. 1997;129(1):17–26. doi: 10.1016/s0303-7207(97)04034-3. [DOI] [PubMed] [Google Scholar]
- 4.Htun H, Barsony J, Renyi I, Gould DL, Hager GL. Proc Natl Acad Sci U S A. 1996;93(10):4845–50. doi: 10.1073/pnas.93.10.4845. [DOI] [PMC free article] [PubMed] [Google Scholar]
- 5.Kawata M. Arch Histol Cytol. 2001;64(4):353–68. doi: 10.1679/aohc.64.353. [DOI] [PubMed] [Google Scholar]
- 6.Kesler CT, Gioeli D, Conaway MR, Weber MJ, Paschal BM. Mol Endocrinol. 2007;21(9):2071–84. doi: 10.1210/me.2007-0240. [DOI] [PubMed] [Google Scholar]
- 7.Marcelli M, Stenoien DL, Szafran AT, Simeoni S, Agoulnik IU, Weigel NL, Moran T, Mikic I, Price JH, Mancini MA. J Cell Biochem. 2006;98(4):770–88. doi: 10.1002/jcb.20593. [DOI] [PubMed] [Google Scholar]
- 8.Nakauchi H, Matsuda K, Ochiai I, Kawauchi A, Mizutani Y, Miki T, Kawata M. J Histochem Cytochem. 2007;55(6):535–44. doi: 10.1369/jhc.6A7064.2007. [DOI] [PubMed] [Google Scholar]
- 9.Nishi M, Kawata M. Neuroendocrinology. 2007;85(3):186–92. doi: 10.1159/000101917. [DOI] [PubMed] [Google Scholar]
- 10.Nishi M, Ogawa H, Ito T, Matsuda KI, Kawata M. Mol Endocrinol. 2001;15(7):1077–92. doi: 10.1210/mend.15.7.0659. [DOI] [PubMed] [Google Scholar]
- 11.Nishi M, Tanaka M, Matsuda K, Sunaguchi M, Kawata M. J Neurosci. 2004;24(21):4918–27. doi: 10.1523/JNEUROSCI.5495-03.2004. [DOI] [PMC free article] [PubMed] [Google Scholar]
- 12.Saitoh M, Takayanagi R, Goto K, Fukamizu A, Tomura A, Yanase T, Nawata H. Mol Endocrinol. 2002;16(4):694–706. doi: 10.1210/mend.16.4.0812. [DOI] [PubMed] [Google Scholar]
- 13.Schaaf MJ, Cidlowski JA. Mol Cell Biol. 2003;23(6):1922–34. doi: 10.1128/MCB.23.6.1922-1934.2003. [DOI] [PMC free article] [PubMed] [Google Scholar]
- 14.Tomura A, Goto K, Morinaga H, Nomura M, Okabe T, Yanase T, Takayanagi R, Nawata H. J Biol Chem. 2001;276(30):28395–401. doi: 10.1074/jbc.M101755200. [DOI] [PubMed] [Google Scholar]
- 15.Tyagi RK, Lavrovsky Y, Ahn SC, Song CS, Chatterjee B, Roy AK. Mol Endocrinol. 2000;14(8):1162–74. doi: 10.1210/mend.14.8.0497. [DOI] [PubMed] [Google Scholar]
- 16.Mo Q, Lu SF, Simon NG. J Steroid Biochem Mol Biol. 2006;99(1):50–8. doi: 10.1016/j.jsbmb.2005.11.011. [DOI] [PubMed] [Google Scholar]
- 17.Li H, Yan G, Kern S, Lim C. Pharmaceutical Research. 2003;20(10):1574–1580. doi: 10.1023/a:1026127015761. [DOI] [PubMed] [Google Scholar]
- 18.Hartgens F, Kuipers H. Sports Medicine. 2004;34(6):513–554. doi: 10.2165/00007256-200434080-00003. [DOI] [PubMed] [Google Scholar]
- 19.Kuhn C. Recent Progress in Hormone Research. 2002;57:411–434. doi: 10.1210/rp.57.1.411. [DOI] [PubMed] [Google Scholar]
- 20.Hickson R, Czerwinski S, Falduto M, Young A. Medicine and Science in Sports and Exercise. 1990;22(3):331–340. [PubMed] [Google Scholar]
- 21.Hickson R, Marone J. Exercise and sport sciences reviews. 1993;21(21):135–167. [PubMed] [Google Scholar]
- 22.Mayer M, Rosen F. Am J Physiol. 1975;229(5):1381–1386. doi: 10.1152/ajplegacy.1975.229.5.1381. [DOI] [PubMed] [Google Scholar]
- 23.Saporita AJ, Zhang Q, Navai N, Dincer Z, Hahn J, Cai X, Wang Z. J Biol Chem. 2003;278(43):41998–2005. doi: 10.1074/jbc.M302460200. [DOI] [PubMed] [Google Scholar]
- 24.Her S, Patel PD, Schatzberg AF, Lyons DM. J Steroid Biochem Mol Biol. 2005;94(4):319–26. doi: 10.1016/j.jsbmb.2004.11.010. [DOI] [PubMed] [Google Scholar]
- 25.Htun H, Holth LT, Walker D, Davie JR, Hager GL. Mol Biol Cell. 1999;10(2):471–86. doi: 10.1091/mbc.10.2.471. [DOI] [PMC free article] [PubMed] [Google Scholar]
- 26.Kanwal C, Mu S, Kern SE, Lim CS. J Control Release. 2004;98(3):379–93. doi: 10.1016/j.jconrel.2004.05.008. [DOI] [PubMed] [Google Scholar]
- 27.Li H, Yan G, Kern SE, Lim CS. Pharm Res. 2003;20(10):1574–80. doi: 10.1023/a:1026127015761. [DOI] [PubMed] [Google Scholar]
- 28.Schaufele F, Chang CY, Liu W, Baxter JD, Nordeen SK, Wan Y, Day RN, McDonnell DP. Mol Endocrinol. 2000;14(12):2024–39. doi: 10.1210/mend.14.12.0572. [DOI] [PubMed] [Google Scholar]
- 29.Kakar M, Davis JR, Kern SE, Lim CS. J Control Release. 2007;120(3):220–32. doi: 10.1016/j.jconrel.2007.04.017. [DOI] [PMC free article] [PubMed] [Google Scholar]
- 30.Kanwal C, Li H, Lim C. AAPS PharmSci. 2002;4(3):E18. doi: 10.1208/ps040318. [DOI] [PMC free article] [PubMed] [Google Scholar]
- 31.Danhaive PA, Rousseau GG. J Steroid Biochem. 1986;24(2):481–7. doi: 10.1016/0022-4731(86)90109-3. [DOI] [PubMed] [Google Scholar]
- 32.Danhaive PA, Rousseau GG. J Steroid Biochem. 1988;29(6):575–81. doi: 10.1016/0022-4731(88)90154-9. [DOI] [PubMed] [Google Scholar]
- 33.Fang H, Tong W, Branham WS, Moland CL, Dial SL, Hong H, Xie Q, Perkins R, Owens W, Sheehan DM. Chem Res Toxicol. 2003;16(10):1338–58. doi: 10.1021/tx030011g. [DOI] [PubMed] [Google Scholar]
- 34.Kemppainen JA, Langley E, Wong CI, Bobseine K, Kelce WR, Wilson EM. Mol Endocrinol. 1999;13(3):440–54. doi: 10.1210/mend.13.3.0255. [DOI] [PubMed] [Google Scholar]
- 35.Krishnan AV, Zhao X-Y, Swami S, Brive L, Peehl DM, Ely KR, Feldman D. Endocrinology. 2002;143(5):1889–1900. doi: 10.1210/endo.143.5.8778. [DOI] [PubMed] [Google Scholar]
- 36.Ray DW, Suen C-S, Brass A, Soden J, White A. Mol Endocrinol. 1999;13(11):1855–1863. doi: 10.1210/mend.13.11.0376. [DOI] [PubMed] [Google Scholar]
- 37.Savory JG, Prefontaine GG, Lamprecht C, Liao M, Walther RF, Lefebvre YA, Hache RJ. Mol Cell Biol. 2001;21(3):781–93. doi: 10.1128/MCB.21.3.781-793.2001. [DOI] [PMC free article] [PubMed] [Google Scholar]
- 38.Koyano S, Saito Y, Nagano M, Maekawa K, Kikuchi Y, Murayama N, Fujino T, Ozawa S, Nakajima T, Matsumoto K, Saito H, Sawada J. J Pharmacol Exp Ther. 2003;307(1):110–6. doi: 10.1124/jpet.103.054155. [DOI] [PubMed] [Google Scholar]
- 39.Tamrazi A, Carlson KE, Daniels JR, Hurth KM, Katzenellenbogen JA. Mol Endocrinol. 2002;16(12):2706–19. doi: 10.1210/me.2002-0250. [DOI] [PubMed] [Google Scholar]
- 40.Starka L. J Steroid Biochem Mol Biol. 2003;87(1):27–34. doi: 10.1016/s0960-0760(03)00383-2. [DOI] [PubMed] [Google Scholar]
- 41.Maruvada P, Baumann CT, Hager GL, Yen PM. J Biol Chem. 2003;278(14):12425–32. doi: 10.1074/jbc.M202752200. [DOI] [PubMed] [Google Scholar]
- 42.Gao W, Bohl CE, Dalton JT. Chem Rev. 2005;105(9):3352–70. doi: 10.1021/cr020456u. [DOI] [PMC free article] [PubMed] [Google Scholar]
- 43.Darimont BD, Wagner RL, Apriletti JW, Stallcup MR, Kushner PJ, Baxter JD, Fletterick RJ, Yamamoto KR. Genes Dev. 1998;12(21):3343–56. doi: 10.1101/gad.12.21.3343. [DOI] [PMC free article] [PubMed] [Google Scholar]
- 44.Estebanez-Perpina E, Moore JM, Mar E, Delgado-Rodrigues E, Nguyen P, Baxter JD, Buehrer BM, Webb P, Fletterick RJ, Guy RK. J Biol Chem. 2005;280(9):8060–8. doi: 10.1074/jbc.M407046200. [DOI] [PubMed] [Google Scholar]
- 45.Yoon HG, Wong J. Mol Endocrinol. 2006;20(5):1048–60. doi: 10.1210/me.2005-0324. [DOI] [PubMed] [Google Scholar]
- 46.Gorlich D, Kutay U. Annu Rev Cell Dev Biol. 1999;15:607–60. doi: 10.1146/annurev.cellbio.15.1.607. [DOI] [PubMed] [Google Scholar]
- 47.Cutress ML, Whitaker HC, Mills IG, Stewart M, Neal DE. J Cell Sci. 2008;121(Pt 7):957–68. doi: 10.1242/jcs.022103. [DOI] [PubMed] [Google Scholar]
- 48.Freedman ND, Yamamoto KR. Mol Biol Cell. 2004;15(5):2276–86. doi: 10.1091/mbc.E03-11-0839. [DOI] [PMC free article] [PubMed] [Google Scholar]
- 49.Kaku N, Matsuda KI, Tsujimura A, Kawata M. Endocrinology. 2008 doi: 10.1210/en.2008-0137. [DOI] [PMC free article] [PubMed] [Google Scholar]


