

Abstract
Purpose
Average survival of CTCL is associated with clinical stage at diagnosis, where stage-I has a favorable survival prognosis, while patients with more advanced stages succumb to their disease within 5 years. While the majority of patients present with an early stage CTCL, 15–20% of them will inevitably progress. Current state-of-the-art clinical criteria cannot identify individuals with stage-I disease who are at risk of progression. The purpose of the current work is to gain novel molecular insight into the pathophysiology of CTCL in order to be able to identify patients with poor vs. favorable prognosis. Our previous work used microarray analysis of skin biopsies from 62 CTCL patients to perform an unsupervised analysis of gene expression, which revealed three distinct transcription profile clusters.
Experimental Design
In the present study, we utilized RT-PCR to confirm gene expression levels for a subset of representative genes in each cluster. We also performed a Kaplan-Meier analysis of survival and disease progression based on the six years of clinical follow-up.
Results
Our RT-PCR results confirmed upregulation of representative genes for each cluster, while the clinical analysis documents that all stage-I cases that progressed to stage-II and beyond were in poor and intermediate prognosis clusters 1 and 3 and none were in a favorable prognosis cluster 2. This analysis also identified certain genes that were preferentially expressed in favorable (e.g. WIF-1) vs. poor (e.g. IL-17F) prognosis clusters.
Conclusion
This work suggests that it may be possible to stratify CTCL patients into low, intermediate and high risk groups based on gene expression.
Keywords: Cutaneous T Cell Lymphoma (CTCL), gene expression, RT-PCR, IL-17, Th17, Wnt and WIF-1
INTRODUCTION
Cutaneous T-cell Lymphoma (CTCL) is a term formally adopted in 1979 to describe a group of lymphoproliferative disorders characterized by localization of neoplastic T lymphocytes to the skin (1). CTCL represents a heterogeneous group of non-Hodgkin lymphomas with mycosis fungoides (MF) and its leukemic variant Sezary Syndrome (SS) being the most common forms. Approximately 16,000–20,000 individuals are affected by CTCL in the United States with ~1,500 new cases being reported each year (2–4). The incidence of CTCL is increasing with one study from 1973 to 2002 documenting a 3.4 fold increase during the course of the study (2). This disease primarily affects individuals who are >50 years of age, with a slight predilection for black and/or male individuals (2, 5). The molecular pathogenesis of CTCL remains unknown.
Average survival after the diagnosis of CTCL is associated with the clinical stage at time of diagnosis. Early stage (i.e., stage IA and IB) disease has an indolent course, with normal or near normal life expectancy in stage IA disease and a favorable 5 year survival rate (i.e. ~100% for stage IA and 95% for stage IB) (6, 7). In contrast, more advanced stages of CTCL are associated with recalcitrant disease and poor 5 year survival rates (Table 1). In particular stage IV, SS disease has a 5 year survival rate ranging from 30%–51% (6–8). Most CTCL patients present with an early stage (i.e., IA or IB) disease (6, 7, 9). However, ~ 10–20% of these patients will have a progressive and fatal clinical disease, while the rest will have a favorable survival and will experience an indolent course (6, 7, 9). At the same time while most patients with an advanced CTCL will have a poor prognosis, a minority of these patients will survive for much longer than 5 years. Early identification of patients at risk of progression would allow for earlier use of more aggressive therapies. Unfortunately, currently there are no molecular/biological markers available to predict which patients with early stage CTCL will progress or which patients with an advanced disease will enjoy a longer than expected life.
Table 1.
| Clinical Stage | 5 Year Disease Specific Survival | 15 Year Disease Specific Survival | Mean Survival |
|---|---|---|---|
| IA | 96% | 98% | Normal Life Expectancy |
| IB | 95% | 85% | 12.9 years |
| IIA | 84% | 71% | |
| IIB | 56% | 32% | 4 years |
| III | 65% | 49% | |
| IV | 30%–51% | 14% | 1.5–5.1 years |
To elucidate such prognostic molecular markers and to gain additional insight in disease etiology we previously performed a microarray gene expression analysis of skin samples from 62 CTCL patients, who presented with various clinical stages at the time of biopsy and diagnosis (Table 2) (10). This work revealed three distinct transcription profile clusters (i.e., clusters 1, 2 and 3), where clusters 1 and 3 contained a mix of stage I – IV disease patients, while cluster 2 contained mostly stage I and only a few cases of advanced disease patients (Table 2) (10). It is notable that stage I disease patients were well represented in each cluster (i.e., cluster 1 had 11, cluster 2 had 18 and cluster 3 had 14 stage I patients) (Table 2). In fact, 42 out of 62, or 68% of all patients in the study had stage I disease at the time of diagnosis. The described three distinct transcription profile clusters were associated with different clinical courses. During the initial three year follow up, cluster 2 genes associated with the best clinical outcome and good response to therapy while cluster 1 and 3 genes associated with the worst and intermediate clinical outcomes, respectively, and poor response to therapy (10).
Table 2.
Clinical Stages of CTCL Patients Enrolled in the Study
 |
In the present study, we utilized RT-PCR analysis to confirm gene expression findings in the three cluster model derived from the microarray study. We further correlated the obtained molecular data with an additional three years of clinical follow up. These findings confirm the previously observed clinical trends and demonstrate that all of the cases of stage I CTCL that progressed to stage II or greater disease were in clusters 1 and 3 and none were in cluster 2. We also utilized an RT-PCR expression analysis to identify specific genes that are preferentially expressed in favorable vs. poor prognosis patients.
PATIENTS, MATERIALS AND METHODS
Patients and Samples
All patients were enrolled in an IRB-approved study protocol with informed consent. Patients were recruited from the Cutaneous Lymphoma Clinic at the Dana Farber Cancer Institute (DFCI)/Brigham and Women’s Hospital (BWH). An extensive chart review was conducted for all patients to collect information on clinical parameters and outcomes between January 2003 and January 2009. Data was stored in a study database. All tissue samples were obtained and processed as previously described (10). Briefly, six-mm punch biopsies from involved skin were collected from 62 patients between January 26, 2003 and June 1, 2005.
The obtained 6 mm biopsies were immediately snap-frozen in liquid nitrogen. Tissue was powdered in liquid nitrogen (Cryo-Press; Microtec Co, Chiba, Japan), and total RNA was extracted using Trizol (Invitrogen, Carlsbad, CA) and converted to cDNA using the iScript RT-PCR kit (Bio-Rad, Hercules CA) according to the manufacturer’s instructions. The biopsy samples analyzed in this report are the same samples that were analyzed by microarray in the previous study (10).
Quantitative Real-Time Reverse Transcription-PCR Gene Expression Analysis
A set of genes that were most strongly upregulated in each of the three clusters were selected for confirmation by RT-PCR analysis. Primers for candidate human genes were designed using Primer 3 web software (11) and were purchased from Invitrogen Inc. RT-PCR was performed utilizing the obtained cDNA from CTCL patients and iScript RT-PCR mix (Bio-Rad) on Bio-Rad iCycler as previously described (12). The obtained data was analyzed using XLSTAT 2009 software to obtain Kaplan-Meier curves (13). p values were calculated using the logrank test (14).
RESULTS
RT-PCR Expression Analysis Confirms Three Distinct Molecular CTCL Signatures
While microarray analysis provides an unprecedented capacity for whole genome expression profiling, it has a number of inherent pitfalls that have been described elsewhere (15–17). Quantitative Real-Time PCR (RT-PCR) is a commonly used validation tool for confirming gene expression results obtained from microarray analysis and currently serves as the “gold standard” approach for evaluation of gene expression (16). Thus, we wanted to confirm our previous microarray findings utilizing RT-PCR technology. Over 25 genes from all three clusters (i.e., poor prognosis cluster 1, favorable prognosis cluster 2 and intermediate prognosis cluster 3) were selected based on the previous microarray results. Expression of these genes was systematically evaluated in the previously collected 62 CTCL patient biopsy samples using RT-PCR. The results of RT-PCR analysis are documented in figure 1 and supplemental figures 1–3.
Figure 1.

Validation of previous microarray results: RT-PCR Gene Expression Analysis in 62 CTCL patients. Quantitative RT-PCR expression of selected genes that were documented to be upregulated based on the previous microarray analysis in cluster 1 (A), cluster 2 (B) and cluster 3 (C) patients (10).
RT-PCR gene expression analysis confirms our previous microarray data and indicates that in CTCL there are three distinct genetic patterns/signatures (Figure 1). Specifically, poor prognosis cluster 1 genes were significantly upregulated in cluster 1 patients and, to our surprise, were also heterogeneously expressed in cluster 3, but not in cluster 2 patients (Figure 1A and Supplemental figure 1). At the same time, intermediate prognosis cluster 3 genes were selectively upregulated in cluster 3 patients with a modest overlap with cluster 1, but no overlap with cluster 2 patients (Figure 1C and Supplemental Figure 3). Favorable prognosis cluster 2 genes were heterogeneously upregulated in cluster 2 patients with some degree of co-expression in cluster 3 patients (Figure 1B and Supplemental Figure 2). These findings indicate that biologically, there is a significant overlap between clusters 1 and 3 as well as clusters 2 and 3 patients, but not between clusters 1 and 2. In this model, cluster 3 may represent an intermediate disease form between clusters 1 and 2 being located on this putative spectrum closer to cluster 1 than cluster 2 (Figure 1).
Correlation of Molecular Clustering in CTCL with Clinical Disease Outcomes
In the previous study we correlated the microarray gene expression with the prospective three year clinical follow up from the time of biopsy (10). At that time the clinical follow up results did not reach statistical significance. While 36 months is a significant period of time, previous clinical experimental work documents that in CTCL patients that are “destined” to progress, the progression may take up to 5 years to occur from the time of diagnosis (9). Also, it is notable that only rare patients will experience progression after 5 years of stable disease (9). Thus, we wanted to extend the time of clinical follow up to six years (2003–2009) and correlate the new microarray/RT-PCR genetic data with the six years or 72 month of prospective clinical analysis from the time of biopsy. The Kaplan-Meier analysis of this clinical follow up is presented in figure 2.
Figure 2.
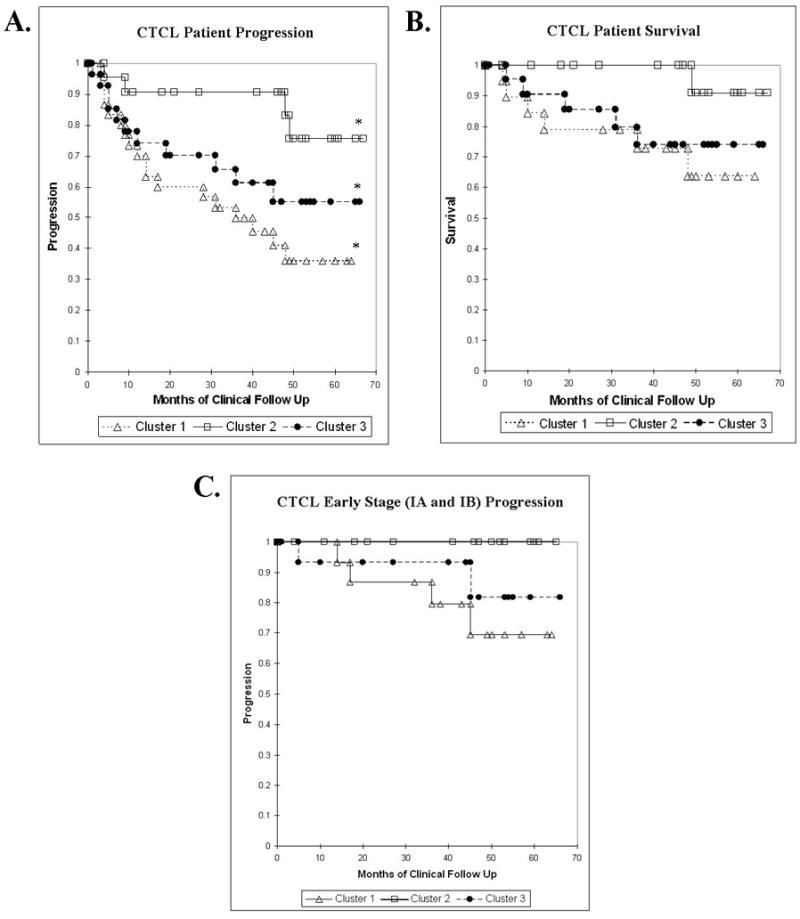
Kaplan-Meier Analysis of CTCL Patients A. CTCL Disease Progression, p=0.019 B. CTCL Survival, p=0.136 C. Progression of Patients with Stage I Disease, p=0.107.
The new extended 6-year clinical analysis of CTCL progression confirms our previous observations and demonstrates that cluster 2 has the least, cluster 1 has the most, while cluster 3 has an intermediate number of progression events (i.e., advancement to a higher CTCL stage and/or death) (Figure 2A). Logrank test of the presented Kaplan-Meier analysis documents that these three clusters are statistically different (p=0.019). The highest statistical difference is observed between the worst and the best prognosis clusters 1 and 2 respectively (p=0.004).
Similarly, with respect to survival, cluster 2 patients enjoy a favorable 6-year survival of 91%, cluster 1 has a poor survival of only 64%, while cluster 3 has an intermediate survival of 74% (Figure 2B). A statistically significant survival difference was observed between clusters 1 and 2 (p=0.035). However, due to a low number of events the survival differences between the three clusters did not reach statistical significance (p=0.136).
Since each cluster had a large number of stage I disease patients (Table 2), we specifically analyzed the progression of these patients towards more advanced disease (i.e., stage IIB and beyond) with respect to their genetic clusters. According to the analysis presented in Figure 2C, cluster 1 stage I patients had the highest 6-year progression rate of 31%, while cluster 3 stage I patients had an intermediate progression rate of 19%. Strikingly, none of the cluster 2 stage I patients have progressed towards advanced disease (i.e., progression rate of 0%) in the period of six years. It is also notable that cluster 2 had the largest number of stage I patients (i.e., 18/20 stage I patients in cluster II vs. 11/20 patients in cluster 1 and 14/22 patients in cluster 3). A statistically significant difference was observed in comparison of cluster 1 and cluster 2 early stage CTCL patients (p=0.035) with regard to progression. However, the three cluster analysis for early CTCL stage progression did not reach statistical significance (p=0.107). In addition, cluster 2 had only one case of stage III disease patient (patient M48). This patient was diagnosed in 1998 and progressed to stage III in 2003 at which point a biopsy was taken for the study. This patient progressed to stage IV disease in 2004 and despite the poor prognosis typically associated with this stage, he continues to maintain good health on appropriate therapy and regularly comes for his clinical follow up at the Brigham and Women’s Hospital (Boston, MA). These data suggest that stage I and possibly advanced disease patients, who belong to a molecular cluster 2 have a favorable prognosis in comparison to CTCL patients in other clusters.
Molecular Markers for Poor vs. Favorable Disease Prognosis
The initial microarray analysis of gene expression documented that cluster 1 patients upregulated a number of signaling pathways involved in immune response and T cell activation including IL-2 receptor signaling, TNF pathway, Th17 pathway and others (10). Current RT-PCR analysis successfully confirmed upregulation of these genes and pathways in cluster 1 patients (Figure 1A and Supplemental Figure 1). We further wanted to question whether any of these genes/pathway are predictive for progression. We performed RT-PCR analysis which specifically highlighted Th17 pathway genes (i.e., IL-17A, IL-17F, IL-26 and IL-21 Receptor) that were preferentially upregulated in cluster 1 patients (Figures 1A, 2A and Supplemental Figure 4). Furthermore, the expression of IL-17F was observed only in clusters 1 and 3, but not cluster 2 patients and appears to strongly correlate with an advanced and/or progressive disease (Figure 3A).
Figure 3.
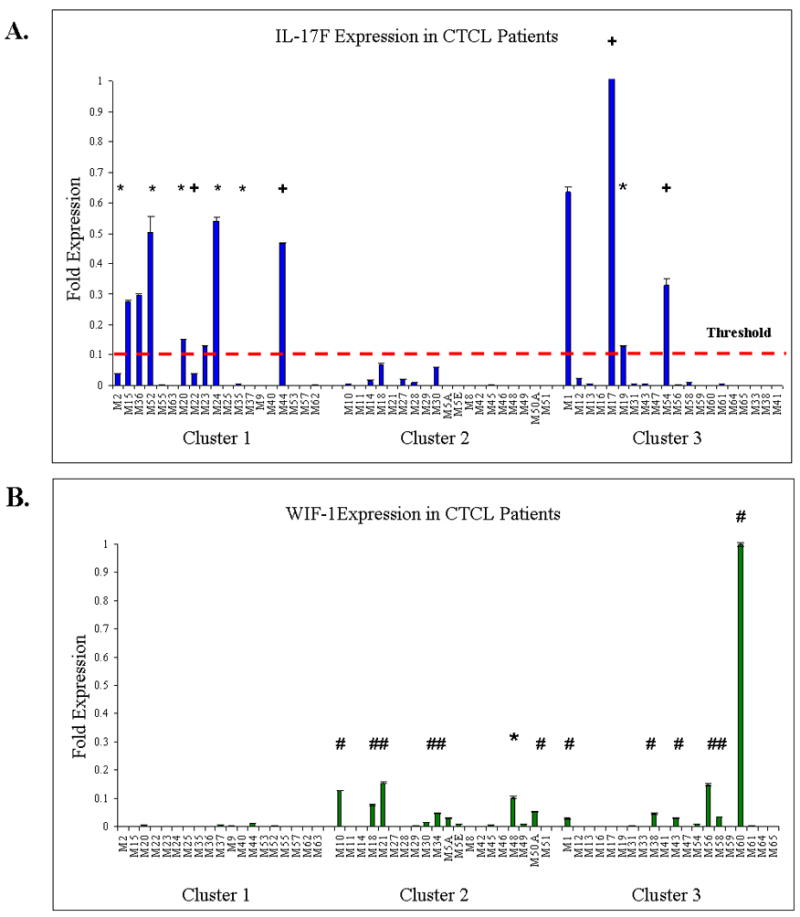
Expression of molecular markers in Cluster 1–3 CTCL Patients. A. IL-17F marker is expressed in cluster 1 and 3 patients and is upregulated in a number of patients with progressive disease (*-progression, +-progression and death). B. WIF-1 is expressed in cluster 1 and 3 favorable prognosis patients (#-Stage I stable disease, *-progression). Patient M48: Diagnosed in 1998 with advanced disease. Progressed to Stage III in 2003 and to Stage IV in 2004. Currently doing well on appropriate therapy.
On the other end of the spectrum, microarray analysis for cluster 2 patients documented upregulation of a number of structural genes and pathways involved in keratinocyte and epidermal differentiation and proliferation including cystatin, involucrin, loricrin, filaggrin, late cornified envelope (LCE2B), WNT and TGF-β signaling (10). Furthermore, in contrast to clusters 1 and 3, cluster 2 demonstrated minimal upregulation of immune response genes. Upregulation of the aforementioned structural and signaling genes in cluster 2 patients is documented in figures 1B, 3B and supplemental figure 2. Notably, for WIF-1, a member of WNT signaling pathway, the expression is restricted to clusters 2 and 3 patients and appears to correlate with a favorable disease outcome for stage I patients (Figure 3B). Furthermore, WIF-1 was also upregulated in the case of M48 stage III disease patient, who performed significantly better than expected for his disease stage (Figure 3B). Thus, the expression of proliferation, apoptosis, inflammatory response and especially Th17 genes appear to be predictive of progressive and recalcitrant disease in stage I and advanced CTCL patients, while the expression of WIF-1, structural genes and the lack of expression of inflammatory response genes appears to correlate with an indolent and favorable disease course.
DISCUSSION
In this study we have confirmed the expression levels of a select group of genes in previously identified CTLC clusters by RT-PCR. This RT-PCR analysis revealed a significant degree of genetic overlap between clusters 1 and 3 and clusters 2 and 3, but no such overlap could be observed between clusters 1 and 2 (Figure 1). Thus, cluster 3 appears to be a biologically distinct cluster that also serves as an intermediate link between clusters 1 and 2. Based on the six years of clinical analysis the identified clusters associated with statistically significant differences in clinical outcomes, where with respect to progression cluster 1 had the worst, cluster 2 had the best, while cluster 3 had an intermediate prognosis (Figure 2A, p=0.019). With respect to survival cluster 1 had a significantly poor prognosis of 64% in comparison with 91% survival in cluster 2 (p=0.037), while an intermediary cluster 3 had a survival rate of 74% (Figure 2B). With respect to the stage I disease patients, clusters 1 and 3 had a significantly worse prognosis than cluster 2, where no stage I patients progressed towards advanced disease during the six years in the study (Figure 2C). Comparison of cluster 1 and cluster 2 early stage CTCL patients revealed a statistically significant difference in disease progression (p=0.035). Finally, select analysis of gene expression suggests that Th17 pathway genes (e.g., IL-17F) are expressed in cluster 1 and 3 advanced disease patients and in early stage patients that are likely to progress to advanced disease, while WNT signaling genes (e.g. WIF-1) are upregulated in indolent stage I and advanced disease patients with favorable prognosis (Figure 3).
While the etiology of CTCL remains largely unknown the current work suggests that progressive disease is associated with ongoing expression of immune response, viral response, proliferation/apoptosis genes by the infiltrating neoplastic T cells (10). This notion is further supported by other studies that similar to our work document upregulation STAT 1, 3 and 5, tyrosine kinases, TNF signaling genes, proliferation/apoptosis genes and other immune response genes in progressive CTCL (10, 18–20). It is further notable that a number of recent reports indicate that Th17 cells may be contributing towards carcinogenesis of CTCL (21, 22).
Based on these findings a reasonable molecular mechanism may be postulated, where neoplastic T cells that elaborate extensive array of inflammatory cytokines and promote local activation of immune response mediator cells and keratinocytes are likely to accelerate proliferation, generate higher levels of oxygen radicals and other toxic metabolites. Such microenvironment coupled with increased proliferation and apoptosis may further disrupt tissue homeostasis, promote genomic instability and lead to CTCL progression. In this scenario upregulated cytokines and immune response genes act as accelerators of cancer progression. On the other hand, in the disease where neoplastic T cells are not hardwired to elaborate these inflammatory cytokines there is less drive towards genomic instability and cancer progression and keratinocytes are able to maintain tissue homeostasis (as evidenced by upregulation of the differentiation/structural component genes). Thus, without such acceleration, the disease appears to follow a more indolent course.
In the most advanced, Sezary cell stage of CTLC much experimental work has been accomplished to identify a specific genetic signature pattern for these cells in peripheral blood mononuclear cells (PBMCs). According to the recent work by Nebozshyn et al. expression of STAT4, GATA-3, PLS3, CD1D and TRAIL genes is able to identify SS cells with 90% accuracy (23), while more expanded 10 gene expression analysis is able to predict SS patients that are likely to succumb to their disease in <6 month (24). Such research progress is encouraging for it suggests that with further work we may soon be able to offer personalized diagnosis and therapy to CTCL patients with early as well as advanced disease stages.
In conclusion, the current work documents three distinct CTCL disease clusters and indicates that it may be possible using a select group of molecular markers to assign CTCL patients to a specific cluster. Early identification of poor vs. favorable prognosis patients will enable us to offer more aggressive and timely treatment options for these patients, while sparing patients with an indolent disease from exposure to toxic medications. These data provide valuable clinical and biological insight into CTCL disease etiology and clinical behavior. While the presented data is intriguing, these results will need to be validated by a larger genetic analysis of CTCL patients.
Statement of Translational Relevance
In most cases, early stage CTCL patients experience an indolent disease course with a favorable prognosis. However, 15–20% of stage I disease patients will progress to higher stages that are associated with significant morbidity and mortality. Unfortunately, it is not possible to predict based on the available clinical criteria which individuals are likely to progress. In the current study we validate three distinct genetic signature patterns that can help segregate patients into low, intermediate and high risk of progression clusters. The current work suggests that it may be possible to use a select group of genes to identify stage I CTCL patients with poor disease prognosis. Such stratification may enable clinicians to effectively detect and treat high-risk CTCL at an early stage, while at the same time spare the patients with low risk/indolent disease from exposure to toxic and expensive medications.
Supplementary Material
Acknowledgments
This work was supported by a grant from the National Institutes of Health SPORE program (P50 CA093683 to Dr. Kupper). We thank Dr. David Harrington for his assistance with statistical analysis of the data.
Footnotes
This work was presented in abstract form at the 69th annual meeting of the Society for Investigative Dermatology, Montreal, QC, Canada on May 7, 2009.
Conflict-of-interest disclosure: The authors declare no competing financial interests.
References
- 1.Lamberg SI, Bunn PA., Jr Cutaneous T-cell lymphomas. Summary of the Mycosis Fungoides Cooperative Group-National Cancer Institute Workshop. Arch Dermatol. 1979;115:1103–5. doi: 10.1001/archderm.115.9.1103. [DOI] [PubMed] [Google Scholar]
- 2.Criscione VD, Weinstock MA. Incidence of cutaneous T-cell lymphoma in the United States, 1973–2002. Arch Dermatol. 2007;143:854–9. doi: 10.1001/archderm.143.7.854. [DOI] [PubMed] [Google Scholar]
- 3.Siegel RS, Pandolfino T, Guitart J, Rosen S, Kuzel TM. Primary cutaneous T-cell lymphoma: review and current concepts. J Clin Oncol. 2000;18:2908–25. doi: 10.1200/JCO.2000.18.15.2908. [DOI] [PubMed] [Google Scholar]
- 4.Willemze R, Jaffe ES, Burg G, et al. WHO-EORTC classification for cutaneous lymphomas. Blood. 2005;105:3768–85. doi: 10.1182/blood-2004-09-3502. [DOI] [PubMed] [Google Scholar]
- 5.Bradford PT, Devesa SS, Anderson WF, Toro JR. Cutaneous lymphoma incidence patterns in the United States: a population-based study of 3884 cases. Blood. 2009;113:5064–73. doi: 10.1182/blood-2008-10-184168. [DOI] [PMC free article] [PubMed] [Google Scholar]
- 6.Kim YH, Chow S, Varghese A, Hoppe RT. Clinical characteristics and long-term outcome of patients with generalized patch and/or plaque (T2) mycosis fungoides. Arch Dermatol. 1999;135:26–32. doi: 10.1001/archderm.135.1.26. [DOI] [PubMed] [Google Scholar]
- 7.Kim YH, Liu HL, Mraz-Gernhard S, Varghese A, Hoppe RT. Long-term outcome of 525 patients with mycosis fungoides and Sezary syndrome: clinical prognostic factors and risk for disease progression. Arch Dermatol. 2003;139:857–66. doi: 10.1001/archderm.139.7.857. [DOI] [PubMed] [Google Scholar]
- 8.Vidulich KA, Talpur R, Bassett RL, Duvic M. Overall survival in erythrodermic cutaneous T-cell lymphoma: an analysis of prognostic factors in a cohort of patients with erythrodermic cutaneous T-cell lymphoma. Int J Dermatol. 2009;48:243–52. doi: 10.1111/j.1365-4632.2009.03771.x. [DOI] [PubMed] [Google Scholar]
- 9.Kim YH, Jensen RA, Watanabe GL, Varghese A, Hoppe RT. Clinical stage IA (limited patch and plaque) mycosis fungoides. A long-term outcome analysis. Arch Dermatol. 1996;132:1309–13. [PubMed] [Google Scholar]
- 10.Shin J, Monti S, Aires DJ, et al. Lesional gene expression profiling in cutaneous T-cell lymphoma reveals natural clusters associated with disease outcome. Blood. 2007;110:3015–27. doi: 10.1182/blood-2006-12-061507. [DOI] [PMC free article] [PubMed] [Google Scholar]
- 11.Rozen S, Skaletsky H. Primer3 on the WWW for general users and for biologist programmers. Methods Mol Biol. 2000;132:365–86. doi: 10.1385/1-59259-192-2:365. [DOI] [PubMed] [Google Scholar]
- 12.Litvinov IV, Vander Griend DJ, Xu Y, Antony L, Dalrymple SL, Isaacs JT. Low-calcium serum-free defined medium selects for growth of normal prostatic epithelial stem cells. Cancer Res. 2006;66:8598–607. doi: 10.1158/0008-5472.CAN-06-1228. [DOI] [PMC free article] [PubMed] [Google Scholar]
- 13.Kaplan ELaMP. Nonparametric estimation from incomplete observations. Journal of the American Statistical Association. 1958;53:457–81. [Google Scholar]
- 14.Mantel N. Evaluation of survival data and two new rank order statistics arising in its consideration. Cancer Chemother Rep. 1966;50:163–70. [PubMed] [Google Scholar]
- 15.Chuaqui RF, Bonner RF, Best CJ, et al. Post-analysis follow-up and validation of microarray experiments. Nat Genet. 2002;32 (Suppl):509–14. doi: 10.1038/ng1034. [DOI] [PubMed] [Google Scholar]
- 16.Morey JS, Ryan JC, Van Dolah FM. Microarray validation: factors influencing correlation between oligonucleotide microarrays and real-time PCR. Biol Proced Online. 2006;8:175–93. doi: 10.1251/bpo126. [DOI] [PMC free article] [PubMed] [Google Scholar]
- 17.Wurmbach E, Yuen T, Sealfon SC. Focused microarray analysis. Methods. 2003;31:306–16. doi: 10.1016/s1046-2023(03)00161-0. [DOI] [PubMed] [Google Scholar]
- 18.Fantin VR, Loboda A, Paweletz CP, et al. Constitutive activation of signal transducers and activators of transcription predicts vorinostat resistance in cutaneous T-cell lymphoma. Cancer Res. 2008;68:3785–94. doi: 10.1158/0008-5472.CAN-07-6091. [DOI] [PubMed] [Google Scholar]
- 19.Kennah E, Ringrose A, Zhou LL, et al. Identification of tyrosine kinase, HCK, and tumor suppressor, BIN1, as potential mediators of AHI-1 oncogene in primary and transformed CTCL cells. Blood. 2009;113:4646–55. doi: 10.1182/blood-2008-08-174037. [DOI] [PubMed] [Google Scholar]
- 20.Tracey L, Villuendas R, Dotor AM, et al. Mycosis fungoides shows concurrent deregulation of multiple genes involved in the TNF signaling pathway: an expression profile study. Blood. 2003;102:1042–50. doi: 10.1182/blood-2002-11-3574. [DOI] [PubMed] [Google Scholar]
- 21.Chong BF, Wilson AJ, Gibson HM, et al. Immune function abnormalities in peripheral blood mononuclear cell cytokine expression differentiates stages of cutaneous T-cell lymphoma/mycosis fungoides. Clin Cancer Res. 2008;14:646–53. doi: 10.1158/1078-0432.CCR-07-0610. [DOI] [PMC free article] [PubMed] [Google Scholar]
- 22.Ciree A, Michel L, Camilleri-Broet S, et al. Expression and activity of IL-17 in cutaneous T-cell lymphomas (mycosis fungoides and Sezary syndrome) Int J Cancer. 2004;112:113–20. doi: 10.1002/ijc.20373. [DOI] [PubMed] [Google Scholar]
- 23.Nebozhyn M, Loboda A, Kari L, et al. Quantitative PCR on 5 genes reliably identifies CTCL patients with 5% to 99% circulating tumor cells with 90% accuracy. Blood. 2006;107:3189–96. doi: 10.1182/blood-2005-07-2813. [DOI] [PMC free article] [PubMed] [Google Scholar]
- 24.Kari L, Loboda A, Nebozhyn M, et al. Classification and prediction of survival in patients with the leukemic phase of cutaneous T cell lymphoma. J Exp Med. 2003;197:1477–88. doi: 10.1084/jem.20021726. [DOI] [PMC free article] [PubMed] [Google Scholar]
Associated Data
This section collects any data citations, data availability statements, or supplementary materials included in this article.