

Abstract
Objectives
To evaluate the safety of gadoxetic acid disodium (Gd-EOB-DTPA) magnetic resonance imaging (MRI) and its efficacy in characterizing liver lesions.
Methods
Lesion characterization and classification using combined (unenhanced and Gd-EOB-DTPA–enhanced) MRI were compared with those using unenhanced MRI and contrast-enhanced spiral computed tomography (CT) using on-site clinical and off-site blinded evaluations for patients with focal liver lesions.
Results
Gadoxetic acid disodium was well tolerated in this study. For the clinical evaluation, more lesions were correctly characterized using combined (unenhanced and Gd-EOB-DTPA–enhanced) MRI than using unenhanced MRI and spiral CT (96% vs 84% and 85%, respectively; P ≤ 0.0008). For the blinded evaluation, more lesions were correctly characterized using combined MRI compared with using unenhanced MRI (61%–76% vs 48%–65%, respectively; P ≤ 0.0012 for 2/3 readers); when compared with spiral CT, a similar proportion of lesions were correctly characterized.
Conclusions
Gadoxetic acid disodium–enhanced MRI is of clinical benefit relative to unenhanced MRI and spiral CT for a radiological diagnosis of liver lesions.
Keywords: liver lesion, magnetic resonance, computed tomography, contrast agent, Gd-EOB-DTPA
Improved imaging accuracy in hepatic lesion characterization is crucial for appropriate patient triage. Dynamic contrast-enhanced magnetic resonance imaging (MRI) has remained for more than 10 years as the established technique to characterize detected liver lesions1–4; however, further improvement in lesion detection and characterization would be desirable. Currently approved liver-specific contrast agents, such as ferumoxides and mangafodipir,5–7 lack dynamic enhancement information,8 and dual contrast-enhanced MRI is cumbersome and not in widespread use.9,10
Gadoxetic acid disodium (Gd-EOB-DTPA: Primovist [Bayer Schering Pharma AG, Berlin, Germany], Eovist [Bayer Healthcare Pharmaceuticals, Wayne, NJ], and EOB-Primovist [Bayer Yakuhin, Osaka, Japan]) is a newly developed liver-specific MRI contrast agent that was first approved in Europe in 2004 and is also approved in many countries of the Asia-Pacific region. More recently, in July 2008, Gd-EOB-DTPAwas approved by the Food and Drug Administration in the United States for intravenous use in T1-weighted (TW1) MRI of the liver to detect and characterize lesions in adults with known or suspected focal liver lesions. Gadoxetic acid disodium has extracellular properties similar to conventional Gd-containing extracellular MRI contrast agents but has the additional property of selective hepatocyte uptake, with approximately 50% of the injected dose taken up via the organic anion transporter protein (OATP-1) followed by biliary excretion.11–13 Gadoxetic acid disodium also has higher relaxivity rates compared with Gd-DTPA (6.9 L mmol−1 s−1 in plasma at 1.5 T vs 4.1 L mmol−1 s−1 in plasma at 1.5 T).14 Phase 1 to 3 trials showed good tolerance15 and improvement in lesion characterization16–18 and detection.19,20
Here, we present the findings of a phase 3 trial that, in addition to safety evaluations, was designed to assess whether combined unenhanced and Gd-EOB-DTPA–enhanced MRI improved liver lesion characterization and classification when compared primarily with unenhanced MRI alone and secondarily with dual-phase spiral (helical) computed tomography (CT).
Materials and Methods
Study Design
This open-label, phase 3 study was performed at 18 institutions in the United States. It was an intraindividual comparison of the diagnostic performance of combined unenhanced and Gd-EOB-DTPA–enhanced MRI and the unenhanced MRI or spiral CT to determine liver lesion characterization (lesion-specific diagnosis) and classification (benign/malignant). The trial protocol was approved by a central ethics committee and 18 local institutional review boards. All participating patients gave informed written consent.
Patients and Liver Lesions
Patients 18 years and older with suspected or known liver lesions who had been referred to have routine CT and MRI were eligible to be included in the trial. A total of 240 patients enrolled in the trial.
Patients were excluded if they could be placed into one of the following categories: underwent liver surgery before MRI, pregnant or breast-feeding mother, previously received Gd-EOB-DTPA or other study drugs within 30 days before MRI, received Gd-DTPA within 24 hours or other liver-specific contrast agent within 2 weeks before MRI, clinically unstable, scheduled for biopsy or surgery within 72 hours of MRI, history of anaphylactoid reactions to medications or contrast media, lack of appropriate standard of reference (SOR) examination, or not adhering to specified time parameters.
Standard of Reference
All lesions or groups of lesions in the study were verified by a predefined, lesion-specific, and ethically justifiable SOR, generally within 3 months of MRI. The following lesion-specific SORs were considered valid if performed within the following timeframes: malignancies, biopsy within 3 months; focal liver fibrosis or fat, biopsy within 12 months; regenerative nodules, biopsy within 4 weeks; adenoma, biopsy within 6 months; focal nodular hyperplasia, biopsy or conventional dynamic contrast-enhanced MRI within 12 months; hemangiomas, conventional dynamic contrast-enhanced MRI or tagged cell scintigraphy (for lesions > 2 cm) within 12 months; liver cysts, sonography within 12 months; hydatid cysts, sonography and serology within 2 weeks; and abscess, aspiration and culture within 2 weeks.
Magnetic Resonance Contrast Agent
Gadoxetic acid disodium is a liver-specific MR contrast agent; its chemical profile, pharmacokinetic properties (hepatocellular uptake via OATP-1 of approximately 50% of the dose), relaxivity rates (6.9 L mmo−1 s−1 in plasma at 1.5 T), osmolality, viscosity, and physiological routes of excretion (balanced renal and biliary) have been described previously.11–13,15
The patients received a 25 μmol/kg body weight dose of a 0.25-mol/L solution of Gd-EOB-DTPA (volume range, 4.0–12.0 mL), which was bolus injected at 2 mL/s through a cubital intravenous line and then flushed with 30 mL of 0.9% saline.
Safety Evaluation
The patients were observed and evaluated for adverse events (AEs) for 72 hours after the administration of Gd-EOB-DTPA. All subjective and objective AEs were recorded. Vital signs, 12-lead electrocardiograms, and clinical laboratory tests (hematological, coagulation, and clinical chemistry tests and urinalysis) were obtained at multiple time points in all the patients.
Magnetic Resonance Imaging
Magnetic resonance imaging was performed using the 1.5-T MR Systems with phased array surface coils. Each patient first underwent the following precontrast sequences: T2W fast spin echo (FSE)/turbo spin echo/single-shot FSE/half-Fourier acquisition single-shot turbo spin-echo sequence (repetition time, ≥2000 milliseconds; echo time, 90–120 milliseconds; number of excitations, 1–4; matrix, 192–256 × 256; slice thickness, 5–8 mm; gap, 0–2 mm; breath hold and fat suppression, optional) and T1W 2-dimensional gradient-recalled echo (GRE) fast low-angle shot (FLASH) sequence with and without chemically selective fat suppression (repetition time, 100–200 milliseconds; echo time, ≤8 milliseconds; matrix, 128–256 × 256; slice thickness, 5–8 mm; gap, 0–2 mm). After completion of the intravenous injection of Gd-EOB-DTPA, breath-hold 2-dimensional GRE/FLASH T1 sequences in the arterial (10–20 seconds), portovenous (50–60 seconds), and equilibrium phases (100–120 seconds) were acquired. The T2W and T1W sequences were repeated 20 minutes after Gd-EOB-DTPA injection.
Computed Tomography
Biphasic spiral CTwas performed on predominantly single-detector scanners (100 to 150 kV; 180–300 mAs; pitch, 1 to 2; and slice thickness and reconstruction interval, 5 to 7 mm). Using a power injector, 3 to 5 mL/s (100–200 mL) of iodinated, nonionic contrast material was administered intravenously. Hepatic arterial and portal venous phase imagings were performed after a delay of 25 to 35 seconds and 45 to 70 seconds, respectively, after the start of contrast injection.
Image Evaluation
The MR and CT images were reviewed either unblindedly on site by one experienced clinical investigator per study site to mimic routine clinical practice or blindedly off site by 3 experienced abdominal image radiologists (readers 1, 2, and 3) who were not involved in the unblinded image review (blinded off-site evaluations were performed by a central core laboratory).
Lesion Identification
For correct lesion identification and to eliminate confusion in cases with multiple lesions, each SOR-proven lesion was marked on both the MR and CT images by the clinical investigator and assigned a unique number, which was used throughout the study on all imaging sequences.
Image Evaluation in the Clinical Study
For all MR images, the clinical investigator first assessed the T1W and T2W unenhanced images followed by the combined MR sequences (unenhanced images, T1W dynamic enhanced images, T1W delayed hepatocyte-specific images, and postcontrast T2W images). Each clinical investigator separately assessed the images from the dual-phase spiral CT. They recorded their evaluations with respect to characterization, classification, and confidence during the prospective reading in a detailed modality-specific record.
Image Evaluation in the Blinded Off-Site Review
The off-site evaluation was performed in 3 sessions separated by two 3-week intervals to minimize recall and memory bias. The readers were blinded to the patient-related information, the imaging technique, and the contrast information. During the first session, the readers evaluated all the unenhanced images (T1W and T2W) separately from the enhanced images (T1W dynamic, T1W delayed hepatocyte-specific images, and postcontrast T2W images) in a random patient order. In the second session, the combined MR images (unenhanced and dynamic and delayed) were evaluated. The dual-phase spiral CT images were reviewed during the third session. Each reader assessed every image for all the patients.
In both the on-site clinical and off-site blinded evaluations, the primary end point was the performance of combined MRI (unenhanced and Gd-EOB-DTPA–enhanced) compared with unenhanced MRI in characterizing focal lesions (as measured by the proportion of detected lesions with correct characterization). This intended to reflect real-life clinical practice because both unenhanced and enhanced MR images are used together for evaluation of lesions in clinical practice. Correct lesion characterization was achieved when radiological interpretation agreed with the SOR diagnosis.
Secondary end points included the comparison of the performance of combined MRI versus spiral CT in characterizing focal liver lesions in both the on-site clinical and off-site blinded evaluations and the comparison of the characterization performance of Gd-EOB-DTPA–enhanced MRI (dynamic and delayed hepatocyte-specific images [20 minutes after administration]) versus unenhanced MRI only in the blinded evaluation.
The clinical and blinded readers graded the confidence of characterization for each lesion on a 5-point scale for unenhanced MRI, combined MRI, and spiral CT data. A score of 1 indicated low or doubtful confidence that lesion morphology and enhancement were characteristic of a specific lesion type, whereas a score of 5 indicated highest confidence that the spiral CTand MRI features were characteristic of specific lesion types.
Analysis of discordant lesions, defined as those correctly characterized by one modality but incorrectly characterized by another modality, was performed in the clinical and blinded reviews.
Both the unblinded clinical on-site and blinded off-site readers classified each representative lesion as malignant, benign, or not assessable during the review of images from the unenhanced and combined MRI and CT. The readers also scored the confidence of classification of each individual lesion based on standard radiological signs on a 5-point scale, where 1 indicated low or doubtful confidence and 5 indicated complete confidence that the radiological features ascribed to the lesion were representative of each lesion category.
Accuracy, sensitivity, and specificity of lesion classification were calculated separately for spiral CT and for enhanced, unenhanced, and combined MRI compared with the SOR. Because the SOR was defined as the criterion standard, the assessment “not assessable” was not accepted as a result of the reference standard.
Statistical Analysis
The primary objectives were to calculate the proportion of detected lesions with correct characterization (lesion diagnosis) on combined MRI or enhanced MRI compared with that on unenhanced MRI and to show superiority. Performance in lesion characterization was evaluated on a per-lesion basis for each patient and for all the patients. Because some patients may have had multiple lesions detected and verified by the SOR, an adjustment of the 2-tailed McNemar test of paired proportions, proposed by Eliasziw and Donner21 to take into account clustering, was used for this hypothesis test at a 5% significance level.
Results
Of the 240 patients enrolled in the trial, 5 did not receive intravenous Gd-EOB-DTPA. A total of 197 patients had a valid lesion-specific SOR; however, 20 had protocol deviations and were excluded from the efficacy analysis. Thus, 177 patients were eligible to be included in the efficacy analysis. All 235 patients who received Gd-EOB-DTPA were included in the safety analysis. There were 124 men (53%) and 111 women (47%) with the mean age of 54.2 years (range, 22–81 years).
Safety of Gd-EOB-DTPA
The contrast medium was well tolerated by patients. Fifty-two AEs occurred in 39 (16.6%) of the 235 patients after administration of a contrast injection, of which 14 AEs in 12 patients (5.1%) were considered by the investigator to be possibly or probably drug related. None were considered definitely related to the study drug by the investigator. Adverse events considered possibly or probably related to the study drug were taste perversion (4 patients), headache (2 patients), vasodilatation (1 patient), nausea (1 patient), bundle branch block (1 patient), rash (1 patient), maculopapular rash (1 patient), dizziness (1 patient), diarrhea (1 patient), and dry mouth (1 patient). No patients discontinued the study. There were no clinically relevant changes in the clinical, electrocardiogram, or laboratory parameters in any patients.
Efficacy
A total of 269 lesions with an SOR in 177 patients were included for efficacy analysis, of which 92 lesions were malignant and 177 were benign. The primary malignancies consisted of 38 patients with hepatocellular carcinoma, 4 patients with cholangiocarcinomas, and 2 patients with focal lymphomas. Most liver metastases originated from colorectal, gastric, or pancreatic adenocarcinomas (44/48 patients).
The benign lesions consisted of 67 hemangiomas, 37 focal nodular hyperplasias, 54 simple cysts, 10 focal fat, 4 regenerative nodules, 2 adenomas, 1 abscess, and 1 bile duct adenoma, and one patient had only normal liver tissue and no lesion.
On-site Evaluation (Clinical Study)
Primary Evaluation
In 177 patients, the proportion of correctly characterized lesions was significantly higher using combined MRI (96%) compared with either unenhanced MRI (84%; P = 0.0002) or spiral CT (85%; P = 0.0008; Table 1).
TABLE 1. Clinical Evaluation: Proportion of Correctly Characterized Lesions.
| Correctly Characterized Lesions, n (%) | 95% Confidence Interval | P* | |
|---|---|---|---|
| Combined MRI† (n = 269 lesions) |
257 (96) | — | — |
| Unenhanced MRI (n = 269 lesions) |
227 (84) | 0.055–0.167 | 0.0002 |
| Spiral CT (n = 261 lesions) |
222 (85) | 0.047–0.167 | 0.0008 |
P value versus combined MRI.
Combination of unenhanced and enhanced MR sequences.
The number of patients evaluated for the primary end point was different to the number of patients evaluated for the comparison of MRI and spiral CT because in some patients, spiral CT was not performed or was not performed within 6 weeks of MRI.
Secondary Evaluation
Of the discordant lesions, 11.5% (31/269) were correctly characterized using combined MRI but incorrectly characterized using unenhanced MRI, whereas only 0.4% (1/269) were correctly characterized using unenhanced MRI alone. In comparison, 11.9% (31/261) of the lesions were correctly characterized by combined MRI but incorrectly characterized by spiral CT; a total of 1.1% (3/261) of the lesions were correctly characterized by spiral CT alone.
When assessing the confidence of lesion characterization, a greater proportion of lesions were assigned with high confidence (4 or 5) with combined MRI compared with that with spiral CT or unenhanced MRI (92% [236/269 lesions] versus 62% [140/269 lesions] or 79% [174/221 lesions], respectively; Table 2).
TABLE 2. Clinical Evaluation: Confidence of Lesion Characterization.
| Imagining Technique | Percentage of Lesions Assigned 4 or 5, n (%) |
|---|---|
| Combined MRI† (n = 269 lesions) | 236 (92) |
| Unenhanced MRI (n = 269 lesions) | 140 (62) |
| Spiral CT (n = 221 lesions) | 174 (79) |
Confidence of lesion characterization was defined using a 5-point scale: 1 indicates low or doubtful confidence, whereas 5 indicates high or complete/almost complete confidence. Combination of unenhanced and enhanced MR sequences.
The proportion of lesions with a correct classification (benign or malignant) was also highest for combined MRI (98% [264/269 lesions]), relative to unenhanced MRI (92% [247/269 lesions]) or spiral CT (88% [230/261 lesions]). The highest confidence of classification scores (4 or 5) were reported using combined MRI (94% [246/262]) compared with unenhanced MRI (66% [155/235]) and spiral CT (81% [185/227]). Sensitivity, specificity, and accuracy were all highest for combined MRI (Table 3).
TABLE 3. Clinical Evaluation: Test Parameters for Lesion Classification (Benign/Malignant) Comparing Combined MRI With Unenhanced MR and Spiral CT.
| Combined MRI (n = 269 Lesions) | Unenhanced MRI (n = 269 Lesions) | Spiral CT (n = 261 Lesions) | |
|---|---|---|---|
| TP, n (%) | 93 (35) | 85 (32) | 77 (30) |
| TN, n (%) | 171 (64) | 162 (60) | 153 (59) |
| FP, n (%) | 4 (1) | 13 (5) | 17 (7) |
| FN, n (%) | 1 (<0) | 9 (3) | 14 (5) |
| Sensitivity, % | 99.4 | 90 | 89.3 |
| Specificity, % | 96.0 | 91.8 | 88.9 |
| Accuracy, % | 97.5 | 90.9 | 89.1 |
Includes only lesions verified by SOR.
FN indicates false negatives (benign, no lesion, or not assessable in the imaging procedure but malignant in SOR); FP, false positives (malignant or not assessable in the imaging procedure but benign or no lesion in the SOR); TN, true negatives (benign or no lesion in the imaging procedure and in SOR); TP, true positives (malignant in the imaging procedure and in the SOR)
Off-site Blinded Evaluation
Primary Evaluation
All 3 blinded readers correctly characterized more lesions using combined MRI relative to unenhanced MRI. The proportion of correctly characterized lesions increased by 1%, 11%, and 19% for readers 1, 2, and 3, respectively, with significant improvement (P ≤ 0.0012) for 2 of 3 readers (Table 4; Figs. 1–3).
TABLE 4. Blinded Evaluation: Primary Analysis of the Proportion of Correctly Characterized Lesions Using Combined MR Sequences Versus Unenhanced Sequences.
| Reader | Combined MRI, (n = 269 Lesions), n (%) | Unenhanced MRI, (n = 269 Lesions), n (%) | P |
|---|---|---|---|
| 1 | 163 (61) | 161 (60) | 0.859 |
| 2 | 204 (76) | 174 (65) | 0.0012 |
| 3 | 180 (67) | 129 (48) | ≤0.0001 |
FIGURE 1.
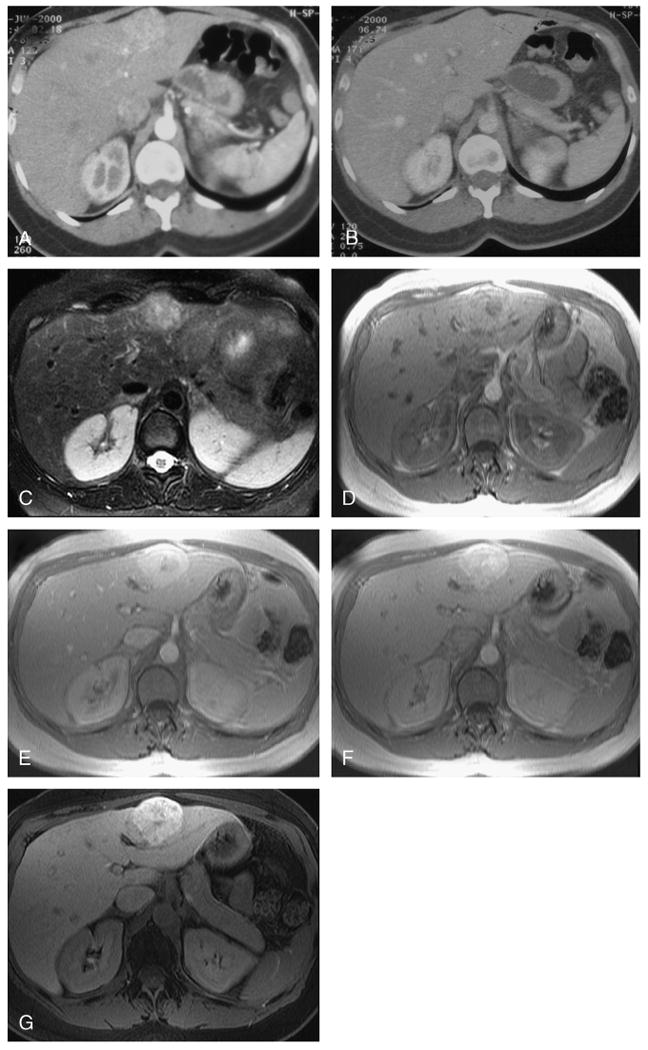
Focal nodular hyperplasia in a female patient aged 47 years. Using dual-phase helical CT, a segment 2 lesion enhances avidly in the arterial phase (A) and becomes isodense to the liver in the portal venous phase (B). No discrete scar was present on this or several other similar lesions (not shown), and the lesions were incorrectly interpreted as hypervascular metastases on blinded reading. Using unenhanced MRI, the lesion was of intermediate hyperintensity on the T2W images with hyperintense central scar (C) and mild hyperintensity on the T1W images (D). Using dynamic Gd-EOB-DTPA–enhanced sequences, the lesions also enhanced avidly in the late arterial phase (E) with enhancement of the central scar in the portal venous phases (F). At 20 minutes after injection, the hepatocellular lesion retains contrast (G). The other lesions also showed similar characteristics and were correctly interpreted as focal nodular hyperplasia on blinded reading of combined images.
FIGURE 3.

Hepatocellular carcinoma in a male patient aged 75 years with proven histopathology. Using dual-phase helical CT, a segment 7 mass markedly enhances compared with the liver (A) and then rapidly becomes isointense with capsular enhancement in the portal venous phase (B). The mass was interpreted as a hepatocellular carcinoma on blinded reading. On unenhanced MRI, the mass was of intermediate hyperintensity on the T2W images (C) and hypointense on the T1W images (D) and interpreted as a hemangioma. Using dynamic Gd-EOB-DTPA–enhanced sequences, the mass enhanced avidly relative to liver late arterial phase (E) and then unenhanced with delayed capsular enhancement in the late portal venous phase (F). At 20 minutes after injection, the lesion signal was hypointense in comparison to the background liver (G). Using combined images, the lesion was interpreted as a hepatocellular carcinoma. Overall confidence of characterization was stronger for combined images relative to the CT images alone.
Secondary Evaluation
All the readers correctly characterized a greater proportion of the lesions using enhanced MR sequences compared with unenhanced MR sequences (significant for 2 of the 3 readers; reader 1, P = 0.859; reader 2, P = 0.0001; reader 3, P = 0.0002; Table 5, enhanced sequences vs unenhanced sequences). Similarly, all the readers correctly characterized a greater proportion of the lesions using combined MR images compared with dual-phase spiral CT (not significantly different for any of the readers; Table 5, combined MRI vs spiral CT).
TABLE 5. Blinded Evaluation: Secondary Analysis of the Proportion of Correctly Characterized Lesions.
| Reader | Enhanced MRI (n = 269 Lesions), n (%) | Unenhanced MRI (n = 269 Lesions), n (%) | P |
|---|---|---|---|
| 1 | 168 (62) | 161 (60) | 0.859 |
| 2 | 210 (78) | 174 (65) | 0.0001 |
| 3 | 175 (66) | 129 (48) | 0.0002 |
| Combined MRI, n (%) | Spiral CT, n (%) | P | |
| 1 (n = 254 lesions) | 157 (62) | 146 (57) | 0.4361 |
| 2 (n = 250 lesions) | 193 (77) | 189 (76) | 0.6329 |
| 3 (n = 250 lesions) | 165 (66) | 161 (64) | 0.6342 |
Of the discordant lesions, all the readers correctly characterized more lesions using combined or enhanced MRI (Tables 6) relative to unenhanced MRI or spiral CT. Conversely, fewer lesions were correctly characterized using unenhanced MRI or spiral CT than on enhanced or combined MRI. Confidence of characterization was highest for all readers on combined MR sequences (Table 7).
TABLE 6. Blinded Evaluation: Proportion of the Discordant Lesions.
| Reader | Characterized Correctly Using Combined MRI but Incorrect Using Unenhanced MRI (n = 269 lesions), n (%) | Characterized Correctly Using Unenhanced MRI but Incorrect Using Combined MRI (n = 269 lesions), n (%) |
|---|---|---|
| 1 | 34 (12.6) | 32 (12.0) |
| 2 | 46 (17.1) | 16 (6.0) |
| 3 | 66 (24.5) | 15 (6.0) |
| Characterized Correctly Using Enhanced MRI but Incorrectly Using Unenhanced MRI (n = 269 lesions), n (%) | Characterized Correctly Using Unenhanced MRI but Incorrectly Using Enhanced MRI (n = 269 lesion), n (%) | |
| 1 | 37 (13.8) | 30 (11) |
| 2 | 46 (17.1) | 10 (4) |
| 3 | 61 (22.7) | 15 (6) |
| Characterized Correctly Using Combined MRI but Incorrectly Using Spiral CT, n (%) | Characterized Correctly Using Spiral CT but Incorrectly Using Combined MRI, n (%) | |
| 1 (n = 254 lesions) | 48 (18.9) | 37 (15) |
| 2 (n = 250 lesions) | 29 (11.6) | 25 (10) |
| 3 (n = 250 lesions) | 32 (12.8) | 28 (11) |
TABLE 7. Confidence of Characterization in the Blinded Evaluation: Proportion of Lesions Assigned a Score of 4 or 5.
| Reader | Combined MRI, n (%) | Unenhanced MRI, n (%) | Spiral CT, n (%) |
|---|---|---|---|
| 1 | 158/163 (97) | 118/160 (74) | 127/146 (87) |
| 2 | 159/204 (78) | 101/173 (59) | 119/188 (63) |
| 3 | 133/180 (74) | 92/129 (71) | 107/160 (67) |
Confidence of lesion characterization was defined using a 5-point scale: 1 indicates low or doubtful confidence, whereas 5 indicates high or complete/almost complete confidence.
In analysis of lesion classification as benign or malignant, most readers (2 of 3) correctly classified more lesions using combined MRI relative to unenhanced MRI (77% vs 78%, 89% vs 87%, and 85% vs 79% for readers 1, 2, and 3, respectively), and all the readers correctly classified more lesions using combined MRI relative to spiral CT (65%, 82%, and 77% for readers 1, 2, and 3, respectively; Table 8), with highest confidence using combined MRI (75%–98%, 69%–78%, and 64%–89% for combined MRI, unenhanced MRI, and spiral CT, respectively; Table 9).
TABLE 8. Blinded Evaluation: Proportion of Correctly Classified SOR-Verified Lesions.
| Reader | Enhanced MRI (n = 269), n (%) | Combined MRI (n = 269), n (%) | Unenhanced MRI (n = 269), n (%) | Spiral CT (n = 261), n (%) |
|---|---|---|---|---|
| 1 | 207 (77) | 208 (77) | 210 (78) | 175 (65) |
| 2 | 241 (90) | 239 (89) | 234 (87) | 221 (82) |
| 3 | 226 (84) | 228 (85) | 212 (79) | 206 (77) |
TABLE 9. Confidence of Classification in the Blinded Evaluation: Proportion of Lesions Assigned a Score of 4 or 5.
| Reader | Combined MRI n (%) | Unenhanced MRI n (%) | Spiral CT n (%) |
|---|---|---|---|
| 1 | 204/208 (98) | 158/208 (76) | 156/175 (89) |
| 2 | 184/239 (77) | 152/222 (69) | 140/219 (64) |
| 3 | 167/223 (75) | 156/200 (78) | 137/203 (68) |
Confidence of lesion characterization was defined using a 5-point scale: 1 indicates low or doubtful confidence, whereas 5 indicates high or complete/almost complete confidence.
For the blinded analysis, when comparing combined MRI with unenhanced MRI, sensitivity and accuracy for lesion classification increased slightly for 2 of 3 readers (sensitivity: 96% vs 93%, 97% vs 94%, and 80% vs 87%; accuracy: 79% vs 79%, 89% vs 88%, and 83% vs 80%, for readers 1, 2, and 3, respectively); specificity increased for 1 of the 3 readers and was unchanged for the 2 other readers (67% vs 67%, 83% vs 83%, and 83% vs 80% for readers 1, 2, and 3, respectively). The accuracy for lesion classification was highest in combined MRI compared with spiral CT for all readers (Table 10).
TABLE 10. Sensitivity, Specificity, and Accuracy for Lesion Classification.
| Enhanced MRI (n = 269), Reader 1/2/3, % | Combined MRI (n = 269), Reader 1/2/3, % | Unenhanced MRI (n = 269), Reader 1/2/3, % | Spiral CT (n = 250), Reader 1/2/3, % | ||||||
|---|---|---|---|---|---|---|---|---|---|
| Blinded evaluation: raw data for calculating test parameters* | |||||||||
| TP | 34/34/32 | 33/33/29 | 33/33/30 | 33/29/29 | |||||
| TN | 43/56/52 | 44/55/56 | 45/54/49 | 36/60/54 | |||||
| FP | 22/9/13 | 21/10/9 | 20/11/16 | 29/6/11 | |||||
| FN | 1/1/3 | 1/1/6 | 2/2/4 | 2/6/7 | |||||
| Test parameter percentages for lesion classification (benign/malignant) comparing unenhanced MRI with combined MRI, enhanced MRI, or spiral CT in the blinded evaluation | |||||||||
| Blinded study | |||||||||
| Sensitivity | 97/98/90 | 96/97/80 | 93/94/87 | 94/83/82 | |||||
| Specificity | 62/85/76 | 67/83/84 | 67/83/74 | 55/88/80 | |||||
| Accuracy | 78/91/82 | 79/89/83 | 79/88/80 | 72/86/81 | |||||
Includes only lesions verified by SOR.
Discussion
Most of the previously published studies that have determined the accuracy of MRI have focused on lesion detection as a primary end point with variable rigorousness of lesion verification.22–24 However, for maximal clinical utility, improved detection, classification, and characterization of lesions are necessary for widespread use of any liver agent because clinical therapy decisions rely on the knowledge of malignancy and the diagnosis of a specific lesion type. Our study was specifically designed to assess the diagnostic performance for the classification and characterization of focal liver lesions using combined MRI using the liver-specific contrast agent, Gd-EOB-DTPA.
With Gd-EOB-DTPA–enhanced MRI, both dynamic enhancement information (such as conventional Gd-DTPA–enhanced MRI)25 and delayed (20 minutes) T1 hepatocyte-specific enhancement (such as manganese dipyridoxal diphosphate)7 are obtained. Superior lesion detection was shown in recent multi-center trials using Gd-EOB-DTPA–enhanced MRI when compared with unenhanced MRI.19,20 Sensitivity was higher, and fewer false-positive lesions resulted with Gd-EOB-DTPA–enhanced MRI compared with spiral CT, especially when lesions less than 1 cm were considered.18 However, large multicenter studies are needed to evaluate the value of Gd-EOB-DTPA–enhanced MRI for characterization of focal liver lesions.
Here, we report a phase 3, multicenter trial conducted in the United States, where a 1.5-T MRI was used to determine whether Gd-EOB-DTPA–enhanced MRI improved hepatic lesion characterization and classification both clinically and in independent, blinded reader evaluation relative to unenhanced scans and, secondarily, to standard dual-phase spiral CT. A wide variety of rigorously proven benign and malignant lesions were imaged.
In both the clinical and blinded evaluations, in comparison with unenhanced MR images, combined unenhanced and Gd-EOB-DTPA–enhanced MRI significantly improved focal hepatic lesion characterization. In the blinded reading, a secondary comparison of enhanced and unenhanced sequences showed that all the 3 readers improved lesion characterization performance when enhanced sequences were used. Furthermore, in both the clinical and blinded evaluations, the combined MRI enabled the best lesion classification (benign or malignant) and improved confidence of classification compared with the unenhanced MRI and the spiral CT in both evaluations.
In these analyses, the combined MR sequences allowed improved characterization compared with the spiral CT, as shown by the primary evaluation and the discordant lesion evaluation. The difference was larger in the clinical study because of its unblinded nature, which either reflects true clinical practice or may indicate bias where additional information often influences radiological interpretations.26–28
In addition to the objective parameters, which included the proportion of correctly characterized lesions or any sensitivity and specificity calculation, the evaluation of the confidence in characterization is an important supportive parameter for the performance of an imaging method because triage to further radiological investigations, biopsy, or therapy is influenced by the degree of radiological confidence. In both evaluations, combined MRI had the highest confidence scores with respect to lesion characterization, which is clinically important because the radiologist's confidence impacts further patient management.
Limitations regarding the study design have been considered. Not all benign lesions (15.6% [31/199]) had histological proof as SOR because biopsies of benign liver lesions, such as hemangiomas or focal nodular hyperplasia, were not the standard of care and therefore not ethically justifiable. In addition, we did not subanalyze the utility of each individual enhancement phase and thus did not address the relative value of the dynamic and hepatocyte-specific phases.
In summary, Gd-EOB-DTPA–enhanced MRI is safe and significantly improves the ability to characterize and classify a variety of focal hepatic lesions relative to unenhanced MRI and dual-phase spiral CT.
FIGURE 2.

Hemangiomas in a female patient aged 30 years. Using dual-phase helical CT, nodular peripheral enhancement is present in a segment 4 lesion in the arterial phase (A) with progressive enhancement in the portal venous phase (B). Other similar lesions (not shown) were present with similar features, and the lesions were interpreted as hemangiomas on blinded reading. Using unenhanced MRI, the lesion was uniformly and markedly hyperintense on T2W images (C) and hypointense on T1W images (D) and interpreted as a simple cyst. Using dynamic Gd-EOB-DTPA–enhanced sequences, the lesions also showed characteristic progressive nodular peripheral enhancement in the late arterial (E) and portal venous phases (F). At 20 minutes after injection, the lesion signal has decreased in comparison with the background liver (G). Based on combined images, the lesions were interpreted as hemangiomas.
Acknowledgments
The authors thank Celia J. Parkyn, PhD, Medicus International, for her editorial assistance. The blinded readings were performed by P. Bret, Department of Medical Imaging, Toronto, Canada; King C. Li, Diagnostic Radiology, Warren Grant Magnuson Clinical Center, Bethesda, Md; and J. Heiken, Department of Radiology, Mallinckrodt Institute of Radiology, St Louis, Mo.
Funding of this study and its editorial support were received from and sponsored by Bayer Schering Pharma AG, Berlin, Germany.
References
- 1.Hamm B, Thoeni RF, Gould RG, et al. Focal liver lesions: characterization with nonenhanced and dynamic contrast material-enhanced MR imaging. Radiology. 1994;190:417–423. doi: 10.1148/radiology.190.2.8284392. [DOI] [PubMed] [Google Scholar]
- 2.Mitchell DG, Saini S, Weinreb J, et al. Hepatic metastases and cavernous hemangiomas: distinction with standard- and triple-dose gadoteridol-enhanced MR imaging. Radiology. 1994;193:49–57. doi: 10.1148/radiology.193.1.8090921. [DOI] [PubMed] [Google Scholar]
- 3.Petersein J, Spinazzi A, Giovagnoni A, et al. Focal liver lesions: evaluation of the efficacy of gadobenate dimeglumine in MR imaging—a multicenter phase III clinical study. Radiology. 2000;215:727–736. doi: 10.1148/radiology.215.3.r00jn14727. [DOI] [PubMed] [Google Scholar]
- 4.Whitney WS, Herfkens RJ, Jeffrey RB, et al. Dynamic breath-hold multiplanar spoiled gradient-recalled MR imaging with gadolinium enhancement for differentiating hepatic hemangiomas from malignancies at 1.5 T. Radiology. 1993;189:863–870. doi: 10.1148/radiology.189.3.8234717. [DOI] [PubMed] [Google Scholar]
- 5.Federle M, Chezmar J, Rubin DL, et al. Efficacy and safety of mangafodipir trisodium (MnDPDP) injection for hepatic MRI in adults: results of the U.S. Multicenter phase III clinical trials. Efficacy of early imaging. J Magn Reson Imaging. 2000;12:689–701. doi: 10.1002/1522-2586(200011)12:5<689::aid-jmri5>3.0.co;2-z. [DOI] [PubMed] [Google Scholar]
- 6.Ros PR, Freeny PC, Harms SE, et al. Hepatic MR imaging with ferumoxides: a multicenter clinical trial of the safety and efficacy in the detection of focal hepatic lesions. Radiology. 1995;196:481–488. doi: 10.1148/radiology.196.2.7617864. [DOI] [PubMed] [Google Scholar]
- 7.Torres CG, Lundby B, Sterud AT, et al. MnDPDP for MR imaging of the liver. Results from the European phase III studies. Acta Radiol. 1997;38:631–637. doi: 10.1080/02841859709172393. [DOI] [PubMed] [Google Scholar]
- 8.Paley MR, Mergo PJ, Torres GM, et al. Characterization of focal hepatic lesions with ferumoxides-enhanced T2-weighted MR imaging. AJR Am J Roentgenol. 2000;175:159–163. doi: 10.2214/ajr.175.1.1750159. [DOI] [PubMed] [Google Scholar]
- 9.Semelka RC, Helmberger TK. Contrast agents for MR imaging of the liver. Radiology. 2001;218:27–38. doi: 10.1148/radiology.218.1.r01ja2427. [DOI] [PubMed] [Google Scholar]
- 10.Ward J, Guthrie JA, Scott DJ, et al. Hepatocellular carcinoma in the cirrhotic liver: double-contrast MR imaging for diagnosis. Radiology. 2000;216:154–162. doi: 10.1148/radiology.216.1.r00jl24154. [DOI] [PubMed] [Google Scholar]
- 11.Clement O, Muhler A, Vexler V, et al. Gadolinium-ethoxybenzyl-DTPA, a new liver-specific magnetic resonance contrast agent. Kinetic and enhancement patterns in normal and cholestatic rats. Invest Radiol. 1992;27:612–619. [PubMed] [Google Scholar]
- 12.Schuhmann-Giampieri G, Schmitt-Willich H, Press WR, et al. Preclinical evaluation of Gd-EOB-DTPA as a contrast agent in MR imaging of the hepatobiliary system. Radiology. 1992;183:59–64. doi: 10.1148/radiology.183.1.1549695. [DOI] [PubMed] [Google Scholar]
- 13.Weinmann HJ, Schuhmann-Giampieri G, Schmitt-Willich H, et al. A new lipophilic gadolinium chelate as a tissue-specific contrast medium for MRI. Magn Reson Med. 1991;22:233–237. doi: 10.1002/mrm.1910220214. Discussion 242. [DOI] [PubMed] [Google Scholar]
- 14.Rohrer M, Bauer H, Mintorovitch J, et al. Comparison of magnetic properties of MRI contrast media solutions at different magnetic field strengths. Invest Radiol. 2005;40:715–724. doi: 10.1097/01.rli.0000184756.66360.d3. [DOI] [PubMed] [Google Scholar]
- 15.Hamm B, Staks T, Muhler A, et al. Phase I clinical evaluation of Gd-EOB-DTPA as a hepatobiliary MR contrast agent: safety, pharmacokinetics, and MR imaging. Radiology. 1995;195:785–792. doi: 10.1148/radiology.195.3.7754011. [DOI] [PubMed] [Google Scholar]
- 16.Halavaara J, Breuer J, Ayuso C, et al. Liver tumor characterization: comparison between liver-specific gadoxetic acid disodium-enhanced MRI and biphasic CT—a multicenter trial. J Comput Assist Tomogr. 2006;30:345–354. doi: 10.1097/00004728-200605000-00001. [DOI] [PubMed] [Google Scholar]
- 17.Reimer P, Rummeny EJ, Shamsi K, et al. Phase II clinical evaluation of Gd-EOB-DTPA: dose, safety aspects, and pulse sequence. Radiology. 1996;199:177–183. doi: 10.1148/radiology.199.1.8633143. [DOI] [PubMed] [Google Scholar]
- 18.Hammerstingl R, Huppertz A, Breuer J, et al. Diagnostic efficacy of gadoxetic acid (Primovist)–enhanced MRI and spiral CT for a therapeutic strategy: comparison with intraoperative and histopathologic findings in focal liver lesions. Eur Radiol. 2008;18:457–467. doi: 10.1007/s00330-007-0716-9. [DOI] [PubMed] [Google Scholar]
- 19.Bluemke DA, Sahani D, Amendola M, et al. Efficacy and safety of MR imaging with liver-specific contrast agent: U.S. multicenter phase III study. Radiology. 2005;237:89–98. doi: 10.1148/radiol.2371031842. [DOI] [PubMed] [Google Scholar]
- 20.Huppertz A, Balzer T, Blakeborough A, et al. Improved detection of focal liver lesions at MR imaging: multicenter comparison of gadoxetic acid-enhanced MR images with intraoperative findings. Radiology. 2004;230:266–275. doi: 10.1148/radiol.2301020269. [DOI] [PubMed] [Google Scholar]
- 21.Eliasziw M, Donner A. Application of the McNemar test to non-independent matched pair data. Stat Med. 1991;10:1981–1991. doi: 10.1002/sim.4780101211. [DOI] [PubMed] [Google Scholar]
- 22.Heiken JP, Weyman PJ, Lee JK, et al. Detection of focal hepatic masses: prospective evaluation with CT, delayed CT, CT during arterial portography, and MR imaging. Radiology. 1989;171:47–51. doi: 10.1148/radiology.171.1.2538862. [DOI] [PubMed] [Google Scholar]
- 23.Kondo S, Katoh H, Shimizu T, et al. Preoperative embolization of the common hepatic artery in preparation for radical pancreatectomy for pancreas body cancer. Hepatogastroenterology. 2000;47:1447–1449. [PubMed] [Google Scholar]
- 24.Wernecke K, Rummeny E, Bongartz G, et al. Detection of hepatic masses in patients with carcinoma: comparative sensitivities of sonography, CT, and MR imaging. AJR Am J Roentgenol. 1991;157:731–739. doi: 10.2214/ajr.157.4.1892027. [DOI] [PubMed] [Google Scholar]
- 25.Vogl TJ, Kummel S, Hammerstingl R, et al. Liver tumors: comparison of MR imaging with Gd-EOB-DTPA and Gd-DTPA. Radiology. 1996;200:59–67. doi: 10.1148/radiology.200.1.8657946. [DOI] [PubMed] [Google Scholar]
- 26.Baker ME, Pelley R. Hepatic metastases: basic principles and implications for radiologists. Radiology. 1995;197:329–337. doi: 10.1148/radiology.197.2.7480672. [DOI] [PubMed] [Google Scholar]
- 27.Nagao T, Inoue S, Goto S, et al. Hepatic resection for hepatocellular carcinoma. Clinical features and long-term prognosis. Ann Surg. 1987;205:33–40. doi: 10.1097/00000658-198701000-00006. [DOI] [PMC free article] [PubMed] [Google Scholar]
- 28.Sugarbaker PH. Surgical decision making for large bowel cancer metastatic to the liver. Radiology. 1990;174:621–626. doi: 10.1148/radiology.174.3.2406776. [DOI] [PubMed] [Google Scholar]