

With the widespread use of higher-field-strength MR imaging, injuries of the deltoid ligament of the ankle can be better characterized with respect to specific components and understood in the context of associated impingement syndromes.
Abstract
Injuries of the deltoid ligament of the ankle are increasingly recognized with the widespread use of magnetic resonance (MR) imaging. The use of higher magnetic field strengths requires familiarity with the anatomic substructure of the deltoid ligament to better localize and characterize pathologic findings. Specifically, improved image resolution allows components of the superficial (tibiocalcaneal, tibionavicular, posterior superficial tibiotalar, and tibiospring ligaments) and deep (anterior tibiotalar and posterior deep tibiotalar ligaments) portions of the ligament to be evaluated separately. Awareness of the deltoid ligament substructure and associated injury patterns can guide the radiologist in defining underlying mechanical derangement, such as that seen in various impingement disorders. In this review article, the MR imaging technique for the deltoid ligament is summarized, and the normal and abnormal MR imaging appearances of various components of the deltoid ligament and associated impingement syndromes are presented.
LEARNING OBJECTIVES
After reading this article and taking the test, the reader will be able to:
List components of the superficial and deep portions of the deltoid ligament of the ankle.
Describe the MR imaging appearances and grading of deltoid ligament injuries.
Discuss associated spring ligament pathologic findings and impingement syndromes.
Introduction
The deltoid ligament, also known as the medial collateral ligament of the ankle, attaches the medial malleolus to multiple tarsal bones. Unlike the superficial layer of this ligament, the deep layer is intraarticular and is covered by synovium. The superficial components include the tibiocalcaneal ligament, tibionavicular ligament, posterior superficial tibiotalar ligament, and tibiospring ligament; the deep layer components include the anterior tibiotalar ligament (ATTL) and the posterior deep tibiotalar ligament (PDTL) (Figs 1, 2). These components are variably present, according to various investigators (1–4). Anatomically, in general, the superficial components arise from the anterior colliculus of the medial malleolus, and the deep components arise from the intercollicular groove (malleolar groove) and the posterior colliculus of the medial malleolus (3). These ligaments are conveniently named according to their respective distal attachments to the various tarsal bones. The tibiospring portion is the only component without a distal bone attachment because it joins the superomedial oblique band of the spring ligament proper, also known as the plantar calcaneonavicular ligament (2,5). The superomedial oblique band is separated from the overlying tibialis posterior tendon by a gliding zone, composed of fibrocartilaginous tissue with a layer of synovial cells. The gliding zone typically measures 1–3 mm (Fig 2c). The superomedial oblique band typically measures 2–5 mm in thickness.
Figure 1a.

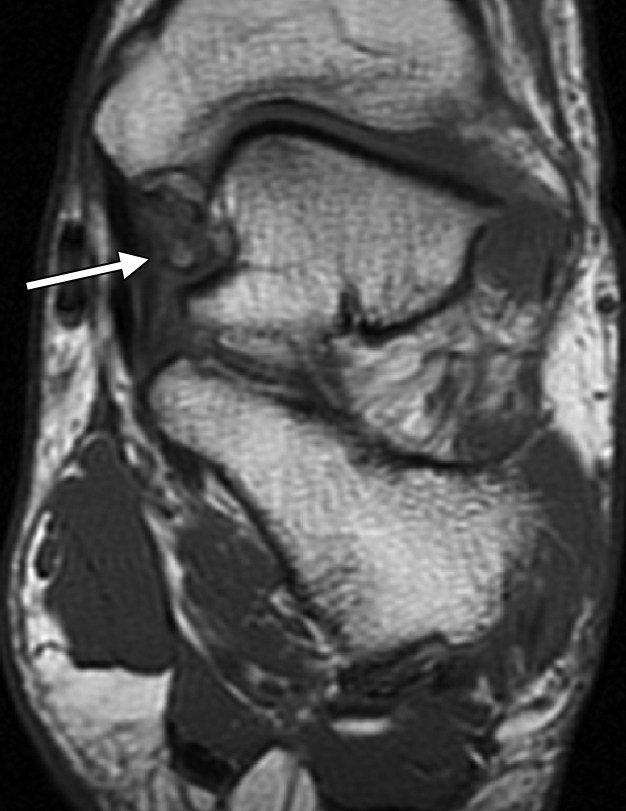
Normal deltoid ligament. (a) Coronal T1-weighted MR image shows a normal PDTL (arrow) with a striated appearance. (b) Coronal T1-weighted MR image shows a normal ATTL (thin arrow), tibiospring ligament (*), flexor retinaculum (curved arrow), tibialis posterior tendon (thick arrow), and superomedial oblique band (arrowhead). (c) Axial T1-weighted MR image shows the normal ATTL (arrow) and PDTL (arrowhead).
Figure 1b.
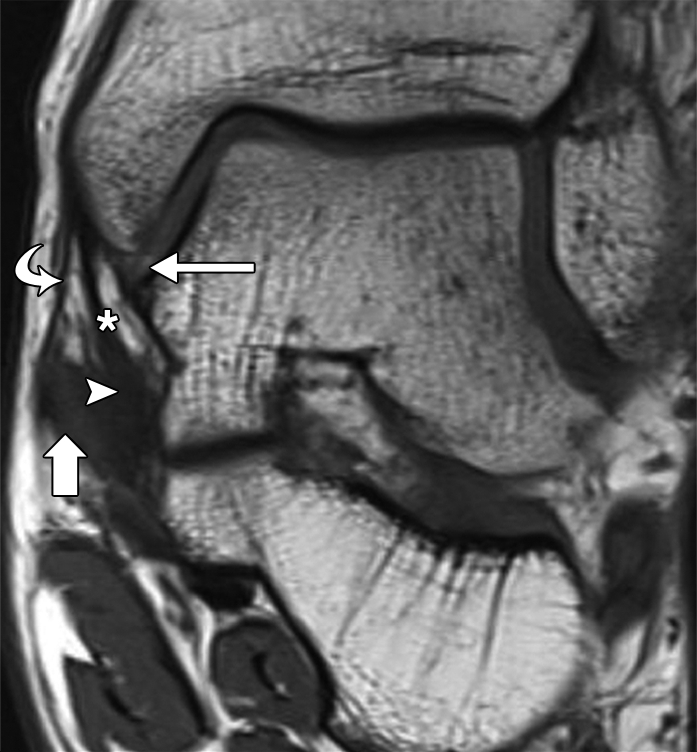
Normal deltoid ligament. (a) Coronal T1-weighted MR image shows a normal PDTL (arrow) with a striated appearance. (b) Coronal T1-weighted MR image shows a normal ATTL (thin arrow), tibiospring ligament (*), flexor retinaculum (curved arrow), tibialis posterior tendon (thick arrow), and superomedial oblique band (arrowhead). (c) Axial T1-weighted MR image shows the normal ATTL (arrow) and PDTL (arrowhead).
Figure 1c.

Normal deltoid ligament. (a) Coronal T1-weighted MR image shows a normal PDTL (arrow) with a striated appearance. (b) Coronal T1-weighted MR image shows a normal ATTL (thin arrow), tibiospring ligament (*), flexor retinaculum (curved arrow), tibialis posterior tendon (thick arrow), and superomedial oblique band (arrowhead). (c) Axial T1-weighted MR image shows the normal ATTL (arrow) and PDTL (arrowhead).
Figure 2a.

Normal deltoid ligament. (a) Coronal intermediate-weighted fat-saturated MR image shows a normal ATTL with a minimal striated appearance caused by fat suppression (straight arrow), tibiocalcaneal ligament (curved arrow), and flexor retinaculum (arrowhead). (b) Coronal intermediate-weighted fat-saturated MR image shows a normal PDTL (arrow) with a striated appearance and the flexor retinaculum (arrowhead). (c) Coronal intermediate-weighted fat-saturated MR image shows the tibiospring ligament (*), flexor retinaculum (curved arrow), tibialis posterior tendon (thick arrow), superomedial oblique band (arrowhead), and fibrocartilaginous gliding zone (thin arrow).
Figure 2b.

Normal deltoid ligament. (a) Coronal intermediate-weighted fat-saturated MR image shows a normal ATTL with a minimal striated appearance caused by fat suppression (straight arrow), tibiocalcaneal ligament (curved arrow), and flexor retinaculum (arrowhead). (b) Coronal intermediate-weighted fat-saturated MR image shows a normal PDTL (arrow) with a striated appearance and the flexor retinaculum (arrowhead). (c) Coronal intermediate-weighted fat-saturated MR image shows the tibiospring ligament (*), flexor retinaculum (curved arrow), tibialis posterior tendon (thick arrow), superomedial oblique band (arrowhead), and fibrocartilaginous gliding zone (thin arrow).
Figure 2c.

Normal deltoid ligament. (a) Coronal intermediate-weighted fat-saturated MR image shows a normal ATTL with a minimal striated appearance caused by fat suppression (straight arrow), tibiocalcaneal ligament (curved arrow), and flexor retinaculum (arrowhead). (b) Coronal intermediate-weighted fat-saturated MR image shows a normal PDTL (arrow) with a striated appearance and the flexor retinaculum (arrowhead). (c) Coronal intermediate-weighted fat-saturated MR image shows the tibiospring ligament (*), flexor retinaculum (curved arrow), tibialis posterior tendon (thick arrow), superomedial oblique band (arrowhead), and fibrocartilaginous gliding zone (thin arrow).
Superficial and deep deltoid components, functioning almost synergistically, are the main stabilizers against valgus and pronation force, as well as rotational forces on the talus (6). The tibiospring ligament and the spring ligament proper stabilize the talocalcaneonavicular joint and serve as a secondary stabilizer of the medial plantar arch. The posterior tibialis tendon serves as the primary dynamic stabilizer of the medial plantar arch. Thus, it is understandable that posterior tibialis tendon dysfunction is frequently associated with spring and tibiospring ligament pathologic findings in contributing to medial ankle instability (5–9).
The purpose of this article is to raise awareness of the deltoid ligament substructure and associated injury patterns. We review the MR imaging technique for the deltoid ligament and describe the normal and abnormal MR imaging appearances of various components of the deltoid ligament and associated impingement syndromes.
MR Imaging Technique
For imaging on a 1.5-T imager, previous protocols included 3–4-mm-thick three-plane T1-weighted and fat-saturated T2-weighted MR images for the comprehensive evaluation of ankle pathologic conditions. Recently, the trend is to replace T1-weighted with intermediate-weighted imaging sequences (echo time [TE], ∼35–45 msec) because of the inherently higher signal-to-noise ratio available on these images (Table). A short inversion time inversion-recovery (STIR) imaging sequence replaces the frequency-selective fat-saturated T2-weighted or intermediate-weighted sequence if the fat suppression fails. Because thinner sections with higher signal-to-noise ratio and contrast-to-noise ratio are obtained without time penalty on the high-field-strength 3-T imagers, a similar protocol is used for a 3-T imager, with section thickness reduced to 2–3 mm.
Ankle MR Imaging Protocols at 1.5 and 3 T

Note.—Protocols are for 1.5- and 3-T MR imagers (Avanto and Verio systems; Siemens, Erlangen, Germany). Pulse sequences are repetition time (msec)/echo time (msec). FOV = field of view, FS = fat saturation, GRE = gradient-recalled echo, NSA = number of sig-nals acquired, PDW = proton density–weighted (intermediate-weighted), TE = echo time, TF = turbo factor (echo train length), TR = repetition time, TSE = turbo spin-echo.
Normal Imaging Findings
At MR imaging, axial and coronal images are most valuable in differentiating various components of the deltoid ligament (1,10). With the high-resolution imaging made possible with 1.5-T and 3-T MR imagers, it is easy to demonstrate the superficial and deep parts of the deltoid ligament. In a recent study by Mengiardi et al (10), the ATTL and tibionavicular ligament were identified in approximately 55% of asymptomatic subjects. The remaining deltoid ligament components, including the tibiospring ligament, were consistently identified in most cases. While taking into account that their study was performed on a 1.5-T imager, we are able to consistently identify all of the components of the deltoid ligament on sequential coronal and axial images at 3-T imaging except the tibionavicular and posterior superficial tibiotalar, which are less frequently well demonstrated. The width of these components varies from the thickest portion, the PDTL (6–11 mm), to the thinnest one, the tibiocalcaneal ligament (1–3 mm) (10). The deep portion of the deltoid ligament (consisting of the anterior and posterior tibiotalar ligaments) demonstrates a striated appearance on T1-weighted and intermediate-weighted images that is caused by interspersed fatty tissue (1,10). This appearance is less well seen on T2-weighted images, especially because of the widespread use of fat-saturated sequences (Figs 1 , 2 ). Also, the striated appearance is less apparent in older subjects, which may be partly attributable to previous subclinical injuries (10). The normal appearance for the remaining components is uniformly low signal intensity on T1-, intermediate-, and T2-weighted MR images.
Deltoid Ligament Abnormalities
Clinical Manifestations
Deltoid ligament injuries are more frequent than previously thought, especially in Weber type B fractures (11–13). These injuries are often associated with lateral ligamentous injuries. Although pronation-eversion and extreme rotational injuries are known to lead to deltoid ligament injuries, most patients report multiple ankle sprains and are unable to qualify a single mechanism of injury. Chronic deltoid ligament insufficiency can be seen in several conditions, including posterior tibial tendon dysfunction and sports-related injuries, and in patients with a history of triple arthrodesis or ankle arthroplasty.
In acute injuries, patients can present with medial ankle hematoma and tenderness along the deltoid ligament. In chronic deltoid insufficiency, pain and tenderness in the medial gutter, as well as hindfoot valgus and pronation at weight bearing, are clinically evident (11,12). Typically, activation of the posterior tibialis tendon by asking the patient to stand on tiptoe is able to correct the hindfoot valgus and pronation. If that is not the case, suspicion is also raised for posterior tibialis tendon dysfunction, which may be associated with ligamentous injuries as described in the preceding paragraph.
Pathologic Imaging Findings
Because the deltoid ligament acts as the primary stabilizer of the axially loaded ankle, evaluating the integrity of the ligament is critical in determining the role for surgical treatment of ankle fractures (14). Ankle radiographs can demonstrate avulsive injuries; however, widening of the medial tibiotalar clear space on the mortise view has been shown to be unreliable in the diagnosis of deep deltoid ligament injuries (14). Schuberth et al (14) concluded that fractures traditionally considered stable with the Lauge-Hansen classification system may in fact be associated with radiographically occult deep deltoid injury. Also, in a recent study, DeAngelis et al (15) found no significant association between the presence of medial tenderness and deep deltoid ligament incompetence in supination–external rotation injuries. These findings stress the need for MR imaging to allow appropriate and early diagnosis, as well as prevention of chronic medial instability, osteoarthritis, and medial ankle impingement syndromes.
At MR imaging, injuries to the superficial and deep portions of the deltoid ligament should be categorized separately. The injuries have also been classified clinically, depending on the craniocaudal extent of involvement of the deltoid ligament, as type I (proximal), type II (intermediate), or type III (distal) injuries of the ligament (12). Type I injuries are most frequent (71%), and type II are the least common (10%), with type III accounting for the rest (19%). Similar to injuries of other ligaments, deltoid ligament injuries are generically classified as grade I sprain (stretching/periligamentous edema), grade II sprain (partial tear), or grade III sprain (complete disruption). Grade I sprain is evident on T1- and intermediate-weighted images as loss of the striated appearance of the deep portion of the deltoid ligament (ATTL and PDTL), with consequent amorphous signal intensity.This abnormal signal intensity is related to hemorrhage and hyperplastic synovial reaction, with hemosiderin deposition in acute injuries and fibrosis/scarring in chronic injuries (Fig 3 ). In higher-grade injuries, abnormal hyperintensity is seen on fat-saturated long-TE MR images as fluid-filled gaps in or complete discontinuity of the ligament (2,4) (Figs 4 –7 ). In our experience, deep deltoid ligament injuries are more frequent than injuries of other components of the ligament. Secondary signs of a widened medial clear space (more than 3–4 mm) and lateral talar shift should also be sought, despite the lack of sensitivity of these signs at radiography (14) (Fig 8 ). With respect to the tibiospring ligament and the superomedial band of the spring ligament, degenerative thickening is more common than frank tears (Figs 6 , 9 ). Coronal and axial MR images nicely depict associated medial malleolar fractures, distal avulsion fractures, osteochondral injuries of the talus, lateral ligament and syndesmosis injuries, and spring ligament and tibialis posterior abnormalities (Fig 9 ).
Figure 3a.

Acute left ankle injury and medial pain in a 45-year-old man. (a) Coronal intermediate-weighted MR image shows loss of fatty striations of the PDTL (arrow), consistent with a grade I sprain injury. (b) Coronal intermediate-weighted fat-saturated MR image shows a medial malleolar contusion and minimal hyperintensity of the PDTL (arrow). Note the grade I/II sprained tibiocalcaneal ligament (arrowhead). (c) Axial intermediate-weighted MR image shows amorphous signal intensity of both the ATTL (arrowhead) and the PDTL (arrow), in keeping with a grade I sprain.
Figure 3b.

Acute left ankle injury and medial pain in a 45-year-old man. (a) Coronal intermediate-weighted MR image shows loss of fatty striations of the PDTL (arrow), consistent with a grade I sprain injury. (b) Coronal intermediate-weighted fat-saturated MR image shows a medial malleolar contusion and minimal hyperintensity of the PDTL (arrow). Note the grade I/II sprained tibiocalcaneal ligament (arrowhead). (c) Axial intermediate-weighted MR image shows amorphous signal intensity of both the ATTL (arrowhead) and the PDTL (arrow), in keeping with a grade I sprain.
Figure 3c.

Acute left ankle injury and medial pain in a 45-year-old man. (a) Coronal intermediate-weighted MR image shows loss of fatty striations of the PDTL (arrow), consistent with a grade I sprain injury. (b) Coronal intermediate-weighted fat-saturated MR image shows a medial malleolar contusion and minimal hyperintensity of the PDTL (arrow). Note the grade I/II sprained tibiocalcaneal ligament (arrowhead). (c) Axial intermediate-weighted MR image shows amorphous signal intensity of both the ATTL (arrowhead) and the PDTL (arrow), in keeping with a grade I sprain.
Figure 4a.

Images of a 55-year-old woman with a history of subacute ankle injury. (a) Coronal T2-weighted fat-saturated MR image shows a small osteochondral lesion of the lateral talar dome (arrow) and a grade I/II sprain of the PDTL (arrowhead). (b) Sagittal T2-weighted fat-saturated MR image shows abnormal high signal intensity in the PDTL (arrow).
Figure 4b.

Images of a 55-year-old woman with a history of subacute ankle injury. (a) Coronal T2-weighted fat-saturated MR image shows a small osteochondral lesion of the lateral talar dome (arrow) and a grade I/II sprain of the PDTL (arrowhead). (b) Sagittal T2-weighted fat-saturated MR image shows abnormal high signal intensity in the PDTL (arrow).
Figure 7a.

Acute left ankle injury with grade II deltoid ligament sprain. (a) Coronal T1-weighted MR image shows loss of normal striations in the deep deltoid ligament (arrow). (b) Coronal T2-weighted fat-saturated MR image helps confirm a grade II tear of the ATTL (short thin arrow), calcaneofibular ligament tear (thick straight arrow), anterior talofibular ligament tear (arrowhead), medial malleolar contusion (long thin arrow), and talar contusion (curved arrow). (c) Axial T1-weighted MR image shows thickening and loss of striations of the deep deltoid ligament (arrow). (d) Axial T2-weighted fat-saturated MR image shows a grade II deep deltoid ligament tear (arrow) and anterior talofibular ligament tear (arrowhead).
Figure 7b.

Acute left ankle injury with grade II deltoid ligament sprain. (a) Coronal T1-weighted MR image shows loss of normal striations in the deep deltoid ligament (arrow). (b) Coronal T2-weighted fat-saturated MR image helps confirm a grade II tear of the ATTL (short thin arrow), calcaneofibular ligament tear (thick straight arrow), anterior talofibular ligament tear (arrowhead), medial malleolar contusion (long thin arrow), and talar contusion (curved arrow). (c) Axial T1-weighted MR image shows thickening and loss of striations of the deep deltoid ligament (arrow). (d) Axial T2-weighted fat-saturated MR image shows a grade II deep deltoid ligament tear (arrow) and anterior talofibular ligament tear (arrowhead).
Figure 7c.

Acute left ankle injury with grade II deltoid ligament sprain. (a) Coronal T1-weighted MR image shows loss of normal striations in the deep deltoid ligament (arrow). (b) Coronal T2-weighted fat-saturated MR image helps confirm a grade II tear of the ATTL (short thin arrow), calcaneofibular ligament tear (thick straight arrow), anterior talofibular ligament tear (arrowhead), medial malleolar contusion (long thin arrow), and talar contusion (curved arrow). (c) Axial T1-weighted MR image shows thickening and loss of striations of the deep deltoid ligament (arrow). (d) Axial T2-weighted fat-saturated MR image shows a grade II deep deltoid ligament tear (arrow) and anterior talofibular ligament tear (arrowhead).
Figure 7d.

Acute left ankle injury with grade II deltoid ligament sprain. (a) Coronal T1-weighted MR image shows loss of normal striations in the deep deltoid ligament (arrow). (b) Coronal T2-weighted fat-saturated MR image helps confirm a grade II tear of the ATTL (short thin arrow), calcaneofibular ligament tear (thick straight arrow), anterior talofibular ligament tear (arrowhead), medial malleolar contusion (long thin arrow), and talar contusion (curved arrow). (c) Axial T1-weighted MR image shows thickening and loss of striations of the deep deltoid ligament (arrow). (d) Axial T2-weighted fat-saturated MR image shows a grade II deep deltoid ligament tear (arrow) and anterior talofibular ligament tear (arrowhead).
Figure 8a.

Images of a 55-year-old man with chronic ankle pain. (a) Coronal intermediate-weighted MR image shows posterolateral talar subluxation and tilt, with tibiotalar spurs in the medial clear space (arrow). (b) Coronal intermediate-weighted fat-saturated MR image shows tibiotalar osteoarthritis with subchondral edema (circled area). Also note amorphous signal intensity of the ATTL (arrowhead). (c) Coronal intermediate-weighted fat-saturated MR image obtained posterior to b shows thickened and remodeled tibiocalcaneal ligament (arrow) related to the chronic/old injury.
Figure 8b.

Images of a 55-year-old man with chronic ankle pain. (a) Coronal intermediate-weighted MR image shows posterolateral talar subluxation and tilt, with tibiotalar spurs in the medial clear space (arrow). (b) Coronal intermediate-weighted fat-saturated MR image shows tibiotalar osteoarthritis with subchondral edema (circled area). Also note amorphous signal intensity of the ATTL (arrowhead). (c) Coronal intermediate-weighted fat-saturated MR image obtained posterior to b shows thickened and remodeled tibiocalcaneal ligament (arrow) related to the chronic/old injury.
Figure 8c.

Images of a 55-year-old man with chronic ankle pain. (a) Coronal intermediate-weighted MR image shows posterolateral talar subluxation and tilt, with tibiotalar spurs in the medial clear space (arrow). (b) Coronal intermediate-weighted fat-saturated MR image shows tibiotalar osteoarthritis with subchondral edema (circled area). Also note amorphous signal intensity of the ATTL (arrowhead). (c) Coronal intermediate-weighted fat-saturated MR image obtained posterior to b shows thickened and remodeled tibiocalcaneal ligament (arrow) related to the chronic/old injury.
Figure 6a.

Images of a 37-year-old man with ankle pain. (a) Coronal T2-weighted fat-saturated MR image shows a hypointense tibiospring ligament (arrow) and superomedial oblique band (arrowhead). (b) Coronal T1-weighted MR image shows the hypointense tibiospring ligament (arrow) and superomedial oblique band (arrowhead). (c) Axial T2-weighted fat-saturated MR image shows the hypointense tibiospring ligament (arrow).
Figure 6b.

Images of a 37-year-old man with ankle pain. (a) Coronal T2-weighted fat-saturated MR image shows a hypointense tibiospring ligament (arrow) and superomedial oblique band (arrowhead). (b) Coronal T1-weighted MR image shows the hypointense tibiospring ligament (arrow) and superomedial oblique band (arrowhead). (c) Axial T2-weighted fat-saturated MR image shows the hypointense tibiospring ligament (arrow).
Figure 6c.

Images of a 37-year-old man with ankle pain. (a) Coronal T2-weighted fat-saturated MR image shows a hypointense tibiospring ligament (arrow) and superomedial oblique band (arrowhead). (b) Coronal T1-weighted MR image shows the hypointense tibiospring ligament (arrow) and superomedial oblique band (arrowhead). (c) Axial T2-weighted fat-saturated MR image shows the hypointense tibiospring ligament (arrow).
Figure 9a.

Images of a 45-year-old woman with medial ankle pain and findings of an old partial tear of the deltoid ligament and tibialis posterior dysfunction. (a) Coronal intermediate-weighted MR image shows amorphous signal intensity in the ATTL (arrow). (b) Coronal intermediate-weighted fat-saturated MR image shows amorphous signal intensity of the ATTL (straight arrow) and a mildly thickened tibiospring ligament (curved arrow) and superomedial oblique band (arrowhead). (c) Sagittal intermediate-weighted MR image shows amorphous signal intensity of the ATTL (arrow) and PDTL (arrowhead). (d) Axial intermediate-weighted fat-saturated MR image shows a thickened tibialis posterior tendon with mild tenosynovitis (arrowhead) and a hypointense anterior talofibular ligament related to an old partial tear (arrow).
Figure 9b.

Images of a 45-year-old woman with medial ankle pain and findings of an old partial tear of the deltoid ligament and tibialis posterior dysfunction. (a) Coronal intermediate-weighted MR image shows amorphous signal intensity in the ATTL (arrow). (b) Coronal intermediate-weighted fat-saturated MR image shows amorphous signal intensity of the ATTL (straight arrow) and a mildly thickened tibiospring ligament (curved arrow) and superomedial oblique band (arrowhead). (c) Sagittal intermediate-weighted MR image shows amorphous signal intensity of the ATTL (arrow) and PDTL (arrowhead). (d) Axial intermediate-weighted fat-saturated MR image shows a thickened tibialis posterior tendon with mild tenosynovitis (arrowhead) and a hypointense anterior talofibular ligament related to an old partial tear (arrow).
Figure 9c.

Images of a 45-year-old woman with medial ankle pain and findings of an old partial tear of the deltoid ligament and tibialis posterior dysfunction. (a) Coronal intermediate-weighted MR image shows amorphous signal intensity in the ATTL (arrow). (b) Coronal intermediate-weighted fat-saturated MR image shows amorphous signal intensity of the ATTL (straight arrow) and a mildly thickened tibiospring ligament (curved arrow) and superomedial oblique band (arrowhead). (c) Sagittal intermediate-weighted MR image shows amorphous signal intensity of the ATTL (arrow) and PDTL (arrowhead). (d) Axial intermediate-weighted fat-saturated MR image shows a thickened tibialis posterior tendon with mild tenosynovitis (arrowhead) and a hypointense anterior talofibular ligament related to an old partial tear (arrow).
Figure 9d.

Images of a 45-year-old woman with medial ankle pain and findings of an old partial tear of the deltoid ligament and tibialis posterior dysfunction. (a) Coronal intermediate-weighted MR image shows amorphous signal intensity in the ATTL (arrow). (b) Coronal intermediate-weighted fat-saturated MR image shows amorphous signal intensity of the ATTL (straight arrow) and a mildly thickened tibiospring ligament (curved arrow) and superomedial oblique band (arrowhead). (c) Sagittal intermediate-weighted MR image shows amorphous signal intensity of the ATTL (arrow) and PDTL (arrowhead). (d) Axial intermediate-weighted fat-saturated MR image shows a thickened tibialis posterior tendon with mild tenosynovitis (arrowhead) and a hypointense anterior talofibular ligament related to an old partial tear (arrow).
Recently, anteromedial and posteromedial ankle impingement syndromes and their arthroscopic treatments have been described (16,17). Ankle impingement syndrome is defined as painful mechanical limitation of ankle motion and is primarily a clinical diagnosis.
These syndromes result from fibrosis, fibrocartilaginous metaplasia, synovial proliferation, and bone hypertrophic change of the medial clear space after deep deltoid ligament injury. The ankle impingement syndromes are named according to their location. Anteromedial ankle impingement syndrome was initially thought to result from eversion injury to the ATTL; however, more recent evidence from a larger series of patients points to inversion as the more likely underlying mechanism of injury (16) (Figs 10 , 11 ). Posteromedial ankle impingement results from injury to the PDTL from inversion injury. Clinically, anteromedial impingement will lead to anteromedial ankle tenderness at eversion, and posteromedial impingement will lead to posteromedial ankle tenderness at inversion. MR imaging may demonstrate a range of findings: posttraumatic synovitis, amorphous signal intensity on T1- and T2-weighted images in the respective portions of the deep deltoid ligament related to scarring, capsular thickening, bone productive change, and small corticate ossicles. The tibialis posterior tendon may be displaced medially (16–19).
Figure 10a.

Anteromedial ankle impingement in a 55-year-old woman with previous ankle injuries and recurrent medial ankle pain. (a) Coronal intermediate-weighted MR image shows amorphous signal intensity in the ATTL with heterotopic bone formation (arrow). (b) Coronal intermediate-weighted fat-saturated MR image shows amorphous signal intensity in the ATTL and heterotopic bone formation (arrow). (c) Axial T1-weighted MR image helps confirm involvement of the ATTL (arrow) and shows a normal-appearing PDTL (arrowhead). (d) Axial intermediate-weighted fat-saturated MR image shows fibrosis and synovial proliferation of the ATTL (arrow).
Figure 10b.

Anteromedial ankle impingement in a 55-year-old woman with previous ankle injuries and recurrent medial ankle pain. (a) Coronal intermediate-weighted MR image shows amorphous signal intensity in the ATTL with heterotopic bone formation (arrow). (b) Coronal intermediate-weighted fat-saturated MR image shows amorphous signal intensity in the ATTL and heterotopic bone formation (arrow). (c) Axial T1-weighted MR image helps confirm involvement of the ATTL (arrow) and shows a normal-appearing PDTL (arrowhead). (d) Axial intermediate-weighted fat-saturated MR image shows fibrosis and synovial proliferation of the ATTL (arrow).
Figure 10c.

Anteromedial ankle impingement in a 55-year-old woman with previous ankle injuries and recurrent medial ankle pain. (a) Coronal intermediate-weighted MR image shows amorphous signal intensity in the ATTL with heterotopic bone formation (arrow). (b) Coronal intermediate-weighted fat-saturated MR image shows amorphous signal intensity in the ATTL and heterotopic bone formation (arrow). (c) Axial T1-weighted MR image helps confirm involvement of the ATTL (arrow) and shows a normal-appearing PDTL (arrowhead). (d) Axial intermediate-weighted fat-saturated MR image shows fibrosis and synovial proliferation of the ATTL (arrow).
Figure 10d.

Anteromedial ankle impingement in a 55-year-old woman with previous ankle injuries and recurrent medial ankle pain. (a) Coronal intermediate-weighted MR image shows amorphous signal intensity in the ATTL with heterotopic bone formation (arrow). (b) Coronal intermediate-weighted fat-saturated MR image shows amorphous signal intensity in the ATTL and heterotopic bone formation (arrow). (c) Axial T1-weighted MR image helps confirm involvement of the ATTL (arrow) and shows a normal-appearing PDTL (arrowhead). (d) Axial intermediate-weighted fat-saturated MR image shows fibrosis and synovial proliferation of the ATTL (arrow).
Figure 11a.

Predominantly anteromedial impingement in a 39-year-old man with recalcitrant medial ankle pain and instability. (a) Anteroposterior radiograph of the ankle shows heterotopic bone formation (arrow) in the medial tibiotalar space. (b) Coronal intermediate-weighted MR image shows heterotopic bone formation in relation to the ATTL (arrow), with amorphous signal intensity. (c) Coronal T2-weighted fat-saturated MR image shows abnormal high signal intensity (arrow) in the region of the ATTL that is due to synovial proliferation and fibrosis. (d) Axial intermediate-weighted MR image shows amorphous signal intensity in both the ATTL and the PDTL, with heterotopic bone formation (arrow) in relation to the ATTL.
Figure 11b.
Predominantly anteromedial impingement in a 39-year-old man with recalcitrant medial ankle pain and instability. (a) Anteroposterior radiograph of the ankle shows heterotopic bone formation (arrow) in the medial tibiotalar space. (b) Coronal intermediate-weighted MR image shows heterotopic bone formation in relation to the ATTL (arrow), with amorphous signal intensity. (c) Coronal T2-weighted fat-saturated MR image shows abnormal high signal intensity (arrow) in the region of the ATTL that is due to synovial proliferation and fibrosis. (d) Axial intermediate-weighted MR image shows amorphous signal intensity in both the ATTL and the PDTL, with heterotopic bone formation (arrow) in relation to the ATTL.
Figure 11c.

Predominantly anteromedial impingement in a 39-year-old man with recalcitrant medial ankle pain and instability. (a) Anteroposterior radiograph of the ankle shows heterotopic bone formation (arrow) in the medial tibiotalar space. (b) Coronal intermediate-weighted MR image shows heterotopic bone formation in relation to the ATTL (arrow), with amorphous signal intensity. (c) Coronal T2-weighted fat-saturated MR image shows abnormal high signal intensity (arrow) in the region of the ATTL that is due to synovial proliferation and fibrosis. (d) Axial intermediate-weighted MR image shows amorphous signal intensity in both the ATTL and the PDTL, with heterotopic bone formation (arrow) in relation to the ATTL.
Figure 11d.

Predominantly anteromedial impingement in a 39-year-old man with recalcitrant medial ankle pain and instability. (a) Anteroposterior radiograph of the ankle shows heterotopic bone formation (arrow) in the medial tibiotalar space. (b) Coronal intermediate-weighted MR image shows heterotopic bone formation in relation to the ATTL (arrow), with amorphous signal intensity. (c) Coronal T2-weighted fat-saturated MR image shows abnormal high signal intensity (arrow) in the region of the ATTL that is due to synovial proliferation and fibrosis. (d) Axial intermediate-weighted MR image shows amorphous signal intensity in both the ATTL and the PDTL, with heterotopic bone formation (arrow) in relation to the ATTL.
Posteromedial impingement may also coexist with osteochondral lesions of the talus (Fig 12 ). Intravenous administration of gadolinium-based contrast material, although not used routinely in orthopedic trauma MR imaging examinations of the ankle, may be helpful in demonstrating low-grade synovitis in more subtle cases (19).
Figure 12a.

Posteromedial impingement in a 46-year-old man with previous ankle injury and posteromedial pain. (a) Coronal intermediate-weighted MR image shows a normal striated appearance of the ATTL (arrow). (b) Axial intermediate-weighted MR image shows amorphous signal intensity in the PDTL, with heterotopic bone formation in the posterior and central medial clear space (thin arrow). Also note the osteochondral lesion of the posterior medial talus (thick arrow). (c) Axial intermediate-weighted fat-saturated MR image shows amorphous signal intensity in the PDTL (thin arrow) and the osteochondral lesion of the posterior medial talus (thick arrow). (d) Axial intermediate-weighted MR image obtained caudad to b shows similar findings: amorphous signal intensity in the PDTL and heterotopic bone formation in the medial clear space (arrow). (e) Axial intermediate-weighted fat-saturated MR image obtained caudad to c shows abnormal high signal intensity in the PDTL (arrow), resulting from synovial proliferation and fibrocartilaginous metaplasia.
Figure 12b.

Posteromedial impingement in a 46-year-old man with previous ankle injury and posteromedial pain. (a) Coronal intermediate-weighted MR image shows a normal striated appearance of the ATTL (arrow). (b) Axial intermediate-weighted MR image shows amorphous signal intensity in the PDTL, with heterotopic bone formation in the posterior and central medial clear space (thin arrow). Also note the osteochondral lesion of the posterior medial talus (thick arrow). (c) Axial intermediate-weighted fat-saturated MR image shows amorphous signal intensity in the PDTL (thin arrow) and the osteochondral lesion of the posterior medial talus (thick arrow). (d) Axial intermediate-weighted MR image obtained caudad to b shows similar findings: amorphous signal intensity in the PDTL and heterotopic bone formation in the medial clear space (arrow). (e) Axial intermediate-weighted fat-saturated MR image obtained caudad to c shows abnormal high signal intensity in the PDTL (arrow), resulting from synovial proliferation and fibrocartilaginous metaplasia.
Figure 12c.

Posteromedial impingement in a 46-year-old man with previous ankle injury and posteromedial pain. (a) Coronal intermediate-weighted MR image shows a normal striated appearance of the ATTL (arrow). (b) Axial intermediate-weighted MR image shows amorphous signal intensity in the PDTL, with heterotopic bone formation in the posterior and central medial clear space (thin arrow). Also note the osteochondral lesion of the posterior medial talus (thick arrow). (c) Axial intermediate-weighted fat-saturated MR image shows amorphous signal intensity in the PDTL (thin arrow) and the osteochondral lesion of the posterior medial talus (thick arrow). (d) Axial intermediate-weighted MR image obtained caudad to b shows similar findings: amorphous signal intensity in the PDTL and heterotopic bone formation in the medial clear space (arrow). (e) Axial intermediate-weighted fat-saturated MR image obtained caudad to c shows abnormal high signal intensity in the PDTL (arrow), resulting from synovial proliferation and fibrocartilaginous metaplasia.
Figure 12d.

Posteromedial impingement in a 46-year-old man with previous ankle injury and posteromedial pain. (a) Coronal intermediate-weighted MR image shows a normal striated appearance of the ATTL (arrow). (b) Axial intermediate-weighted MR image shows amorphous signal intensity in the PDTL, with heterotopic bone formation in the posterior and central medial clear space (thin arrow). Also note the osteochondral lesion of the posterior medial talus (thick arrow). (c) Axial intermediate-weighted fat-saturated MR image shows amorphous signal intensity in the PDTL (thin arrow) and the osteochondral lesion of the posterior medial talus (thick arrow). (d) Axial intermediate-weighted MR image obtained caudad to b shows similar findings: amorphous signal intensity in the PDTL and heterotopic bone formation in the medial clear space (arrow). (e) Axial intermediate-weighted fat-saturated MR image obtained caudad to c shows abnormal high signal intensity in the PDTL (arrow), resulting from synovial proliferation and fibrocartilaginous metaplasia.
Figure 12e.

Posteromedial impingement in a 46-year-old man with previous ankle injury and posteromedial pain. (a) Coronal intermediate-weighted MR image shows a normal striated appearance of the ATTL (arrow). (b) Axial intermediate-weighted MR image shows amorphous signal intensity in the PDTL, with heterotopic bone formation in the posterior and central medial clear space (thin arrow). Also note the osteochondral lesion of the posterior medial talus (thick arrow). (c) Axial intermediate-weighted fat-saturated MR image shows amorphous signal intensity in the PDTL (thin arrow) and the osteochondral lesion of the posterior medial talus (thick arrow). (d) Axial intermediate-weighted MR image obtained caudad to b shows similar findings: amorphous signal intensity in the PDTL and heterotopic bone formation in the medial clear space (arrow). (e) Axial intermediate-weighted fat-saturated MR image obtained caudad to c shows abnormal high signal intensity in the PDTL (arrow), resulting from synovial proliferation and fibrocartilaginous metaplasia.
Treatment
Controversies exist with regard to the treatment of deltoid ligament injuries (20). More commonly, conservative treatment with the RICE (rest, ice, compression, and elevation) protocol is recommended. MR imaging evaluation is important to detect deltoid injury in cases of lateral ankle ligament sprain because the findings can guide the physiotherapy protocol. Aggressive physiotherapy is typically delayed in cases of coexisting deltoid injury. Careful reconstruction of the deltoid ligament is recommended if restoration of full mechanical stability is not proved after internal fixation of an ankle fracture because the instability may be related to interposition of the disrupted ligament between the medial malleolus and the talus. In type I injuries, reattachment of the disrupted/avulsed ligament may be possible. In type II and III injuries, reconstruction with posterior tibialis tendon or tendon grafts may be necessary. In view of the good to excellent results of primary repair and the problems associated with chronic nonrepaired tears, such as chronic disability, osteoarthritis, and impingement syndromes, surgical intervention may be more often advocated in the future (12,21). In the case of progressive pronation and hindfoot valgus deformity, additional calcaneus-lengthening osteotomy or tibiocalcaneal arthrodesis may be considered. Patients with anteromedial and posteromedial impingement benefit from arthroscopic débridement (16,18,19).
Conclusions
The deltoid ligament serves a primary role in stabilizing the ankle joint. It is important for the radiologist to recognize specific superficial and deep components of the deltoid ligament. Better understanding of the MR imaging appearance of various abnormalities, including partial and complete ligamentous tears, secondary degenerative changes, associated spring ligament pathologic findings, tibialis posterior dysfunction, and anteromedial and posteromedial ankle impingement syndromes, may guide the clinical decision process for early treatment and prevention of long-term morbidity.
Figure 5a.

Acute ankle injury. (a) Coronal T1-weighted MR image shows amorphous signal intensity in the ATTL (curved arrow) and subcutaneous edema, most prominent medially (straight arrow). (b) Coronal T2-weighted fat-saturated MR image again shows subcutaneous edema (straight arrow), a grade I sprain of the ATTL (curved arrow), and a grade II sprained hypointense tibiospring ligament (arrowhead).
Figure 5b.

Acute ankle injury. (a) Coronal T1-weighted MR image shows amorphous signal intensity in the ATTL (curved arrow) and subcutaneous edema, most prominent medially (straight arrow). (b) Coronal T2-weighted fat-saturated MR image again shows subcutaneous edema (straight arrow), a grade I sprain of the ATTL (curved arrow), and a grade II sprained hypointense tibiospring ligament (arrowhead).
For this CME activity, the authors, editors, and reviewers have no relevant relationships to disclose.
Funding: The research was supported by the National Institutes of Health [grant number 1T32-EB006351].
Abbreviations:
- ATTL
- anterior tibiotalar ligament
- PDTL
- posterior deep tibiotalar ligament
- TE
- echo time
References
- 1.Muhle C, Frank LR, Rand T, et al. Collateral ligaments of the ankle: high-resolution MR imaging with a local gradient coil and anatomic correlation in cadavers. RadioGraphics 1999;19(3):673–683 [DOI] [PubMed] [Google Scholar]
- 2.Stoller DW.Magnetic resonance imaging in orthopaedics and sports medicine 3rd ed.Baltimore, Md: Lippincott Williams & Wilkins, 2006; 786–793 [Google Scholar]
- 3.Pankovich AM, Shivaram MS.Anatomical basis of variability in injuries of the medial malleolus and the deltoid ligament. I. Anatomical studies. Acta Orthop Scand 1979;50(2):217–223 [DOI] [PubMed] [Google Scholar]
- 4.Klein MA.MR imaging of the ankle: normal and abnormal findings in the medial collateral ligament. AJR Am J Roentgenol 1994;162(2):377–383 [DOI] [PubMed] [Google Scholar]
- 5.Hintermann B.Biomechanics of the unstable ankle joint and clinical implications. Med Sci Sports Exerc 1999;31(suppl 7):S459–S469 [DOI] [PubMed] [Google Scholar]
- 6.Harper MC.Deltoid ligament: an anatomical evaluation of function. Foot Ankle 1987;8(1):19–22 [DOI] [PubMed] [Google Scholar]
- 7.Tryfonidis M, Jackson W, Mansour R, et al. Acquired adult flat foot due to isolated plantar calcaneonavicular (spring) ligament insufficiency with a normal tibialis posterior tendon. Foot Ankle Surg 2008;14(2):89–95 [DOI] [PubMed] [Google Scholar]
- 8.Harish S, Kumbhare D, O'Neill J, Popowich T.Comparison of sonography and magnetic resonance imaging for spring ligament abnormalities: preliminary study. J Ultrasound Med 2008;27(8):1145–1152 [DOI] [PubMed] [Google Scholar]
- 9.Deland JT, de Asla RJ, Sung IH, Ernberg LA, Potter HG.Posterior tibial tendon insufficiency: which ligaments are involved? Foot Ankle Int 2005;26(6):427–435 [DOI] [PubMed] [Google Scholar]
- 10.Mengiardi B, Pfirrmann CW, Vienne P, Hodler J, Zanetti M.Medial collateral ligament complex of the ankle: MR appearance in asymptomatic subjects. Radiology 2007;242(3)817–824 [DOI] [PubMed] [Google Scholar]
- 11.Hintermann B, Valderrabano V, Boss A, Trouillier HH, Dick W.Medial ankle instability: an exploratory, prospective study of fifty-two cases. Am J Sports Med 2004;32(1):183–190 [DOI] [PubMed] [Google Scholar]
- 12.Hintermann B, Knupp M, Pagenstert GI.Deltoid ligament injuries: diagnosis and management. Foot Ankle Clin 2006;11(3):625–637 [DOI] [PubMed] [Google Scholar]
- 13.Hintermann B, Regazzoni P, Lampert C, Stutz G, Gächter A.Arthroscopic findings in acute fractures of the ankle. J Bone Joint Surg Br 2000;82(3):345–351 [DOI] [PubMed] [Google Scholar]
- 14.Schuberth JM, Collman DR, Rush SM, Ford LA.Deltoid ligament integrity in lateral malleolar fractures: a comparative analysis of arthroscopic and radiographic assessments. J Foot Ankle Surg 2004;43(1):20–29 [DOI] [PubMed] [Google Scholar]
- 15.DeAngelis NA, Eskander MS, French BG.Does medial tenderness predict deep deltoid ligament incompetence in supination-external rotation type ankle fractures? J Orthop Trauma 2007;21(4):244–247 [DOI] [PubMed] [Google Scholar]
- 16.Robinson P, White LM, Salonen D, Ogilvie-Harris D.Anteromedial impingement of the ankle: using MR arthrography to assess the anteromedial recess. AJR Am J Roentgenol 2002;178(3):601–604 [DOI] [PubMed] [Google Scholar]
- 17.Egol KA, Parisien JS.Impingement syndrome of the ankle caused by a medial meniscoid lesion. Arthroscopy 1997;13(4):522–525 [DOI] [PubMed] [Google Scholar]
- 18.Koulouris G, Connell D, Schneider T, Edwards W.Posterior tibiotalar ligament injury resulting in posteromedial impingement. Foot Ankle Int 2003;24(8):575–583 [DOI] [PubMed] [Google Scholar]
- 19.Robinson P.Impingement syndromes of the ankle. Eur Radiol 2007;17(12):3056–3065 [DOI] [PubMed] [Google Scholar]
- 20.Strömsöe K, Höqevold HE, Skjeldal S, Alho A.The repair of a ruptured deltoid ligament is not necessary in ankle fractures. J Bone Joint Surg Br 1995;77(6):920–921 [PubMed] [Google Scholar]
- 21.Buman EM, Khazen G, Haraguchi N, et al. Minimally invasive deltoid ligament reconstruction: a comparison of three techniques. Presented at the 36th Annual Winter Meeting, Chicago, Ill: Specialty Day, American Orthopaedic Foot and Ankle Society; March 25, 2006 [Google Scholar]