

Abstract
We developed a Markov model of cardiac thin filament activation that accounts for interactions among nearest-neighbor regulatory units (RUs) in a spatially explicit manner. Interactions were assumed to arise from structural coupling of adjacent tropomyosins (Tms), such that Tm shifting within each RU was influenced by the Tm status of its neighbors. Simulations using the model demonstrate that this coupling is sufficient to produce observed cooperativity in both steady-state and dynamic force-Ca2+ relationships. The model was further validated by comparison with reported responses under various conditions including inhibition of myosin binding and the addition of strong-binding, non-force-producing myosin fragments. The model also reproduced the effects of 2.5 mM added Pi on Ca2+-activated force and the rate of force redevelopment measured in skinned rat myocardial preparations. Model analysis suggests that Tm-Tm coupling potentiates the activating effects of strongly-bound cross-bridges and contributes to force-Ca2+ dynamics of intact cardiac muscle. The model further predicts that activation at low Ca2+ concentrations is cooperatively inhibited by nearest neighbors, requiring Ca2+ binding to >25% of RUs to produce appreciable levels of force. Without excluding other putative cooperative mechanisms, these findings suggest that structural coupling of adjacent Tm molecules contributes to several properties of cardiac myofilament activation.
Introduction
The mechanisms by which Ca2+ transients in cardiac myocytes determine the dynamics of systolic tension development and relaxation are critical to normal heart function and to key alterations in diseases such as heart failure. That mutations in each component of the Ca2+ regulatory switch have been associated with cardiomyopathy underscores the importance of thin-filament activation mechanisms in cardiac mechanical performance (1,2).
The troponin complex (Tn) and tropomyosin (Tm) are the primary components of the thin-filament regulatory switch. Ca2+ binding to a low-affinity site on the troponin C (TnC) subunit of Tn induces a conformational change that in turn allows Tm to move across the surface of the actin filament, exposing sites on actin to which the S1 region of myosin cyclically attaches to generate force (3). However, there is also evidence for reverse interactions in this cascade. Experiments in skinned myocytes have shown that S1 binding to actin increases the affinity of TnC for Ca2+ (4) and is able to activate force production in myofilaments at extremely low [Ca2+] (5). These observations suggest that myosin cross-bridge (XB) formation plays an important part in the steep cooperative relationship between steady-state force and activating Ca2+ that is well recognized in cardiac muscle.
Other molecular interactions have been identified with cooperative myofilament activation. Neighboring Tm molecules along the actin filament overlap by 8–11 amino acid residues (6). Steric end-to-end interactions in this region may modulate cooperative binding of S1 to regulated actin in vitro (7), and spatially explicit models have demonstrated that the propagation of this interaction among adjacent Tm molecules can produce cooperative steady-state force-[Ca2+] responses (see Rice and De Tombe (8) and references therein). However, it was not feasible in these models to investigate the dynamics of cardiac myocyte twitch tension or the observed strong [Ca2+] dependence of the rate at which cardiac muscle redevelops force after a length perturbation (ktr). Mean-field models do recapitulate features of cardiac force-[Ca2+] dynamics (9,10), but all of them have relied on empirical feedback mechanisms that may not accurately represent proposed structural mechanisms (8,11).
Among many putative cooperative mechanisms (8), the purpose of this study was to test the ability of Tm-Tm coupling to reproduce both steady-state and dynamic Ca2+-force relations seen in cardiac muscle. We formulated a Markov model of thin-filament activation based on Tm-Tm coupling and recognized structural relations among signaling proteins. A continuous-time implementation of the model was used to compute both steady-state and dynamic responses through an efficient new technique for quasiexplicit representation of nearest-neighbor interactions. The model was also solved using Monte Carlo methods for perturbations requiring fully explicit representation of full-length filaments and for validation of continuous-time solutions. Using the model, we show that Tm-Tm interactions potentiate the activating effects of XBs and are sufficient to explain steep cooperative activation of force, the observed dependence of ktr on [Ca2+], and Ca2+-force dynamics during isometric myocyte twitches.
Model Development
The model is based on actin regulatory units (RUs), comprising seven actin monomers, TnC, TnI (the inhibitory subunit of Tn), and Tm, together with the S1 region of myosin. We assume conformations for each component as a simplification of the Tn switch mechanism (3). TnC has Ca2+-free and Ca2+-bound conformations, and a third conformation associated with bulk movement of the Tn complex due to Tm shifting (12). The C-terminal region of TnI is assumed to be either bound to actin or bound to TnC (3). Three conformations of Tm are assumed, corresponding to observed structural positions on the surface of the actin filament (13) and following the model of McKillop and Geeves (14). In the blocking position, S1 binding sites on actin are sterically blocked by Tm; in the closed position, only weak binding of S1 to actin is possible, and the open position corresponds to the presence of strongly bound S1.
The model formulation is based on four allosteric interactions: 1), Ca2+ binding to TnC induces transfer of TnI from actin to TnC; dissociation of Ca2+ reverses the transfer; 2), Tm can transition from blocked to closed only when TnI is dissociated from actin; 3), Tm must be in the blocked conformation before TnI can rebind actin and before Ca2+ can dissociate from TnC; and 4), strong binding of myosin places and holds Tm in the open conformation.
Assumptions 1–3 collectively implement the tight coupling premise (15), because activation of Tn is tightly coupled to the binding of Ca2+, and because Ca2+ cannot dissociate from Tn when Tm is in the closed or open positions. Assumption 3 is based on the idea that in the closed or open states, Tm prevents the TnI region from rebinding actin, similar to the assumption used by Smith and Geeves (16). They considered TnI and S1 as competing for the same binding site on actin, whereas we assume that TnI and Tm compete in a way that makes it possible for Tm to influence Tn even in the absence of S1 binding.
We initially made the simplification that each RU in effect regulated a single myosin binding site. An augmented version of the model that allows binding of more than one XB was also tested, since structural studies (17) have suggested that in the intact myofilament lattice as many as three XBs can bind a single RU (see the Supporting Material). A similar assumption, made necessary by representation of the thin-filament RU-level resolution, is that Ca2+ binding to an RU cannot directly expose binding sites in adjacent RUs.
The above assumptions form a four-state model of an individual RU regulated by Ca2+, each state containing information about the conformational status of the four signaling components (Fig. 1). This may be thought of as a modification of the three-state Tm model (14) in which the blocked state (B) is partitioned into Ca2+-free (B0) and Ca2+-bound (B1) states. Binding of Ca2+ to the RU (B0→B1) is represented as a second-order process dependent on [Ca2+] and governed by the second-order rate constant, k+Ca. Ca2+ dissociation is determined by the rate constant k−Ca. The transition between B1 and the closed state (C) occurs according to forward rate constant k+B and reverse rate constant k−B. We assume that the transition between closed and open (M) states is rate-limited by activity of myosin S1 and accordingly assign this transition to be governed by the simplified XB-cycling rate constants f and g (18).
Figure 1.

Individual RU model. Each RU resides in one of four states depicting Ca2+ binding, tropomyosin (Tm) shifting, and myosin attachment. The B1↔C and C↔M transition rates are functions of Tm states of the two neighboring RUs (X and Y). See text for details.
Representation of nearest-neighbor thin-filament interactions
Individual RUs do not operate independently owing to structural connections with adjacent RUs along the thin filament (6). This structural interaction inspired an early model by Hill and co-workers (19) and later several others (8,16). We represented these interactions by assuming that the free-energy change required for the B→C transition of a single RU depends on nearest-neighbor RUs according to the formulation
| (1) |
where is the free-energy change under reference conditions, which we chose as those in which both neighbors are in the C state. and represent additive contributions of either neighboring RU (having Tm states X and Y, respectively) to the free-energy change. The notion underlying this formulation is that Tm-Tm coupling imposes additional energy change on transitions that results in neighboring RUs occupying dissimilar states. The equilibrium constant between C and B states, , can be expressed in terms of using the Gibbs relation,
| (2) |
or, alternately, as
| (3) |
where and . For convenience, we define the cooperative coefficients as
| (4) |
and
| (5) |
Using these definitions, γ (XY) takes on the neighbor-dependent values
| (6) |
| (7) |
| (8) |
| (9) |
| (10) |
| (11) |
Thus, when either coefficient is >1, the system of interacting RUs is more tightly coupled and therefore more cooperative.
In an analogous manner, the neighbor-dependent equilibrium constant between the M and C states, , is
| (12) |
with μ(XY) taking on the values
| (13) |
| (14) |
| (15) |
| (16) |
| (17) |
| (18) |
It can be shown that to satisfy microscopic reversibility in a system of interacting RUs and under the above assumptions, the constraint γM = μB must be applied. Thus, in the model, the cooperative mechanisms represented by γM and μB are not independent.
For dynamic simulations, it is necessary to divide cooperative coefficients between forward and reverse rates. This is accomplished using the parameters r and q as follows:
| (19) |
| (20) |
| (21) |
| (22) |
Selection of model parameters
Four model parameter sets were used to represent different experimental systems and conditions (Table 1). The equilibrium constant of Ca2+ binding to TnC (KCa = k+Ca/k−Ca) was set at 0.8 μM−1 based on recent FRET measurements in rat cardiac Tn.Tm complexes at 15°C (20). We also chose baseline values of k+Ca = 0.09 ms−1 and k−Ca = 0.113 ms−1, based on the fastest phase of stopped-flow FRET data from the same study; these rates were increased for simulations of intact muscle at 22°C (Table 1, Set 4). Rates and were assumed to be very rapid relative to other rates (21). The equilibrium constant () was adjusted in each parameter set for fixed values of () such that Ca2+ sensitivity of the response in question matched measured values. Rates fref and gref were scaled to match dynamic force responses.
Table 1.
Model parameter sets
| Set | (μM−1 ms−1) | (ms−1) | (ms−1) | (ms−1) | fref (ms−1) | gref (ms−1) | γB | γM | μM | r | q |
|---|---|---|---|---|---|---|---|---|---|---|---|
| 1 | 0.09 | 0.113 | 15 | 0.375 | — | — | 10 | — | — | — | 0.5 |
| 2 | 0.09 | 0.113 | 15 | 0.327 | 0.0028 | 0.0116 | 30 | 7 | 2 | 1 | 0.5 |
| 3 | 0.09 | 0.15 | 15 | 0.327 | 0.0025 | 0.0135 | 30 | 7 | 2 | 1 | 0.5 |
| 4 | 1 | 1.4286 | 2.5 | 0.0333 | 0.04 | 0.0686 | 30 | 7 | 2 | 1 | 0.5 |
The value of γB = 10 (Table 1, Set 1) was determined by matching thin-filament Ca2+ binding predicted by the model with data obtained using fluorescently labeled TnC in the absence of myosin ((22), bovine Tm). This value corresponds to an energy change of 5.5 kJ/mol at 15°C. (Values of γM and μM were not used in Set 1 because of the absence of myosin.) A higher energy of 8.1 kJ/mol (γB = 30) was assumed in the remaining parameter sets, which were chosen to reproduce data in rats. In selecting values of γM and μM, we assumed γB > γM > μM as a general framework. This inequality was reasoned from the relative azimuthal positions of Tm on actin, observed in structural studies (13), in which the difference between positions associated with the B and C states was more than twice that between positions associated with the C and M states (25° vs. 10°). Values of γM = 7 (4.7 kJ/mol) and μM = 2 (1.7 kJ/mol) were assumed accordingly. Model responses were not sensitive to q, and its value was set to 0.5. It was initially assumed that neighbor status would affect XB attachment more than detachment, and r was set to 1.0 for all simulations. Simulations showing the other extreme (r = 0) are presented in the Supporting Material.
Simulations of coupled thin-filament RUs
In a system of multiple interacting RUs, the model formulation requires explicit tracking of the Tm status of each RU to calculate transition rates (Eqs. 19–22). Two approaches were used. In the first, we assumed that a given spatial arrangement of RUs in various Tm states constitutes a discrete energetic state of the entire thin filament. To make the problem tractable, we considered a shorter segment of nine adjacent RUs joined to form a ring, similar to the approach of Dobrunz et al. (23). We improved the efficiency of this approach by collapsing degenerate states that arise from the ring arrangement, which yielded a Markov model containing 1219 unique states. Continuous-time solutions were obtained by solving the system of ordinary differential equations described by the Markov model. In the second approach, we used a Monte Carlo method to simulate responses in a full-length thin filament (26 RUs). This method allowed transition probabilities for each RU to be updated at every time step based on the status of nearest neighbors. Monte Carlo simulations were used to determine the accuracy of and to bypass certain limitations imposed by the ring simplification. The results presented below were obtained using the first method except as noted.
Supporting Material
The online supplement to this article contains full details regarding the development and implementation of solution methods. It also contains descriptions of the protocols and assumptions involved in simulating ktr, the action of NEM-S1 fragments, the presence of nonfunctional TnC, and TnC conformation. Full code listings for reproducing the results presented in this work can also be found in the online Supporting Material.
Results
Tm-Tm coupling alters Ca2+ binding properties of the thin filaments
We first tested the ability of the model to reproduce activation behavior in a simplified system. It was assumed that the total fraction of RUs with bound Ca2+ corresponded to the normalized fluorescence intensity from labeled TnC in normal and mini thin filaments 1 RU long (22). A set of model parameters (Table 1, Set 1) was determined that reproduced data from full-length thin filaments (R2 = 0.92, Fig. 2). In mini thin filaments, Tm ends interacted with tropomodulin and troponin T-gelsolin fusion proteins used to cap F-actin, rather than with neighboring Tm molecules. As the precise nature of these interactions is unknown, we considered the possibilities that Tm ends were constrained in a manner equivalent to BB, BC, or CC nearest-neighbor configurations. Fixing neighbor conditions to BC without changing any parameter values predicted Ca2+ binding to mini thin filaments with high fidelity (R2 = 0.90, Fig. 2).
Figure 2.

Nearest-neighbor coupling modifies thin filament Ca2+ binding. The fraction of RUs with Ca2+ bound (P{TnC.Ca}) was assumed to equal the normalized fluorescence intensity of labeled TnC from experiments. Model parameters (solid line) were adjusted such that P{TnC.Ca} matched measurements in conventional, full-length filaments (solid circles). Using this parameter set (Table 1, Set 1), Ca2+ binding to mini thin filaments approximately one RU in length was modeled by assuming that filament capping proteins interacted with Tm ends to resemble nearest neighbors in the BB (dash-dotted line), BC (dashed line), or CC (dotted line) configurations. The assumption of BC apparent nearest-neighbor conditions closely matched measurements (open circles, R2 = 0.900). Data points were digitized from Gong et al. (22).
Distinct roles of nearest-neighbor interactions in myofilament activation
A sensitivity analysis was constructed using various sets of cooperative coefficient values to evaluate the relative role of each coefficient in the Ca2+ dependence of force and the rate of force redevelopment after a rapid slack/restretch maneuver (ktr) (Fig. 3). Interaction between cooperative coefficients and myosin binding was examined using low and high values of the effective XB duty cycle (δeff), the steady-state fraction of RUs in the M state. Values of , f, and g were simultaneously adjusted for each combination of γB, γM, and μM such that half-activation of force (pCa50) was 5.85, ktr at pCa 4.5 was 9.5 s−1, and δeff was either 0.25 or 0.75. The first two constraints derive from measured values (5) and provide a physiologically-relevant range of model responses. Fitted parameter values satisfying these constraints and complete sensitivity analysis results are presented in the Supporting Material.
Figure 3.

Different effects of cooperative coefficients γB, γM, and μM on Ca2+ sensitivities of force and the rate of force redevelopment (ktr). Relations shown in the first row, effective duty cycle 0.25, were obtained using Parameter set 2. The remaining panels show results from variations on this base parameter set. Corresponding values of γB, γM, and μM are given for each row of results, along with ΔGtot, the sum of absolute energy changes (kJ/mol) described by the given combination of cooperative coefficients. For each set of cooperative coefficients, the equilibrium constant and XB kinetic rates f and g were adjusted simultaneously until the half-activation of force was pCa 5.85, the effective XB duty cycle was either 0.25 or 0.75, and ktr at pCa 4.5 was 9.5 s−1. Experimentally measured values from Fitzsimons et al. (5) (data points) are repeated in each panel for comparison.
The baseline model response (Table 1, Set 2), making use of the inequality γB > γM > μM, exhibited strong Ca2+ dependence of ktr, which was consistent with experiments. Increasing δeff to 0.75 slowed ktr at low levels of activation, but shifted the ktr-pCa relation to the right of the experimentally measured relation. The higher value of δeff was seen to have this effect regardless of the combination of cooperative coefficients used (Fig. 3, column 1).
Most parameter sets produced asymmetric steady-state force-pCa curves, wherein the Hill coefficient of force at levels below half-maximal (n1) is greater than that of force above half-maximal (n2). Setting γM to unity had a disproportionate effect on n1, independent of δeff (Fig. 3, row 2). In the absence of this interaction, n1 was reduced from 3.64 to 2.76, whereas n2 underwent a smaller change, from 2.35 to 2.19 (δeff = 0.25). Removing γM also raised ktr at low activation, showing that responses on that interval are particularly sensitive to this type of cooperative interaction.
We assessed relative potency of the three types of cooperative interactions by associating each in turn with the same absolute free-energy change (Fig. 3, rows 3–5). γB showed the highest cooperativity at both levels of δeff (nH = 4.0 in both cases). γM and μM showed greater cooperativity at δeff = 0.75 (nH = 2.76 and 2.0, respectively) than at δeff = 0.25 (nH = 1.57 and 1.52, respectively), but in all cases were less cooperative than γB. γB was also sufficient on its own to introduce physiologic dependence of ktr on pCa, whereas γM required δeff = 0.75 to produce a similar effect. μM produced almost no pCa dependence of ktr.
To test the inequality γB > γM > μM, we distributed a total amount of free energy equivalent to that used in Parameter set 2 equally among the three coefficients (Fig. 3, row 6). Doing so reduced nH from 3.07 to 2.17 and attenuated dependence of ktr on pCa (δeff = 0.25).
Effects of NEM-S1 on force-pCa and ktr-pCa relations
Monte Carlo simulations of full-length filaments were used to examine the effects of NEM-S1 binding at random to 10% of RUs. This caused a marked reduction in the Hill coefficient fit to points below half-maximal force (from 3.15 to 1.68, compared with 4.72 to 1.54 in experiments) and shifted pCa50 leftward from 5.80 to 6.03, compared with an experimentally recorded shift of 5.85 to 5.95 (5). NEM-S1 blunted the activation dependence of ktr, increasing ktr at pCa 6.0 from 3.7 to 9.0 s−1 (compared with the increase from 1.1 to 8.9 s−1 in experiments). The model also predicted trends of steady-state force and ktr over the entire range of pCa values that were in good agreement with the data (Fig. 4, a and b).
Figure 4.

Model responses from spatially explicit Monte Carlo simulations on full-length filaments containing 26 RUs. Each model data point was obtained from responses averaged across >1000 trials. Effect of NEM-S1 on Ca2+ sensitivities of force (a) and rate of force redevelopment (ktr) (b) normalized to values at pCa 4.5 for control (+) and NEM-S1 (X) conditions. Data from control (circles) and NEM-S1 (triangles) conditions were digitized from Fitzsimons et al. (5). (c) Modeled effect of 50% nonfunctional TnC (X) on steady-state force-pCa relation compared with control (+). (d) Experimental measurements under the same conditions, digitized from Gillis et al. (24). Each data series in c and d has been normalized to its maximum value. Parameter set 2 was used for all simulations shown.
Effects of nonfunctional TnC on force-pCa relations and ktr
Monte Carlo simulations were also used to assess the effects of randomly replacing varying fractions of TnC with mutant nonfunctional (non-Ca2+-binding) TnC (xTnC (24)). In the model, RUs containing xTnC were fixed in the B0 state. Levels of 25% and 50% xTnC reduced maximal Ca2+ activated force to 20% and 1% of control, respectively, compared with the less extreme values of 71% and 28% seen experimentally. Conditions of 50% xTnC (Fig. 4, c and d) reduced nH of steady-state force from 2.3 to 1.5 (compared with the reduction from 3.4 to 2.8 in experiments) and shifted half-activation rightward by 0.36 pCa units (0.2 in experiments). ktr was not reduced below the control value at pCa 4.0 but was slowed to 5.0 s−1 (down from 9.7 s−1) by pCa 5.3. This is similar to experiments, which showed that 50% xTnC conditions slowed ktr at submaximal activation.
Cooperative inhibition allows substantial TnC-Ca2+ binding without activating force
Tn-state occupancy from the model was expressed as a relative average probe angle Δθavg and compared with rhodamine-labeled TnC experiments (12,25). The Ca2+ dependence of Δθavg was biphasic, resembling observations (12) (Fig. 5 a). The transition from negative to positive Δθavg was concomitant with force in both model and experiments, with both showing substantial changes in Δθavg (−0.20 and −0.31, respectively) by pCa 6.4 (at which point force was <1% its maximal value) (Fig. 5 a).
Figure 5.
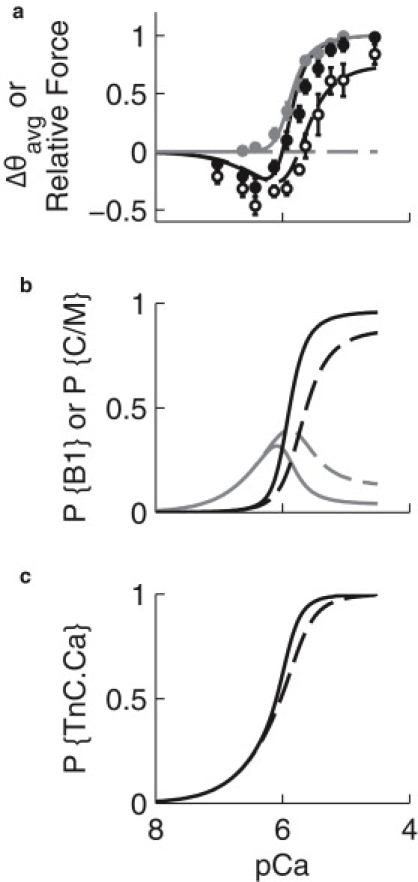
Effect of XBs on Ca2+ dependence of TnC conformation. (a) The relative change in probe angle (Δθavg) of labeled TnC was modeled under control conditions (black line and black circles) and during inhibition of XB binding (dashed line and open circles). Relative force (gray line and gray circles) is also shown for comparison. Data points were digitized from Bell et al. (12); bars show the mean ± SE. (b) Ca2+-dependent occupancy of B1 (P{B1}) and C/M states (P{C/M}) under control (gray and black solid lines, respectively) and XB-inhibited conditions (gray and black dashed lines, respectively). (c) Ca2+-dependent Ca2+ binding to TnC (P{TnC.Ca}) under control (solid line) and XB-inhibited (dashed line) conditions. Parameter set 2 was used for simulations.
The effect of XB inhibition on the Δθavg-pCa relation was obtained by setting f ≈ 0. This shifted the rising phase of the curve rightward and increased the magnitude of the negative phase, in good agreement with measurements made in the presence of vanadate (12) (Fig. 5 a).
Tm-Tm coupling inhibited force at low [Ca2+]. At pCa 6.36, the force predicted by the model is <1% of the maximum even as >25% of TnC Ca2+ binding sites are occupied (Fig. 5 c). As [Ca2+] is increased, RUs in the B1 state accumulate to a level sufficient to overcome cooperative inhibition, and activation becomes highly sensitive to [Ca2+] (Fig. 5 b). In the presence of XB inhibitors, the model predicts that greater amounts of TnC.Ca2+ must accumulate before cooperative inhibition by Tm-Tm interaction is overcome (Fig. 5 b). This may explain the larger magnitude of the negative phase of Δθavg observed experimentally in the presence of vanadate (12) (Fig. 5 a).
XBs indirectly increase thin-filament Ca2+ affinity
XB binding increased the total fraction of TnC sites occupied by Ca2+ (P{TnC.Ca}) between pCa 6.3 and 5.0, having a maximal effect at pCa 5.81, where XBs increased P{TnC.Ca} by 14% (Fig. 5 c). At low [Ca2+], cooperative inhibition eliminates the effects of XBs on apparent Ca2+ affinity. XBs also have little effect on affinity at high [Ca2+], because at saturating concentrations, Ca2+ binding alone is sufficient for activation.
Thin-filament cooperativity can account for effects of inorganic phosphate
Model predictions of the effects of inorganic phosphate (Pi) were compared with unpublished data from experiments described by Campbell (26). After adjusting model parameters to match control responses (Table 1, Set 3), increasing the parameter g from 0.0135 to 0.0185 ms−1 in the model was sufficient to match the changes to steady-state force (Fss) and ktr measured under 2.5 mM added Pi. Elevating [Pi] increased normalized residual tension after restretch (Fresid/Fss) relative to control (Fig. 6 b). In the model, control Fresid/Fss values were best fit by setting the duty cycle during restretch (δrs; see the Supporting Material) to 0.275. Fitting Fresid/Fss values from the 2.5 mM [Pi] set required a slight decrease in δrs to 0.25. The predicted ktr-Fresid/Fss relations (Fig. 6 d) were qualitatively similar to those observed.
Figure 6.

Effects of added Pi on Ca2+ dependencies of steady-state force, residual force after restretch (Fresid), and ktr in skinned rat myocardial preparations. Each panel shows the mean ± SD of pooled data from control (n = 13–52 for different pCa values; solid circles) and preparations with 2.5 mM added Pi (n = 6–9; open circles). Also shown are model responses matching control (solid lines) and added Pi (dashed lines). (a) Relative steady-state force (Fss) as a function of pCa. (b) Fss plotted against Fresid/Fss. (c) ktr as a function of pCa. (d) ktr plotted against Fresid/Fss. Parameter set 3 was used.
Tm-Tm interactions potentiate the activating effects of XBs
In the absence of Tm-Tm interaction (), Ca2+-dependent activation (ACa) was greater than the XB-dependent component (AXB; see Fig. 7 legend) for all pCa (Fig. 7 b). When Tm-Tm interactions were included (Fig. 7 e, parameter set 2), peak AXB exceeded ACa at pCa ∼5.95, near the value at which XBs had maximal influence on thin-filament Ca2+ buffering. This demonstrates an interaction between XB-mediated recruitment of activation and structural coupling of RUs via Tm.
Figure 7.

Tropomyosin-tropomyosin interactions potentiate XB-dependent activation. The model was used to examine thin-filament activation in the absence (γB, γM, and μM = 1) (a–c) and presence (γB = 30, γM = 7, and μM = 2) (d–f) of Tm-Tm interactions. (a and d) Total thin-filament activation, defined as the sum of the fraction of RUs in the C and M states (Atot) in the presence (solid lines) and absence (dashed lines) of XB binding. (b and e) Ca2+-dependent activation (ACa; dashed lines) is equal to Atot in the absence of XBs; the XB-dependent component of activation (AIB; solid lines) is Atot − ACa. (c and f) Ca2+ and XB components of activation normalized by Atot at each pCa value (ACa/Atot and AXB/Atot; dashed and dotted lines, respectively). ACa/Atot as a function of pCa resembles the corresponding ktr-pCa relations. Parameter set 2 was used.
Model responses to time-varying [Ca2+] input
Model parameters were adjusted to reproduce steady-state force-pCa curves obtained during pharmacologically slowed twitches in intact rat trabeculae at 22°C (23). Without changing equilibrium constants, it was then possible to adjust kinetic rates such that twitch force in response to a measured Ca2+ transient agreed closely with measured twitch force (R2 = 0.846, 5.6% root mean-squared error), also from rat trabecula at 22°C and under constant sarcomere length (27) (Table 1, Set 4). Driving the model with measured Ca2+ transients from the study of Dobrunz et al. (23) qualitatively recapitulated time courses of recorded twitches (Fig. 8 a). The elapsed time from peak twitch force to 50% decay predicted by the model also agreed well with measured values.
Figure 8.

Model predictions of [Ca2+]-force dynamics in intact cardiac muscle and the effects of tropomyosin-tropomyosin interactions and XBs on twitch activation. (a) Model-predicted twitch force in response to pharmacologically slowed Ca2+ transients digitized from Dobrunz et al. (23) in 3.0, 4.5, and 6.0 mM [Ca]o solutions (dashed, dash-dotted, and dotted lines, respectively), shown with measured twitches for comparison. (b) Total thin-filament activation (Atot) in response to an idealized Ca2+ transient under normal conditions (solid line), in the absence of Tm-Tm interactions (dashed line), and in the absence of XB binding (dash-dotted line). Parameter set 4 was used.
Tm-Tm coupling and XB-binding synergistically enhance systolic and diastolic twitch function
In response to an idealized Ca2+ transient, loss of Tm-Tm coupling () increased diastolic activation and reduced the time required to reach peak Atot (Fig. 8 b). Removal of XB binding (f ≈ 0) reduced peak activation, shortened the duration of the Atot transient, and shortened time-to-peak Atot (Fig. 8 b). (See Table S3 in the Supporting Material.)
Discussion
The purpose of this work was to examine the role of Tm-Tm structural coupling in cardiac myofilament activation. We created a relatively simple model and an efficient new (to our knowledge) solution method to address this question. The model demonstrates that this single mechanism is capable of producing cooperative activation of force by Ca2+ and Ca2+ sensitivity of ktr. The ability of the model to respond appropriately to simulations of added NEM-S1, added [Pi], XB inhibition, and interruption of Tm-Tm interactions (in mini thin filaments) supports the idea of a central role for Tm overlap in cardiac myofilament function. At the same time, certain discrepancies between modeled and measured responses suggest that there are other important cooperative mechanisms at work that were not represented in the model.
Hofman and Fuchs (4) reported that the amount of Ca2+ bound to the myofilaments is lowered by inhibiting force with vanadate. They postulated that XBs feed back cooperatively on Ca2+ binding, in turn recruiting additional XB attachment. This basic hypothesis motivated a number of models that rely on feedback to achieve cooperative activation (9,10,15). Here, we reproduced the observed effects of XBs on Ca2+ binding without any direct interaction between Ca2+ and force or Ca2+ and XBs in the model (compare our Fig. 8 b with Fig. 5 of Hofmann and Fuchs (4)).
Studies of TnC conformation in contracting cardiac muscle as a function of Ca2+ concentration show an interval of positive probe angle change that appears to correspond to the rise of myofilament force (12,25). Both studies found that this phase persisted even in the presence of XB inhibitors, an effect reproduced by the model (Fig. 5 a). Sun and co-workers (25) concluded that most of the cooperativity observed in the force-pCa relation can be accounted for by cooperativity intrinsic to the thin filament, without need of strongly bound XBs. Mini thin filament results (Fig. 3) demonstrate that at least part of that intrinsic thin-filament cooperativity is due to Tm-Tm interactions.
In the model, ktr was nearly proportional to the fraction of steady-state activation attributed to Ca2+ binding to TnC (Fig. 7 f; also see the Supporting Material). This does not mean that the ktr-pCa relation is determined solely by Ca2+-binding properties of TnC, because ACa is influenced by both Tm- and XB-related properties, most sensitively at intermediate pCa (∼6.0; see Fig. 7). However, as Ca2+ reaches higher concentrations, it alone is nearly sufficient to activate the thin filament, causing ACa (and, hence, relative ktr) to be essentially independent of myosin activity. This is consistent with the observation that myosin regulatory light-chain phosphorylation in skinned rat myocardium increased the Ca2+ sensitivity of steady-state force without altering the ktr-pCa relation (28).
Model results further suggest that a common mechanism underlies Ca2+ dependencies of Fss, ktr, and Fresid. The model reproduced our measured changes of all three quantities under added Pi when we changed two parameters (g and δrs), both of which should be [Pi] sensitive. This result suggests a simple correspondence between model parameters and the effects of XBs on myofilament activation.
After showing that the same model can be used to reproduce experimental observations in both skinned and intact preparations, we used it to illustrate the unique contributions of Tm-Tm coupling and XB-based thin-filament activation to myocardial twitch dynamics (Fig. 8). Their combined effects appear to be 1), to delay the development of peak tension; 2), to increase peak activation; and 3), to prolong twitch duration (Fig. 8 b). The overall result is a temporal decoupling of the Ca2+ transient time course from twitch dynamics, allowing force to develop at a much slower rate than Ca2+ release and Ca2+ reuptake to be slower than force relaxation.
Tm-Tm coupling also acts independently to inhibit development of tension at diastolic [Ca2+]. It is within this context that the distinction between cooperative activation only (i.e., via positive feedback (9,10)) and combined cooperative inhibition/activation may be important. Our model suggests that any change that lessens the strength of Tm-Tm coupling could raise diastolic tension owing to loss of cooperative inhibition at those Ca2+ levels (Fig. 8). The phenotype of extreme diastolic dysfunction observed in transgenic mice expressing the FHC-causing E180G Tm mutation (29) can be explained, at least in part, by this mechanism. It is interesting that a common feature among various perturbations to Tm in cardiac muscle is altered contractile dynamics (29,30), considering that kinetic transitions between Tm states are generally thought to be rapid relative to other events (21). This model illustrates the effects Tm-Tm coupling can have on twitch dynamics and may be relevant to these unexplained findings.
The ODE implementation of the model reproduced brute-force simulations with high accuracy and a nearly 10,000-fold speedup in time-course simulations (see comparison in the Supporting Material). It thereby achieves efficiency without producing the complications observed in some mean-field models, such as hysteresis in the force-pCa relation and other nonphysiological properties (8,11). For example, the model of Razumova et al. (31) suggested that RU-RU interaction produces steady-state force-pCa curves with the property n1 < n2, which they saw as characteristic of this type of cooperativity. Meanwhile, models that employ this same mechanism but with explicit representation of each RU (including the model presented here) actually give the opposite asymmetry, showing that RU-RU cooperativity leads to the physiological n1 < n2 (8,16).
Some have suggested that nearest-neighbor interactions are not of primary importance in cooperativity of the cardiac myofilaments. Gillis et al. (24) reasoned that 50% replacement of functioning TnC with xTnC would isolate the remaining functional RUs and abolish cooperative effects due to nearest-neighbor interactions, if present. When no change in nH of the force-pCa relation and continued dependence of ktr on Ca2+ were observed under these conditions, they concluded that these properties could not be explained by nearest-neighbor interactions. In the model, some cooperativity and Ca2+ dependence of ktr was retained at 50% xTnC content. This behavior was due to the fact that randomly distributed xTnC in the filaments placed only 27% of functional TnC in an isolated configuration (both neighbors containing xTnC). The remainder were arranged in functional islands two RUs and greater in size that interacted to produce cooperative behavior similar to that seen in normal conditions. These results illustrate a plausible means by which Tm-Tm interactions could contribute to the measured phenomena.
Model limitations and additional forms of cooperativity
The aspects of the nonfunctional TnC experiments that were poorly reproduced by the model may be informative in that they suggest the presence of additional mechanisms of cooperativity not depicted here. The same can be said of the systematic overestimation of ktr at low activation (e.g., Fig. 2, row 1). We have considered the thin filament at the resolution of individual RUs, whereas more detailed models have considered regulation of each actin binding site (16,32), and ascribed cooperative behavior of the thin filament to interactions at that scale. One of these, the model of Smith and Geeves (16), is based on the widely accepted idea that adjacent Tm molecules behave more like a continuous flexible chain than rigid, interacting units. Certain behaviors produced by their model, including asymmetry in the force-pCa curve and XB-dependent thin-filament Ca2+ binding, are also produced by the model we present here. Still, this approach limits the description of Tm position to a single, generalized point every seventh actin monomer and cannot be used to examine the contributions of intra-RU cooperative events in a direct way.
An additional limitation of the model is that it applies only to isometric conditions, specifically to a sarcomere length at which thick and thin filaments are fully overlapping. The current approach also neglects the effects of filament compliance, which is thought to enhance the overall number of attached XBs (33). In the context of strong Tm-Tm coupling, which potentiates the activating effects of XBs (Fig. 7), this may take on added significance. Future work integrating the two mechanisms is therefore likely to be worthwhile.
Supporting Material
Details of model construction, description of simulation protocols, additional results, 11 figures, 24 tables, and references are available at http://www.biophysj.org/biophysj/supplemental/S0006-3495(10)00261-4.
Supporting Material
Acknowledgments
The authors acknowledge one reviewer for suggesting an energetic interpretation of cooperative coefficients used in formulation of the model.
This study was supported by an American Heart Association predoctoral fellowship (to S.G.C.), the National Biomedical Computation Resource (National Institutes of Health grant P41 RR08605, to A.D.M), and the National Science Foundation (grant BES-0506252 to A.D.M) and the National Heart, Lung and Blood Institute (grant 1 R01 HL096544 to A.D.M.). This investigation was conducted in part using a facility constructed with support from Research Facilities Improvement Program grant C06 RR-017588-01 from the National Center for Research Resources, National Institutes of Health.
References
- 1.Tardiff J.C. Sarcomeric proteins and familial hypertrophic cardiomyopathy: linking mutations in structural proteins to complex cardiovascular phenotypes. Heart Fail. Rev. 2005;10:237–248. doi: 10.1007/s10741-005-5253-5. [DOI] [PubMed] [Google Scholar]
- 2.Landstrom A.P., Parvatiyar M.S., Ackerman M.J. Molecular and functional characterization of novel hypertrophic cardiomyopathy susceptibility mutations in TNNC1-encoded troponin C. J. Mol. Cell. Cardiol. 2008;45:281–288. doi: 10.1016/j.yjmcc.2008.05.003. [DOI] [PMC free article] [PubMed] [Google Scholar]
- 3.Gordon A.M., Homsher E., Regnier M. Regulation of contraction in striated muscle. Physiol. Rev. 2000;80:853–924. doi: 10.1152/physrev.2000.80.2.853. [DOI] [PubMed] [Google Scholar]
- 4.Hofmann P.A., Fuchs F. Evidence for a force-dependent component of calcium binding to cardiac troponin C. Am. J. Physiol. 1987;253:C541–C546. doi: 10.1152/ajpcell.1987.253.4.C541. [DOI] [PubMed] [Google Scholar]
- 5.Fitzsimons D.P., Patel J.R., Moss R.L. Cross-bridge interaction kinetics in rat myocardium are accelerated by strong binding of myosin to the thin filament. J. Physiol. 2001;530:263–272. doi: 10.1111/j.1469-7793.2001.0263l.x. [DOI] [PMC free article] [PubMed] [Google Scholar]
- 6.McLachlan A.D., Stewart M. Tropomyosin coiled-coil interactions: evidence for an unstaggered structure. J. Mol. Biol. 1975;98:293–304. doi: 10.1016/s0022-2836(75)80119-7. [DOI] [PubMed] [Google Scholar]
- 7.Pan B.S., Gordon A.M., Luo Z.X. Removal of tropomyosin overlap modifies cooperative binding of myosin S-1 to reconstituted thin filaments of rabbit striated muscle. J. Biol. Chem. 1989;264:8495–8498. [PubMed] [Google Scholar]
- 8.Rice J.J., de Tombe P.P. Approaches to modeling crossbridges and calcium-dependent activation in cardiac muscle. Prog. Biophys. Mol. Biol. 2004;85:179–195. doi: 10.1016/j.pbiomolbio.2004.01.011. [DOI] [PubMed] [Google Scholar]
- 9.Landesberg A., Sideman S. Mechanical regulation of cardiac muscle by coupling calcium kinetics with cross-bridge cycling: A dynamic model. Am. J. Physiol. Heart Circ. Physiol. 1994;267:779–795. doi: 10.1152/ajpheart.1994.267.2.H779. [DOI] [PubMed] [Google Scholar]
- 10.Campbell K. Rate constant of muscle force redevelopment reflects cooperative activation as well as cross-bridge kinetics. Biophys. J. 1997;72:254–262. doi: 10.1016/S0006-3495(97)78664-8. [DOI] [PMC free article] [PubMed] [Google Scholar]
- 11.Rice J.J., Tu Y., De Tombe P.P. Spatially-compressed cardiac myofilament models generate hysteresis that is not found in real muscle. Pac. Symp. Biocomput. 2008;13:366–377. [PubMed] [Google Scholar]
- 12.Bell M.G., Lankford E.B., Barsotti R.J. Kinetics of cardiac thin-filament activation probed by fluorescence polarization of rhodamine-labeled troponin C in skinned guinea pig trabeculae. Biophys. J. 2006;90:531–543. doi: 10.1529/biophysj.105.072769. [DOI] [PMC free article] [PubMed] [Google Scholar]
- 13.Vibert P., Craig R., Lehman W. Steric-model for activation of muscle thin filaments. J. Mol. Biol. 1997;266:8–14. doi: 10.1006/jmbi.1996.0800. [DOI] [PubMed] [Google Scholar]
- 14.McKillop D.F., Geeves M.A. Regulation of the interaction between actin and myosin subfragment 1: evidence for three states of the thin filament. Biophys. J. 1993;65:693–701. doi: 10.1016/S0006-3495(93)81110-X. [DOI] [PMC free article] [PubMed] [Google Scholar]
- 15.Robinson J.M., Wang Y., Cheung H.C. Activation of striated muscle: nearest-neighbor regulatory-unit and cross-bridge influence on myofilament kinetics. J. Mol. Biol. 2002;322:1065–1088. doi: 10.1016/s0022-2836(02)00855-0. [DOI] [PubMed] [Google Scholar]
- 16.Smith D.A., Geeves M.A. Cooperative regulation of myosin-actin interactions by a continuous flexible chain II: actin-tropomyosin-troponin and regulation by calcium. Biophys. J. 2003;84:3168–3180. doi: 10.1016/S0006-3495(03)70041-1. [DOI] [PMC free article] [PubMed] [Google Scholar]
- 17.Tregear R.T., Reedy M.C., Reedy M.K. Cross-bridge number, position, and angle in target zones of cryofixed isometrically active insect flight muscle. Biophys. J. 2004;86:3009–3019. doi: 10.1016/S0006-3495(04)74350-7. [DOI] [PMC free article] [PubMed] [Google Scholar]
- 18.Brenner B. Effect of Ca2+ on cross-bridge turnover kinetics in skinned single rabbit psoas fibers: implications for regulation of muscle contraction. Proc. Natl. Acad. Sci. USA. 1988;85:3265–3269. doi: 10.1073/pnas.85.9.3265. [DOI] [PMC free article] [PubMed] [Google Scholar]
- 19.Hill T.L., Eisenberg E., Greene L. Theoretical model for the cooperative equilibrium binding of myosin subfragment 1 to the actin-troponin-tropomyosin complex. Proc. Natl. Acad. Sci. USA. 1980;77:3186–3190. doi: 10.1073/pnas.77.6.3186. [DOI] [PMC free article] [PubMed] [Google Scholar]
- 20.Dong W.J., Jayasundar J.J., Cheung H.C. Effects of PKA phosphorylation of cardiac troponin I and strong crossbridge on conformational transitions of the N-domain of cardiac troponin C in regulated thin filaments. Biochemistry. 2007;46:9752–9761. doi: 10.1021/bi700574n. [DOI] [PMC free article] [PubMed] [Google Scholar]
- 21.Geeves M.A., Lehrer S.S. Dynamics of the muscle thin filament regulatory switch: the size of the cooperative unit. Biophys. J. 1994;67:273–282. doi: 10.1016/S0006-3495(94)80478-3. [DOI] [PMC free article] [PubMed] [Google Scholar]
- 22.Gong H., Hatch V., Tobacman L.S. Mini-thin filaments regulated by troponin-tropomyosin. Proc. Natl. Acad. Sci. USA. 2005;102:656–661. doi: 10.1073/pnas.0407225102. [DOI] [PMC free article] [PubMed] [Google Scholar]
- 23.Dobrunz L.E., Backx P.H., Yue D.T. Steady-state [Ca2+]i-force relationship in intact twitching cardiac muscle: direct evidence for modulation by isoproterenol and EMD 53998. Biophys. J. 1995;69:189–201. doi: 10.1016/S0006-3495(95)79889-7. [DOI] [PMC free article] [PubMed] [Google Scholar]
- 24.Gillis T.E., Martyn D.A., Regnier M. Investigation of thin filament near-neighbour regulatory unit interactions during force development in skinned cardiac and skeletal muscle. J. Physiol. 2007;580:561–576. doi: 10.1113/jphysiol.2007.128975. [DOI] [PMC free article] [PubMed] [Google Scholar]
- 25.Sun Y.B., Lou F., Irving M. Calcium- and myosin-dependent changes in troponin structure during activation of heart muscle. J. Physiol. 2009;587:155–163. doi: 10.1113/jphysiol.2008.164707. [DOI] [PMC free article] [PubMed] [Google Scholar]
- 26.Campbell K.S., Holbrook A.M. The rate of tension recovery in cardiac muscle correlates with the relative residual tension prevailing after restretch. Am. J. Physiol. Heart Circ. Physiol. 2007;292:H2020–H2022. doi: 10.1152/ajpheart.00714.2006. [DOI] [PMC free article] [PubMed] [Google Scholar]
- 27.Janssen P.M., de Tombe P.P. Uncontrolled sarcomere shortening increases intracellular Ca2+ transient in rat cardiac trabeculae. Am. J. Physiol. 1997;272:H1892–H1897. doi: 10.1152/ajpheart.1997.272.4.H1892. [DOI] [PubMed] [Google Scholar]
- 28.Olsson M.C., Patel J.R., Moss R.L. Basal myosin light chain phosphorylation is a determinant of Ca2+ sensitivity of force and activation dependence of the kinetics of myocardial force development. Am. J. Physiol. Heart Circ. Physiol. 2004;287:H2712–H2718. doi: 10.1152/ajpheart.01067.2003. [DOI] [PubMed] [Google Scholar]
- 29.Prabhakar R., Boivin G.P., Wieczorek D.F. A familial hypertrophic cardiomyopathy α-tropomyosin mutation causes severe cardiac hypertrophy and death in mice. J. Mol. Cell. Cardiol. 2001;33:1815–1828. doi: 10.1006/jmcc.2001.1445. [DOI] [PubMed] [Google Scholar]
- 30.Jagatheesan G., Rajan S., Wieczorek D.F. Functional importance of the carboxyl-terminal region of striated muscle tropomyosin. J. Biol. Chem. 2003;278:23204–23211. doi: 10.1074/jbc.M303073200. [DOI] [PubMed] [Google Scholar]
- 31.Razumova M.V., Bukatina A.E., Campbell K.B. Different myofilament nearest-neighbor interactions have distinctive effects on contractile behavior. Biophys. J. 2000;78:3120–3137. doi: 10.1016/S0006-3495(00)76849-4. [DOI] [PMC free article] [PubMed] [Google Scholar]
- 32.Tobacman L.S., Butters C.A. A new model of cooperative myosin-thin filament binding. J. Biol. Chem. 2000;275:27587–27593. doi: 10.1074/jbc.M003648200. [DOI] [PubMed] [Google Scholar]
- 33.Tanner B.C.W., Daniel T.L., Regnier M. Sarcomere lattice geometry influences cooperative myosin binding in muscle. PLOS Comput. Biol. 2007;3:e115. doi: 10.1371/journal.pcbi.0030115. [DOI] [PMC free article] [PubMed] [Google Scholar]
Associated Data
This section collects any data citations, data availability statements, or supplementary materials included in this article.