

Abstract
Short-term pharmacological melanocortin activation deters diet-induced obesity (DIO) effectively in rodents. However, whether central pro-opiomelanocortin (POMC) gene transfer targeted to the hypothalamus or hindbrain nucleus of the solitary track (NTS) can combat chronic dietary obesity has not been investigated. Four-week-old Sprague Dawley rats were fed a high fat diet for five months, and then injected with either the POMC or control vector into the hypothalamus or NTS, and body weight and food intake recorded for 68 days. Insulin sensitivity, glucose metabolism and adrenal indicators of central sympathetic activation were measured, and voluntary wheel running (WR) assessed. Whereas the NTS POMC-treatment decreased cumulative food consumption and caused sustained weight reduction over 68 days, the hypothalamic POMC-treatment did not alter cumulative food intake and produced weight loss only in the first 25 days. At death, only the NTS-POMC rats had a significant decrease in fat mass. They also displayed enhanced glucose tolerance, lowered fasting insulin and increased QUICK value, and elevated adrenal indicators of central sympathetic activation. Moreover, the NTS-POMC animals exhibited a near 20% increase in distance ran relative to the respective controls, but the ARC-POMC rats did not. In conclusion, POMC gene transfer to the NTS caused modest anorexia, persistent weight loss, improved insulin sensitivity, and increased propensity for WR in DIO rats. These metabolic improvements may involve stimulation of energy expenditure via centrally regulated sympathetic outflow. The similar POMC treatment in the hypothalamus had minimal long-term physiological or metabolic impact. Thus, melanocortin activation in the brainstem NTS region effectively ameliorates chronic dietary obesity whilst that in the hypothalamus fails to do so.
Keywords: ARC, NTS, dietary obesity, voluntary wheel running, melanocortin
Introduction
The brain melanocortin (MC) system has critical functions in the homeostatic regulation of body weight (Benoit et al., 2000, Ellacott and Cone, 2004). Pro-opiomelanocortin (POMC) is the precursor for alpha-melanocyte-stimulating hormone (α-MSH), the principal central melanocortin (Benoit et al., 2000, Ellacott and Cone, 2004). Rodents and humans with POMC deficiency or mutations are hyperphagic and obese (Krude et al., 1998, Yaswen et al., 1999). Alpha-MSH or its analog, melanotan II (MTII) inhibits food intake and enhances energy expenditure via activation of the two central MC receptors, MC3R and MC4R (Abdel-Malek, 2001, Cone, 2005). Although the hypothalamic MC system in the forebrain has received much attention, the role of the POMC network in energy homeostasis in the hindbrain has only been appreciated recently. In addition to the arcuate nucleus (ARC) of the hypothalamus, POMC and α-MSH are also found within the commissural region of the nucleus of the solitary tract (NTS) in the brainstem (Joseph et al., 1983, Palkovits et al., 1987) where the MC4R is also abundant (Mountjoy et al., 1994, Kishi et al., 2003). Both the MC agonist, MTII, and antagonist, SHU9119, evoke dose-dependent decreases or increases, respectively, in feeding and body weight upon either lateral or fourth intracerebroventricular (icv) administration, and the responses induced by hindbrain stimulation are as robust as those in the forebrain (Grill et al., 1998, Williams et al., 2000, Zheng et al., 2005). Since hypothalamic POMC neurons send direct projections to the NTS (Palkovits et al., 1987, Zheng et al., 2005), the NTS could serve as a site integrating the neuroendocrine and metabolic impact of POMC that is generated both within the NTS and the ARC.
Pharmacological activation of the central MC system is highly effective in reducing food intake and body weight in either lean or obese rodents including those of genetic and dietary origins (Hansen et al., 2001, Hwa et al., 2001, Scarpace et al., 2003, Ellacott and Cone, 2004, Li et al., 2004, Zhang et al., 2004). A transgenic mice model over-expressing the N-terminal POMC transgene also deters the development of dietary obesity (Savontaus et al., 2004, Lee M, 2007). However, both of these approaches would presumably evoke simultaneous MC activation in the forebrain hypothalamus and hindbrain NTS, and therefore, cannot dissect contributions from the individual brain regions to the metabolic outcomes. Our group has employed recombinant adeno-associated virus-mediated central POMC gene transfer (rAAV-POMC) to ameliorate pre-existing obesity of either genetic or dietary causes (Li et al., 2003, Li et al., 2005, Li et al., 2007). On a low fat chow diet, rAAV-POMC transfer to the ARC alone in adult-onset obese F344xBN rats resulted in a transient anorexia as opposed to a more persistent food reduction induced by rAAV-POMC transfer to the NTS (Li et al., 2003, Li et al., 2005, Li et al., 2007). On the other hand, the effectiveness of chronic central melanocortinergic activation on weight regulation has not been evaluated in animals with established DIO and continued maintenance on the high fat (HF) diet. In particular, the separate activation of either the ARC or NTS by site-directed over-expression of POMC on the long-term metabolic consequences has not been examined.
In addition to affecting energy intake, melanocortins also impact physical activity. For example, elevated AgRP is one factor that can suppress physical activity (Tang-Christensen et al., 2004). The present study, thus, also aims to determine the potential role of POMC gene transfer in the ARC or NTS in enhancing physical activity, as assessed by voluntary WR.
To these ends, we employed dietary obese Sprague Dawley rats pre-treated with a 32% high fat diet for 5 months and delivered rAAV-POMC via microinjection to either the ARC or NTS. Food consumption, body weight, glucose and fat metabolism, adrenal sympathetic factors as well as the propensity for voluntary wheel running were assessed following 68 days of treatment.
Experimental Methods
Experimental animals
Five-month-old male Sprague Dawley rats were obtained from Charles River. The rats were fed a 32% HF diet (32% of the energy is provided from fat, 4.41 Kcal/g, RD12266B; Research Diets, New Brunswick, NJ) by the supplier from 4-week of age (HF-raised), and continued on the same HF diet throughout the study. Upon arrival, rats were examined and remained in quarantine for one week. Animals were cared for in accordance with the principles of the NIH Guide to the Care and Use of Experimental Animals and the protocols approved by the Malcom Randall Veterans Affairs Medical Center IACUC committee. Rats were housed individually with a 12:12 h light:dark cycle (07:00 to 19:00 hr).
Preparation and administration of rAAV-POMC
pTR-POMC encodes the full-length 935 base pair murine POMC cDNA (Uhler and Herbert, 1983) under the control of the hybrid cytomegalovirus immediate early enhancer/chicken β-actin promoter, and construction of this vector, designated as rAAV-POMC was described previously (Li et al., 2003). The control vector, rAAV-Control, is similar to rAAV-POMC except for the incorporation of the cDNA encoding an enhanced form of green fluorescent protein (GFP) in place of the POMC. Both vectors were packaged as Serotype 5 AAV, then purified, concentrated and tittered (Li et al., 2003). The titers for both vectors used in this study were 2.51×10¹³ physical particles/ml.
Rats, under isoflurane anaesthesia (5% induction, 2–2.5% for maintenance), were administered rAAV-POMC or rAAV-Control. Viral particles (containing 2.51×10¹⁰ in 1μl) were introduced into the NTS or basomedial hypothalamus by separate injections using coordinates established previously (Li et al., 2005, Li et al., 2007). A 10μl-capacity Hamilton syringe was used to deliver 1 μl virus over 5 min to the target site. The needle remained in place at the injection site for a further 2 min before withdrawal. The analgesic, Buprenex (buprenorphine hydrochloride, 0.05 mg/kg; Reckitt and Colman, Richmond, VA), was provided to the animals before the surgery and 8–12hrs afterwards.
Histological analysis of GFP over-expression
Separate rats receiving rAAV-GFP injection to either the ARC or NTS were used for histological verification of GFP expression. The distribution of GFP immunofluorescence is used here as a marker for potential POMC transgene over-expression pattern. The rats were overdosed with sodium pentobarbital (100 mg/kg i.p.) one month after rAAV-GFP gene delivery (a duration of time to allow GFP protein expression to accumulate to maximal), and perfused at 65 ml/min through the left ventricle with 100 ml 0.1 M phosphate-buffered saline (PBS) pH 7.2–7.4 at ambient temperature, followed by 400 ml PBS containing 10% formalin. The intact rat bodies were refrigerated for 2 hours at 4°C prior to brain extraction and equilibrated in 30% sucrose PBS cryoprotectant. Following excising the whole brain, coronal blocks were frozen-sectioned at 50 um, and sections collected in 300 ul PBS/well in 24-well polystyrene culture plates (Phoenix). Plates were incubated overnight on a rotating shaker in 200 ul/well PBS plus 0.02% sodium azide, 0.1% Triton X-100, and 1 ug/ml primary antibody recognizing GFP (Clontech). Following two 300 ul PBS washes, sections were incubated overnight in biotinylated goat anti-rabbit IgG 1:1000, washed again, and incubated overnight in extravidin peroxidase at 1:1000 in PBS. After two additional washes, sections were reacted 5 min in 0.5 mg/ml diaminobenzidine in 0.1 M sodium acetate with 1.2 to 5% hydrogen peroxide, then mounted on glass slides from 0.1 M saline and coverslipped with glycerol gelatin. All chemicals were from Sigma unless noted otherwise. Bright-field images were collected using an Olympus BH-2 microscope with an attached Hitachi KP-D581 color digital video camera equipped with ImagePro Plus software (Media Cybernetics).
RT-PCR
Expression levels of POMC in the NTS or ARC micropunch samples were identified by relative quantitative RT-PCR using the QuantumRNA 18S Internal Standards kit (Ambion, Austin, TX, USA). First-strand cDNA was generated from 1.5ug RNA in a 20ul volume using random primers containing 200 units of M-MLV reverse transcriptase (Life Technologies). RT-PCR was performed to co-amplify both sample signals and internal 18S standards by multiplexing specific primers, 18S primers, and competimers. The primer sequences employed for POMC are: sense, 5′-GCTTGCAAACTCGACCTCTC-3′, anti-sense, 5′-CTTGATGATG-GCGTTCTTGA-3′. Linearity for amplicons was determined to be 20–40 PCR cycles for POMC. The PCR products were electrophoresed on acrylamide gel and stained with Ethidium Bromide (Sigma, St. Louis, MO).
Northern analysis of adrenal TH, DβH and NPY mRNA levels
Adrenal glands were removed quickly and immediately frozen by immersion in liquid nitrogen. Tissues were stored at −80°C. At the time of the assay, adrenal glands were decapsulated, and the medullae were separated from the cortex. Adrenal medullae were weighed and homogenized in 100 μl of phosphate buffer (2 mM NaPO4, 0.2% Triton, pH 7.0). TH, DβH and NPY mRNA levels were determined using Northern blot analysis as previously described (Tumer and Larochelle, 1995, Erdem et al., 2002). Briefly, total cellular RNA was extracted using Tri-reagent (Sigma, St. Louis, MO), and the isolated RNA quantified by spectrophotometry. Membranes were hybridized with 32P random primer-generated probes. After hybridization, the membranes were washed and exposed to phospho-screen for 24 hours using Phospho Imager (Molecular Dynamics, Sunnyville, CA). Screens were scanned and analyzed using ImageQuant software (Molecular Dynamics).
Intraperitoneal glucose tolerance test (IPGTT)
IPGTT was performed on days 63 and 65 after vector administration in the NTS and ARC animals, respectively. Rats were fasted overnight and injected intraperitoneally with glucose (2g/kg body weight) at 10:00 h. Tail blood was collected at 0, 15, 30, 60, 120 min after injection. Blood glucose was measured by One Touch SureStep glucometer (LifeScan, Milpitas, CA).
Wheel Running
Rats were housed in cages equipped with Nalgene Activity Wheels (1.081 meters circumference) obtained from Fisher Scientific (Pittsburgh, PA) and allowed free access to the wheel. Each wheel was equipped with a magnetic switch and a counter with liquid crystal display (LCD) that records the number of wheel revolutions. The numbers of revolutions were recorded daily for consecutive 5 days.
Grip Strength
Forelimb grip strength was determined using an automated grip strength meter (Columbus Instruments, Columbus Ohio). The rats were grasped by the base of the tail and suspended above a grip ring. After about 3 sec, the animal was gently lowered toward the grip ring and allowed to grasp the ring with its forepaws. The experimenter then quickly lowered the remainder of the animal’s body to a horizontal position and tugged the animal’s tail until its grasp of the ring was broken. The mean force in grams was determined with a computerized electronic pull strain gauge that was fitted directly to the grasping ring, and the resulting value normalized to body weight. Average measurements from three successful trials were taken as the final outcome. Successful trials are defined as those in which the animal grasped the ring with both forepaws and pulled the ring without jerking (Carter et al., 2004).
Tissue harvesting and preparation
Rats were killed at day 86 under 5% isoflurane anaesthesia. Blood samples were collected by heart puncture, and serum was harvested by a 10-min centrifugation in serum separator tubes. The circulatory system was perfused with 40 ml of cold saline, and hypothalamus, perirenal and retroperitoneal white adipose tissues (PWAT and RTWAT, respectively), brown adipose tissue (BAT), and adrenal were excised. Protein concentrations of the tissue homogenates were determined using the DC protein assay kit (Bio-Rad, Hercules, CA).
Fasting serum insulin, triglyceride and glucose
Radio-immunoassay (RIA) kits from Linco Research were used to measure insulin (rat RIA). Triglyceride (TG) in serum was determined using enzymatic colorimetric kits from Wako Chemicals (Richmond, VA), and fasting glucose by Trinder agent (Sigma Diagnostics).
Statistical analysis
Data are presented as means ± SE. One-way ANOVA with POMC-treatment as the factor was employed for all data analyses except for the paired t-test used to draw comparisons between the Chow and DIO rats for specific parameters listed in Figure 1. When the main effect was significant (p < 0.05), a Bonferroni multiple comparison post-hoc test was applied to determine differences between means of the experimental groups.
Figure 1.

Fasting leptin (a), fasting TGs (b), Grip strength (c) and voluntary wheel running (d) were measured in weight-matched Chow-raised (Chow) and HF-raised (DIO) rats. Data are means ± SE of 8–12 rats per group. DIO rats displayed significantly higher fasting leptin *P < 0.0001, fasting triglycerides *P < 0.0001, lower grip strength *P = 0.0034 and decreased daily wheel running activity *P = 0.0012 compared to weight-matched Chow animals.
Results
Metabolic impairment and physical function decline with high-fat feeding
The DIO rats had an average body weight of 700g after five months of HF feeding beginning at 4-week of age. Compared to a group of weight-matched and standard chow-raised rats, the DIO animals had more than 2-fold higher fasting serum leptin level (Fig 1a) and three times greater fasting serum triglycerides (Fig 1b). In addition, grip strength (Fig 1c) and voluntary wheel running activity (Fig 1d) were significantly decreased in DIO rats relative to their weight-matched, chow-fed counterparts.
POMC over-expression and immunohistological evaluation of GFP expression
The POMC transgene over-expression was verified by RT-PCR using brain micropunch samples. Eighty-six days after vector delivery, the ARC or NTS POMC mRNA levels were elevated in the POMC-treated rats compared with the respective controls (Fig 2E).
Figure 2.

GFP immunoreactivity in coronal sections through nucleus tractus solitarius including medial and ventrolateral portions of the solitary tract (A) and along the 3rd ventricle in the area of the arcuate nucleus of the hypothalamus (C). GFP expression in both regions was exclusively localized to neurons (B, D). POMC mRNA levels were measured 86 after POMC gene delivery by relative quantitative RT-PCR with 18S rRNA as an internal standard. The representatives of POMC over-expression in either the ARC or NTS versus the respective controls (two samples from each group) were shown in E. Whereas rAAV-POMC gene delivery to either the ARC (ARC-POMC) or NTS (NTS-POMC) resulted in apparent elevation in POMC mRNA, only minimal levels of POMC were detectable in the ARC-GFP or NTS-GFP animals.
Because POMC is a precursor neuropeptide that gives rise to an array of bioactive products, it is not feasible to directly evaluate POMC peptide distribution at the brain targeting site(s) via imaging analysis. However, our control vector contains a GFP reporter gene, and GFP immuno-fluorescence can be used to identify cells transfected with rAAV-GFP and GFP expression pattern. This provides a representation of plausible rAAV-mediated POMC cell transduction and distribution of POMC expression. Strong and punctuated GFP immunoreactivity was visible in coronal sections through NTS including medial and ventrolateral areas of the solitary tract (Fig. 2A), and dense GFP staining was observed along the 3rd ventricle of the basomedial posterior hypothalamus, especially in the region of the ARC of the hypothalamic (Fig. 2C). GFP expression in either the NTS or ARC was exclusively localized to neurons (Fig. 2B and 2D). GFP immunoreactivity was minimally seen in the contralateral side of vector delivery of either the NTS or hypothalamus (Fig. 2A and 2C).
Body weight and food consumption
POMC gene transfer into either ARC or NTS initiated body weight reductions that became statistically significant from respective controls by day 4 in the ARC-POMC rats (Fig 3a) and by day 6 in the NTS-POMC rats (Fig 3b). The ARC-Control and NTS-Control animals lost about 10 and 25g of body weight respectively in the first two days following surgery, but the ARC-Control group recovered this lost weight in 4 days (Fig 3a), whereas the NTS-Control group recuperated the weight reduction after 13 days (Fig 3b). The greater weight loss and longer duration for weight recovery with or without changes in food intake in the NTS control animals upon surgical manipulation has been observed in other studies (Li et al., 2005, Li et al., 2007). This phenomenon may be related to the importance of the NTS in the control of cardiovascular and respiratory responses, meal initiation and termination, and central modulation of energy expenditure. The body weight decrease with rAAV-POMC treatment in the ARC was transient, and by day 23, there was no longer a difference relative to controls (Fig 3a). On the contrary, the NTS-POMC rats maintained a lower body weight gain throughout the entire treatment period as compared to the NTS-Control animals (Fig 3b).
Figure 3.

Change in body weight (BW) following rAAV-POMC gene transfer in the ARC (a) or NTS (b). Data are means ± SE of 5–6 rats per group. According to ANOVA followed by post-hoc analysis at the individual time point, the ARC-POMC rats had significantly lower body weight than that of ARC-Control rats only from days 4 through 22 (a), whereas the NTS-POMC rats displayed significantly reduced change in body weight relative to the NTS-Control rats from day 6 until termination (b).
In contrast to the substantial reductions in body weight, decreases in food consumption were less apparent. The POMC treatment in the ARC, in fact, failed to either suppress daily food intake significantly over the entire experimental period (Fig 4a) or the cumulative food intake during the first 24 days or from days 25–56 (Fig 4c). The NTS-POMC rats displayed a decrease in food consumption over the first 24 days (Fig 4b), with cumulative food consumption significantly reduced during this period compared with the NTS-control animals (Fig. 4c). The cumulative food intake from days 25–56 in the NTS-POMC rats had a decreasing trend, but did not reach statistical significance relative to the controls (Fig 4c).
Figure 4.

Daily food intake (FI) following in rAAV-POMC gene transfer in the ARC (a) or NTS (b), and the accumulative FI from days 1–24 and 25–56 for either treatment (c). Data are means ± SE of 5–6 rats per group. The ARC-Control and ARC-POMC rats had similar daily food intake during the entire experimental period (a) whilst the NTS-POMC rats exhibited lower food intake than the NTS-Control rats at certain days during the first 24 days after POMC gene transfer (b). The accumulative FI from days 1–24 was significantly decreased in the NTS-POMC animals versus either the NTS-Control, or ARC-POMC or ARC-Control rats. P = 0.0012 for difference with one-way ANOVA, and *** P < 0.05 by post-hoc analysis (c). The trend of reduction in accumulative FI remained in the NTS-POMC rats from days 25–56 without reaching a statistical significance.
White, brown adipose tissues and serum parameters
Consistent with the body weight data, the individual white fat mass collected at the terminus of the study was not different between the ARC-Control and ARC-POMC animals, whereas the rAAV-POMC transfer to the NTS resulted in a significant loss of tissue mass in all three fat depots examined, including perirenal, retroperitoneal, and epididymal white adipose tissue (PWAT, RTWAT, and EWAT) (Table 1). Serum parameters, in general, paralleled the physiological data: only the NTS-POMC rats displayed lower fasting glucose, fasting insulin and enhanced QUICK value (the Quantitative Insulin Sensitivity Check Index, one indicator of insulin sensitivity) as compared to their respective controls (Table 1). On the other hand, the POMC delivery in either the ARC or NTS reduced serum triglycerides concentrations (Table 1).
Table 1.
Adiposity and serum parameters.
| Treatment | ||||
|---|---|---|---|---|
| ARC-Control | ARC-POMC | NTS-Control | NTS-POMC | |
| PWAT (g) | 4.4 ± 0.3 | 4.7 ± 0.5 | 4.8 ± 0.6 | 3.4 ± 0.3a,b |
| RTWAT (g) | 29.2 ± 2.3 | 28.1 ± 1.8 | 32.8 ± 3.4 | 21.8 ± 1.6a,b |
| EWAT (g) | 18.1 ± 1.0 | 18.5 ± 1.4 | 17.3 ± 1.8 | 13.9 ± 0.7b |
| Fasting Glucose (mg/dL) | 87.4 ± 5.2 | 77.6 ± 3.0 | 86.8 ± 3.3 | 73.0 ± 2.8a |
| Fasting Insulin (ng/ml) | 0.62 ± 0.06 | 0.65 ± 0.06 | 0.66 ± 0.13 | 0.36 ± 0.06a,b |
| QUICK | 0.58 ± 0.02 | 0.59 ± 0.02 | 0.55 ± 0.01 | 0.73 ± 0.04a,b |
| Fasting Triglycerides (mg/dL) | 412.2 ± 27.6 | 256.6 ± 39.9c | 435.4 ± 84.5 | 239.4 ± 17.6a,b |
Data are means ± SE of 5–6 rats per group. One-way ANOVA analysis yielded significant p value for each of the seven parameters listed in Table 1. By post-hoc analysis,
p < 0.05 or 0.01 for difference between NTS-POMC vs. NTS-Control;
p < 0.05 or 0.01 for difference between ARC-POMC vs. NTS-POMC;
p < 0.05 for ARC-POMC vs. ARC-Control.
Neither the POMC treatment in the ARC nor in the NTS resulted in any change in either the total brown fat mass or the uncoupling protein (UCP1) level (data not shown).
Glucose tolerance test
In addition to assessing fasting glucose and insulin values, we conducted a glucose tolerance test at day 63 to probe for a potential improvement in insulin sensitivity mediated by the POMC treatment. The POMC transfer into the NTS produced a significant increase in glucose tolerance following a 2g/kg glucose loading compared to NTS-Control rats (expressed as area under the curve, 1269.6 + 64.9 for NTS-Control versus 958.2 + 88.1 for NTS-POMC, Fig 5), while it was without effect in the ARC POMC-treated animals (data not shown).
Figure 5.
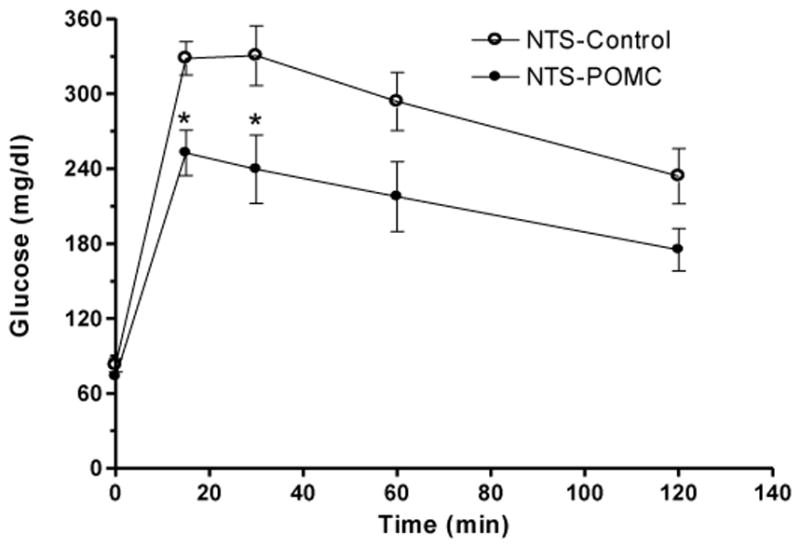
Levels of blood glucose following intraperitoneal administration of glucose (2 g/kg body weight) on day 63 after rAAV-POMC transfer to the NTS. Data are means ± SE of 5–6 rats per group. *P < 0.05 for difference in blood glucose in the NTS-POMC vs NTS-Control rats by unpaired t-test following repeated measures ANOVA.
Wheel running
Physical activity constitutes one aspect of energy expenditure. One measure of volitional physical activity is voluntary wheel running. On day 45 (for the NTS group) and day 57 (for the ARC group) following POMC gene transfer, the home cages were equipped with running wheels and voluntary WR assessed for five consecutive days. During this time, the rats had access to food, ad libitium. The animals were not coerced in any way to run but had been subjected to a five-day WR assessment prior to rAAV-POMC gene therapy (Fig 1d, DIO). The ARC- and NTS-Controls ran to the same extent, and the POMC-treatment in the ARC did not impact WR activity. However, the NTS-POMC rats had a modest but significant 18% increase in the distance ran (Fig 6). The majority of the voluntary WR occurred at night (data not shown).
Figure 6.

Daily voluntary wheel running over a consecutive five-day period commencing at day 45 for POMC transfer to the NTS or day 57 to the ARC. Data are means ± SE of 5–6 rats per group. P = 0.0003 for difference by one-way ANOVA. *** P < 0.05 for difference between the NTS-POMC rats relative to NTS-Control, ARC-Control or ARC-POMC animals, respectively, by post-hoc analysis.
NPY, DBH and TH expression in adrenal
Central pharmacological melanocortin activation has been reported to increase sympathetic activity (Nogueiras et al., 2007). Therefore, we examined whether rAAV-POMC gene transfer into either the ARC or NTS stimulates the Hypothalamic-Pituitary-Adrenal axis, leading to an increase in catecholamine biosynthesis in the adrenal medulla. We measured three factors in adrenal medulla that are indicators for catecholamine biosynthesis, tyrosine hydroxylase, dopamine-β-hydroxylase, and neuropeptide Y mRNAs. Basal levels of TH, DBH and NPY mRNAs were similar in both ARC- and NTS-Control animals and were unchanged following POMC treatment in the ARC. In contrast, POMC gene transfer in the NTS significantly elevated all three indicators of catecholamine biosynthesis (Fig 7).
Figure 7.
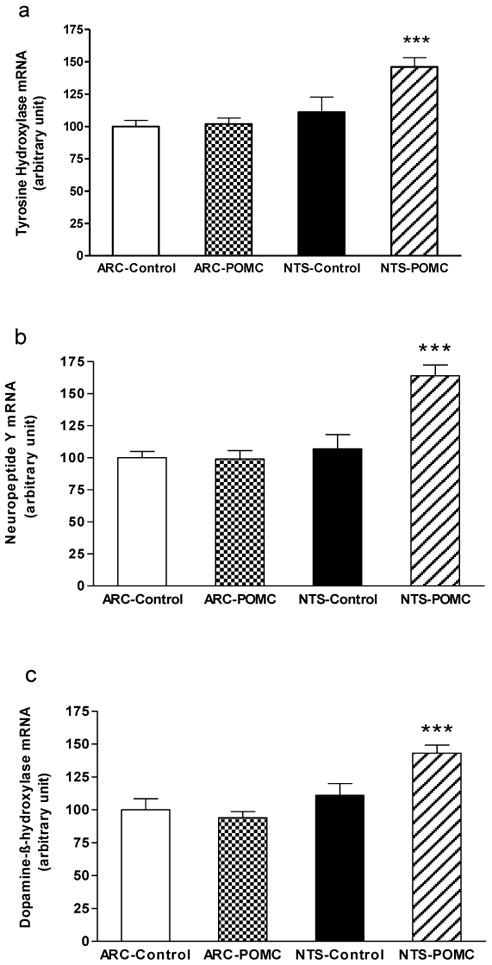
Adrenal tyrosine hydroxylase (a), neuropeptide Y (b) and dopamine-β-hydroxylase (c) mRNAs levels. Data are means ± SE of 5–6 rats per group. POMC gene transfer in the NTS significantly elevated all three indicators of catecholamine biosynthesis relative to NTS-Control, ARC-Control and ARC-POMC rats, respectively (*** P < 0.05), by one-way ANOVA and post-hoc analysis.
Discussion
HF-diet induced obese rodents represent a useful animal model to understand and investigate human dietary obesity resultant from an abundant supply of caloric dense, palatable foods. Chronic consumption of such HF diets not only creates dire metabolic consequences but also may adversely impact physical activity due to dietary weight gain. This aspect is demonstrated clearly in the present study, where wheel-running activity employed as one measure of physical activity, is diminished in dietary obese rats compared with standard chow-fed rats. In addition, the obese rats display impairment in muscle function manifested as decreased forelimb grip strength. It is uncertain currently if weakened muscle contributes to the decrease in WR activity in these animals. But in humans, obesity is a major contributor to disability; older persons with obesity spend two-times more years disabled than normal weight counterparts (Reynolds et al., 2005).
Combating DIO is a long-standing challenge. Typical leptin therapy has proven futile in obese humans and animals demonstrating both leptin and insulin resistance (Widdowson et al., 1997, Heymsfield et al., 1999, Levin and Dunn-Meynell, 2002). The central MC system, however, has emerged as an attractive therapy target for treating dietary obesity because melanocortin agonists evoke impressive weight loss and insulin sensitisation in obese rodents (Hansen et al., 2001, Li et al., 2004, Zhang et al., 2004). Mounting evidence underscores the fact that the MC systems in both the ARC of hypothalamus and NTS are important regulators of energy intake and expenditure (Grill et al., 1998, Ellacott and Cone, 2004, Zheng et al., 2005). Prominent POMC and AgRP neurons in the ARC project to other hypothalamic areas, and from there to the NTS and other places in the brainstem where the descending hypothalamic inputs are integrated with peripheral afferent inputs from the liver and gastrointestinal tract (Ellacott and Cone, 2004). The caudal brainstem can carry out autonomic control of ingestion, digestion, and absorption of food separate from the forebrain influence (Gao and Horvath, 2008). Normal ingestive behaviour and energy balance cannot occur without the circuits of the brainstem (Gao and Horvath, 2008). Thus, to fully understand the critical functions of the central MC system in weight regulation, it is necessary to examine the contributions from the hypothalamus and brainstem separately.
We established, in this study, that the neuro-site directed rAAV-POMC gene transfer to either the NTS or ARC resulted in POMC over-expression in a reasonably region-specific manner in the obese rats. The POMC treatment in the NTS produced a mild and transient anorexia (for the first 24 days) whereas that in the ARC only generated a trend for reduction without affecting the cumulative food intake. The ARC-POMC rats displayed a lower body weight gain versus the respective controls up to day 24 post the POMC vector delivery, but their body weights merged with those of controls afterwards, matching the transient, 24-day food suppressive effect. The end-point adiposity levels and several serum parameters indicated no overall metabolic improvements after the duration of the POMC gene therapy in the ARC. In contrast, rAAV-POMC delivered to the NTS resulted in a weight reduction that was unabated throughout the entire experimental period despite the attenuation of the anorectic response after the initial 24 days. Additionally, POMC NTS treatment also decreased fat mass and enhanced glucose metabolism and insulin sensitivity.
Because the current study was long-term in nature and attenuation of the POMC anorectic effect (for treatment in either the ARC or NTS) occurred during the early phase of the experiment, we did not measure some important peptides/hormones involved in energy intake regulation such as NPY, ghrelin and cholecystokinin (CCK) at termination. Both ARC (with its location near the median eminence) and NTS (as recipient for afferent vagal neuron projections from the gastrointestinal track) are sites for integration of neuronal and circulating signals pertaining to energy status, and gut hormones such as ghrelin and CCK can act on either region to affect food ingestion (Ellacott and Cone, 2004). It would be interesting to investigate, if the hypophagic response to the POMC transfer in the first 10 to 20 days or so involved these gut factors; and further, if the persistent weight reduction in the NTS-POMC rats caused any changes in circulating ghrelin concentration and/or its or perhaps CCK receptor levels in the CNS or gut.
There are two apparent implications from the current study. The experiment was conducted in rats with established dietary obesity, and the HF feeding regimen continued throughout the treatment period. Under these conditions, the POMC gene intervention was effective in ameliorating DIO and improving metabolism only when performed in the NTS as opposed to in the ARC. On the contrary, rats fed a standard chow diet for lifetime and possessing age-related obesity responded to the POMC gene therapy either in the ARC or NTS with comparable and sustained weight reduction and metabolic improvements (Li et al., 2005, Li et al., 2007). It may be reasonable to speculate that both the ARC and NTS are important brain sites for regulating caloric need (chow consumption), whereas the role of the ARC in hedonic feeding such as HF consumption could be limited compared to that of the NTS.
The second implication stems from the observation that the POMC treatment in the NTS resulted in a persistent weight reduction despite an attenuated anorexic response over time. This finding suggests stimulated energy expenditure contributes separately to weight regulation beyond the POMC effect on food consumption. Voluntary wheel running is one form of physical activity in the overall energy expenditure equation. Many factors can affect WR activity, including motivational, exploratory, muscular, age, and body size components (Skibicka and Grill, 2008). We used short-term WR activity over five consecutive days as an assessment for physical activity. Whereas rAAV-POMC in the ARC did not alter WR activity, rAAV-POMC in the NTS increased WR by a moderate 18%. Despite the modesty, the small daily increase in physical activity could have a cumulative long-term impact on weight maintenance, as implicated by the sustained weight loss in the NTS-POMC animals. This increase in physical activity is particularly meaningful considering that dietary obese animals have already impaired WR activity relative to their non-obese chow-fed counterparts (the former only run half as much as the latter on a daily base). The POMC transfer to either the ARC or NTS did not affect brown fat tissue mass or UCP1 protein level, suggesting BAT thermogenesis is not a factor mediating POMC effect in the NTS. Because other assessments of energy expenditure were not preformed, we cannot be certain that the increase in physical activity in the form of WR accounts for all the presumed elevation in energy expenditure with the NTS-POMC treatment.
Our data suggest that the mildly increased WR activity in the NTS-POMC rats might be related to central control of sympathetic outflow. Caudal brainstem MC receptor stimulation is known to trigger energetic responses via local sympathetic effector circuits (Skibicka and Grill, 2008). The increase in mRNA levels of the three adrenal factors assessed in response to the POMC NTS treatment indicates an augmented, brainstem-mediated sympathetic activity, and is in support of a possible connection between this increase and enhanced WR activity.
Improvement in insulin sensitivity induced by the NTS POMC-treatment may be another mechanism to deter fat deposition and weight gain besides augmented physical activity. Both the fasting glucose and insulin levels were substantially diminished in the NTS-POMC rats, and the QUICK value (Katz et al., 2000) indicated improved insulin sensitivity. Additionally, the NTS-POMC rats exhibited increased glucose disposal, which is consistent with prior knowledge that central melanocortin receptor activation inhibits insulin release from the pancreas (Fan et al., 2000) and enhances whole body glucose disposal (Heijboer et al., 2005) independent of feeding and fat mass. Worthy of note, the POMC-treatment in the ARC tended to lower serum glucose level, but the decrease was not significant and not accompanied by any change in fasting insulin or glucose tolerance. A recent study using a central melanocortin blockade revealed a direct, feeding-independent control of peripheral lipid metabolism by the central MC system (Nogueiras et al., 2007). Such a mechanism would explain the marked reduction of serum triglyceride concentrations following rAAV-POMC gene therapy in either the ARC or NTS of the brain.
This is the first study to examine and dissect the effects of long-term melanocortin activation in the forebrain ARC versus the hindbrain NTS in combating dietary obesity. Whilst the rAAV-POMC transfer to the NTS caused mild anorexia, persistent weight loss, improved insulin sensitivity, and increased propensity for voluntary wheel running in the dietary obese rats, the similar intervention in the ARC only had minimal physiological and metabolic impact. The NTS POMC treatment likely evokes several mechanisms involving modest and temporary anorexia, stimulation of energy expenditure via brainstem-regulated sympathetic outflow, increase in glucose disposal, and probably a direct suppression of insulin production. The findings from the current study implicate different roles that the hypothalamic or brainstem melanocortin system may play in long-term homeostatic and hedonic feeding regulation, and reveal the complexity of the neuroendocrine control of physiology and metabolism in obese rodents. Our data, in particular, highlight the effectiveness of the POMC treatment in the NTS in stimulating physical activity and enhancing insulin sensitivity. These results suggest the melanocortin activation of the NTS is an attractive strategy to provide long lasting weight control and metabolic benefits.
Acknowledgments
This work was supported by the Merit Review award of the Medical Research Service of the Department of Veterans Affairs, NIH AG026159, and Claude D. Pepper Older Americans Independence Center NIH P30 AG028740.
Abbreviations
- rAAV-POMC
recombinant adeno-associated virus-mediated POMC gene transfer
- rAAV-Control
rAAV encoding GFP
- HF
high fat
- DIO
diet-induced obese or diet-induced obesity
- WR
wheel running
- ARC
arcuate nucleus
- NTS
nucleus of the solitary track
- MC
melanocortin
- IPGTT
intraperitoneal glucose tolerance test
- QUICK
the Quantitative Insulin Sensitivity Check Index
- POMC
pro-opiomelanocortin
- MC3R
melanocortin 3 receptor
- MC4R
melanocortin 4 receptor
- α-MSH
α-melanocyte stimulating hormone
- MTII
melanotan II
- AgRP
agouti-related protein
- NPY
neuropeptide Y
- DBH
dopamine-beta-hydroxylase
- TH
tyrosine hydroxylase
- UCP1
uncoupling protein 1
- BAT
brown adipose tissue
- WAT
white adipose tissue
Footnotes
Duality of interest This study involves no duality of interest.
Publisher's Disclaimer: This is a PDF file of an unedited manuscript that has been accepted for publication. As a service to our customers we are providing this early version of the manuscript. The manuscript will undergo copyediting, typesetting, and review of the resulting proof before it is published in its final citable form. Please note that during the production process errors may be discovered which could affect the content, and all legal disclaimers that apply to the journal pertain.
References
- Abdel-Malek ZA. Melanocortin receptors: their functions and regulation by physiological agonists and antagonists. Cell Mol Life Sci. 2001;58:434–441. doi: 10.1007/PL00000868. [DOI] [PMC free article] [PubMed] [Google Scholar]
- Benoit S, Schwartz M, Baskin D, Woods SC, Seeley RJ. CNS melanocortin system involvement in the regulation of food intake. Horm Behav. 2000;37:299–305. doi: 10.1006/hbeh.2000.1588. [DOI] [PubMed] [Google Scholar]
- Carter CS, Cesari M, Ambrosius WT, Hu N, Diz D, Oden S, Sonntag WE, Pahor M. Angiotensin-converting enzyme inhibition, body composition, and physical performance in aged rats. J Gerontol A Biol Sci Med Sci. 2004;59:416–423. doi: 10.1093/gerona/59.5.b416. [DOI] [PubMed] [Google Scholar]
- Cone RD. Anatomy and regulation of the central melanocortin system. Nat Neurosci. 2005;8:571–578. doi: 10.1038/nn1455. [DOI] [PubMed] [Google Scholar]
- Ellacott KL, Cone RD. The central melanocortin system and the integration of short- and long-term regulators of energy homeostasis. Recent Prog Horm Res. 2004;59:395–408. doi: 10.1210/rp.59.1.395. [DOI] [PubMed] [Google Scholar]
- Erdem SR, Demirel HA, Broxson CS, Nankova BB, Sabban EL, Tumer N. Effect of exercise on mRNA expression of select adrenal medullary catecholamine biosynthetic enzymes. J Appl Physiol. 2002;93:463–468. doi: 10.1152/japplphysiol.00627.2001. [DOI] [PubMed] [Google Scholar]
- Fan W, Dinulescu DM, Butler AA, Zhou J, Marks DL, Cone RD. The central melanocortin system can directly regulate serum insulin levels. Endocrinology. 2000;141:3072–3079. doi: 10.1210/endo.141.9.7665. [DOI] [PubMed] [Google Scholar]
- Gao Q, Horvath TL. Neuronal control of energy homeostasis. FEBS Lett. 2008;582:132–141. doi: 10.1016/j.febslet.2007.11.063. [DOI] [PMC free article] [PubMed] [Google Scholar]
- Grill HJ, Ginsberg AB, Seeley RJ, Kaplan JM. Brainstem application of melanocortin receptor ligands produces long-lasting effects on feeding and body weight. J Neurosci. 1998;18:10128–10135. doi: 10.1523/JNEUROSCI.18-23-10128.1998. [DOI] [PMC free article] [PubMed] [Google Scholar]
- Hansen MJ, Ball MJ, Morris MJ. Enhanced inhibitory feeding response to alpha-melanocyte stimulating hormone in the diet-induced obese rat. Brain Res. 2001;892:130–137. doi: 10.1016/s0006-8993(00)03246-7. [DOI] [PubMed] [Google Scholar]
- Heijboer AC, van den Hoek AM, Pijl H, Voshol PJ, Havekes LM, Romijn JA, Corssmit EP. Intracerebroventricular administration of melanotan II increases insulin sensitivity of glucose disposal in mice. Diabetologia. 2005;48:1621–1626. doi: 10.1007/s00125-005-1838-8. [DOI] [PubMed] [Google Scholar]
- Heymsfield SB, Greenberg AS, Fujioka K, Dixon RM, Kushner R, Hunt T, Lubina JA, Patane J, Self B, Hunt P, McCamish M. Recombinant leptin for weight loss in obese and lean adults: a randomized, controlled, dose-escalation trial. Jama. 1999;282:1568–1575. doi: 10.1001/jama.282.16.1568. [DOI] [PubMed] [Google Scholar]
- Hwa JJ, Ghibaudi L, Gao J, Parker EM. Central melanocortin system modulates energy intake and expenditure of obese and lean Zucker rats. Am J Physiol Regul Integr Comp Physiol. 2001;281:R444–R451. doi: 10.1152/ajpregu.2001.281.2.R444. [DOI] [PubMed] [Google Scholar]
- Joseph SA, Pilcher WH, Bennett-Clarke C. Immunocytochemical localization of ACTH perikarya in nucleus tractus solitarius: evidence for a second opiocortin neuronal system. Neurosci Lett. 1983;38:221–225. doi: 10.1016/0304-3940(83)90372-5. [DOI] [PubMed] [Google Scholar]
- Katz A, Nambi SS, Mather K, Baron AD, Follmann DA, Sullivan G, Quon MJ. Quantitative insulin sensitivity check index: a simple, accurate method for assessing insulin sensitivity in humans. J Clin Endocrinol Metab. 2000;85:2402–2410. doi: 10.1210/jcem.85.7.6661. [DOI] [PubMed] [Google Scholar]
- Kishi T, Aschkenasi CJ, Lee CE, Mountjoy KG, Saper CB, Elmquist JK. Expression of melanocortin 4 receptor mRNA in the central nervous system of the rat. J Comp Neurol. 2003;457:213–235. doi: 10.1002/cne.10454. [DOI] [PubMed] [Google Scholar]
- Krude H, Biebermann H, Luck W, Horn R, Brabant G, Gruters A. Severe early-onset obesity, adrenal insufficiency and red hair pigmentation caused by POMC mutations in humans. Nat Genet. 1998;19:155–157. doi: 10.1038/509. [DOI] [PubMed] [Google Scholar]
- Lee MKA, Chua SC, Obici S, Wardlaw SL. Transgenic MSH Overexpression Attenuates the Metabolic Effects of a High Fat Diet. Am J Physiol Endocrinol Metab. 2007;293:E121–31. doi: 10.1152/ajpendo.00555.2006. [DOI] [PubMed] [Google Scholar]
- Levin BE, Dunn-Meynell AA. Reduced central leptin sensitivity in rats with diet-induced obesity. Am J Physiol Regul Integr Comp Physiol. 2002;283:R941–948. doi: 10.1152/ajpregu.00245.2002. [DOI] [PubMed] [Google Scholar]
- Li G, Mobbs CV, Scarpace PJ. Central pro-opiomelanocortin gene delivery results in hypophagia, reduced visceral adiposity, and improved insulin sensitivity in genetically obese Zucker rats. Diabetes. 2003;52:1951–1957. doi: 10.2337/diabetes.52.8.1951. [DOI] [PubMed] [Google Scholar]
- Li G, Zhang Y, Rodrigues E, Zheng D, Matheny M, Cheng KY, Scarpace PJ. Melanocortin activation of nucleus of the solitary tract avoids anorectic tachyphylaxis and induces prolonged weight loss. Am J Physiol Endocrinol Metab. 2007;293:E252–258. doi: 10.1152/ajpendo.00451.2006. [DOI] [PubMed] [Google Scholar]
- Li G, Zhang Y, Wilsey JT, Scarpace PJ. Unabated anorexic and enhanced thermogenic responses to melanotan II in diet-induced obese rats despite reduced melanocortin 3 and 4 receptor expression. J Endocrinol. 2004;182:123–132. doi: 10.1677/joe.0.1820123. [DOI] [PubMed] [Google Scholar]
- Li G, Zhang Y, Wilsey JT, Scarpace PJ. Hypothalamic pro-opiomelanocortin gene delivery ameliorates obesity and glucose intolerance in aged rats. Diabetologia. 2005;48:2376–2385. doi: 10.1007/s00125-005-1943-8. [DOI] [PubMed] [Google Scholar]
- Mountjoy KG, Mortrud MT, Low MJ, Simerly RB, Cone RD. Localization of the melanocortin-4 receptor (MC4-R) in neuroendocrine and autonomic control circuits in the brain. Mol Endocrinol. 1994;8:1298–1308. doi: 10.1210/mend.8.10.7854347. [DOI] [PubMed] [Google Scholar]
- Nogueiras R, Wiedmer P, Perez-Tilve D, Veyrat-Durebex C, Keogh JM, Sutton GM, Pfluger PT, Castaneda TR, Neschen S, Hofmann SM, Howles PN, Morgan DA, Benoit SC, Szanto I, Schrott B, Schurmann A, Joost HG, Hammond C, Hui DY, Woods SC, Rahmouni K, Butler AA, Farooqi IS, O’Rahilly S, Rohner-Jeanrenaud F, Tschop MH. The central melanocortin system directly controls peripheral lipid metabolism. J Clin Invest. 2007;117:3475–3488. doi: 10.1172/JCI31743. [DOI] [PMC free article] [PubMed] [Google Scholar]
- Palkovits M, Mezey E, Eskay RL. Pro-opiomelanocortin-derived peptides (ACTH/beta-endorphin/alpha-MSH) in brainstem baroreceptor areas of the rat. Brain Res. 1987;436:323–338. doi: 10.1016/0006-8993(87)91676-3. [DOI] [PubMed] [Google Scholar]
- Reynolds SL, Saito Y, Crimmins EM. The impact of obesity on active life expectancy in older American men and women. Gerontologist. 2005;45:438–444. doi: 10.1093/geront/45.4.438. [DOI] [PubMed] [Google Scholar]
- Savontaus E, Breen TL, Kim A, Yang LM, Chua SC, Jr, Wardlaw SL. Metabolic effects of transgenic melanocyte-stimulating hormone overexpression in lean and obese mice. Endocrinology. 2004;145:3881–3891. doi: 10.1210/en.2004-0263. [DOI] [PubMed] [Google Scholar]
- Scarpace PJ, Matheny M, Zolotukhin S, Tumer N, Zhang Y. Leptin-induced leptin resistant rats exhibit enhanced responses to the melanocortin agonist MT II. Neuropharmacology. 2003;45:211–219. doi: 10.1016/s0028-3908(03)00158-8. [DOI] [PubMed] [Google Scholar]
- Skibicka KP, Grill HJ. Energetic responses are triggered by caudal brainstem melanocortin receptor stimulation and mediated by local sympathetic effector circuits. Endocrinology. 2008;149:3605–3616. doi: 10.1210/en.2007-1754. [DOI] [PMC free article] [PubMed] [Google Scholar]
- Tang-Christensen M, Vrang N, Ortmann S, Bidlingmaier M, Horvath TL, Tschop M. Central administration of ghrelin and agouti-related protein (83–132) increases food intake and decreases spontaneous locomotor activity in rats. Endocrinology. 2004;145:4645–4652. doi: 10.1210/en.2004-0529. [DOI] [PubMed] [Google Scholar]
- Tumer N, Larochelle JS. Tyrosine hydroxylase expression in rat adrenal medulla: influence of age and cold. Pharmacol Biochem Behav. 1995;51:775–780. doi: 10.1016/0091-3057(95)00030-z. [DOI] [PubMed] [Google Scholar]
- Uhler M, Herbert E. Complete amino acid sequence of mouse pro-opiomelanocortin derived from the nucleotide sequence of pro-opiomelanocortin cDNA. J Biol Chem. 1983;258:257–261. [PubMed] [Google Scholar]
- Widdowson PS, Upton R, Buckingham R, Arch J, Williams G. Inhibition of food response to intracerebroventricular injection of leptin is attenuated in rats with diet-induced obesity. Diabetes. 1997;46:1782–1785. doi: 10.2337/diab.46.11.1782. [DOI] [PubMed] [Google Scholar]
- Williams DL, Kaplan JM, Grill HJ. The role of the dorsal vagal complex and the vagus nerve in feeding effects of melanocortin-3/4 receptor stimulation. Endocrinology. 2000;141:1332–1337. doi: 10.1210/endo.141.4.7410. [DOI] [PubMed] [Google Scholar]
- Yaswen L, Diehl N, Brennan MB, Hochgeschwender U. Obesity in the mouse model of pro-opiomelanocortin deficiency responds to peripheral melanocortin. NatMed. 1999;5:1066–1070. doi: 10.1038/12506. [DOI] [PubMed] [Google Scholar]
- Zhang Y, Matheny M, Tumer N, Scarpace PJ. Aged-obese rats exhibit robust responses to a melanocortin agonist and antagonist despite leptin resistance. Neurobiol Aging. 2004;25:1349–1360. doi: 10.1016/j.neurobiolaging.2004.02.012. [DOI] [PubMed] [Google Scholar]
- Zheng H, Patterson LM, Phifer CB, Berthoud HR. Brain stem melanocortinergic modulation of meal size and identification of hypothalamic POMC projections. Am J Physiol Regul Integr Comp Physiol. 2005;289:R247–258. doi: 10.1152/ajpregu.00869.2004. [DOI] [PubMed] [Google Scholar]