

Abstract
The neural representation of directional heading is encoded by a population of cells located in a circuit that includes the postsubiculum (PoS), anterodorsal thalamus (ADN), and lateral mammillary nuclei (LMN). Throughout this circuit, many cells rely on both movement- and landmark-related information to discharge as a function of the animal's directional heading. The PoS projects to both the ADN and LMN and these connections may convey critical spatial information about landmarks, since lesions of the PoS disrupt landmark control in head direction (HD) cells and hippocampal place cells (Goodridge and Taube, 1997; Calton et al., 2003). The PoS→ADN projection originates in the deep layers of PoS, but no studies have determined whether the PoS→LMN projection originates from the same cells that project to ADN. To address this issue, two distinct cholera toxin-subunit B (CTB) fluorophore conjugates (Alexa Fluor 488 and Alexa Fluor 594) were injected into the LMN and ADN of the same rats, and PoS sections were examined for cell bodies containing either or both CTB conjugates. Results indicate the PoS→LMN projection originates exclusively from a thin layer of cells located superficial to the layer(s) of PoS→ADN projection cells, with no overlap. To verify the laminar distribution and morphological characteristics of PoS→LMN and PoS→ADN cells, biotinylated dextran amine was injected into LMN or ADN of different rats, and tissue sections were counterstained with thionin. Results indicate the PoS→LMN projection arises from large pyramidal cells in layer IV, whereas the PoS→ADN projection arises from a heterogeneous cell population in layers V/VI. The present study provides the first evidence that the PoS→ADN and PoS→LMN projections arise from distinct, non-overlapping cell layers in PoS. Functionally, the PoS may provide landmark information to HD cells in LMN.
Keywords: Visual, cortex, orientation, navigation, landmarks
Introduction
The head direction (HD) signal is a neural representation of perceived momentary directional heading within the yaw plane relative to the environment (for review, see Taube, 2007). Generation of the HD signal is hypothesized to occur within the reciprocal connections between the dorsal tegmental nuclei (DTN) and lateral mammillary nuclei (LMN), where vestibular, motor efference copy, and proprioceptive information arrive from the medial vestibular nucleus via the nucleus prepositus hypoglossi and supragenual nucleus (Biazoli et al., 2006; Song and Wang, 2005; Taube and Bassett, 2003). From the LMN, the HD signal is projected bilaterally to the anterodorsal thalamic nucleus (ADN) (Blair et al., 1998; Gonzalo-Ruiz et al., 1998; Bassett et al., 2007). From the ADN, the HD signal appears to be projected to various cortical regions, including postsubiculum (PoS; also referred to as dorsal presubiculum, Brodmann area 48), retrosplenial cortex, and medial entorhinal cortex, all of which contain HD cells (Cho and Sharp, 2001; Fyhn et al., 2004; Goodridge and Taube, 1997; Sharp, 1996; Shibata, 1993; Taube et al., 1990a; van Groen and Wyss, 1995). Of particular interest, the PoS is necessary for landmark information, since lesions of the PoS disrupt landmark control in HD cells in the ADN and LMN (Goodridge and Taube, 1997; Yoder and Taube, unpublished observations) and in hippocampal place cells (Calton et al., 2003). These findings suggest that spatial information about visual landmarks enters the HD cell circuit at the PoS. An understanding of the connectivity between the subcortical and cortical components of the HD cell circuit is necessary for the determination of how visual landmark information is routed to PoS, as well as its contribution to the HD signal.
Visual information may arrive at PoS via the direct projection from striate and/or extrastriate visual cortex to PoS layers I and III (Vogt and Miller, 1983). From PoS, one possible route of visual input to ADN HD cells is the direct unilateral projection from PoS→ADN, which originates in PoS layer VI (van Groen and Wyss, 1990b). An alternative, or complementary, route of landmark information input to the ADN HD signal is the unilateral PoS→LMN projection, which may provide visual information to the HD circuit upstream from ADN (Namura et al., 1994; Shibata, 1989; van Groen and Wyss, 1990b). Although the presence of pathways from PoS→ADN and PoS→LMN are well established (Allen and Hopkins, 1989; Donovan and Wyss, 1983; Seki and Zyo, 1984; Shibata, 1989, 1992; van Groen and Wyss, 1990b), it is not known whether these fibers arise from distinct populations of PoS neurons, or from the same PoS neurons that send projections to both target nuclei. Furthermore, the morphological characteristics of the PoS→LMN and PoS→ADN neurons are not fully understood.
One possible reason for the lack of detailed description of the PoS projection cells is the structural uniqueness of PoS. PoS has been classified as periallocortex, which consists of inner and outer lamina separated by lamina dissecans (Witter et al., 1989). Because this laminar arrangement differs from the six layers of neocortex, the laminar distribution of PoS neurons that give rise to the ADN or LMN projections may be unique to PoS. Previous studies indicate that the deep pyramidal and multiform layers of PoS project to the thalamus (Seki and Zyo, 1984; van Groen and Wyss, 1990b), and the PoS→LMN projection cells have been postulated to originate in PoS layer V (Ishizuka, 2001). However, this laminar distribution has not been conclusively documented and inconsistent findings have been reported. For example, this projection has been described as arising 1) from cells “which are intermediate in the superficial to deep axis” (Donovan and Wyss, 1983), 2) from “a portion between the internal and external laminae” (Shibata, 1989), or 3) in “the deep layers” (Namura et al., 1994).
The specific laminar distribution of the PoS→LMN projection cells is further complicated by the fact that a clear description of the PoS lamina remains elusive. Based on silver-stained tissue, some researchers have described PoS layers III-VI as indistinguishable from one another (Blackstad, 1956), whereas others have adopted the classification system of Lorente de Nó (1933), placing lamina dissecans in layer IIIa, the large internal pyramids in layer IV, and combining layers V and VI to include small-medium pyramidal and multiform cells (Haug, 1976; Witter et al., 1989). We have chosen here to use the classification system of Lorente de Nó (1933). According to this classification, if the PoS→LMN neurons are located in layer IV, then they are likely to be large pyramidal cells. In contrast, if the PoS→ADN projection originates from layers V/VI, as previously suggested (van Groen & Wyss, 1990b), then these cells are likely to be small-medium pyramidal cells or to have heterogeneous morphological characteristics.
The purpose of the present study was twofold: 1) to provide a description of PoS based on the morphological characteristics of its neurons, and characterize the types of cells that project from PoS to ADN and LMN, and 2) to determine whether these projections originate from the same neurons or from distinct populations within the PoS. The laminar distinction between the cell bodies of PoS→LMN and PoS→ADN projections was determined by the retrograde tracer cholera toxin, subunit B (CTB) conjugated to two distinct fluorophores, with one CTB conjugate injected into LMN and the other conjugate injected into ADN of the same rats. We also determined the morphological characteristics and dendritic distribution of PoS cells that projected to ADN and LMN by injecting low-molecular weight biotinylated dextran amine (BDA) into the LMN and ADN of different rats. BDA has both anterograde and retrograde properties, and has been shown to retrogradely label the soma as well as the dendrites (Vercelli et al., 2003). Although retrograde BDA labeling allows reconstruction of dendritic distribution, this technique does not provide labeling sufficient for electron microscopic analysis of synaptic contacts or detection of dendritic spines when transported from long (> 2-3 mm) axons. Nevertheless, coupled with the results of previous studies, our results provide important new evidence for the route by which visual landmark information gains control of the HD cell signal in ADN and LMN.
Materials and Methods
Subjects
All experimental procedures were approved by the Dartmouth College Institutional Animal Care and Use Committee. Female Long-Evans hooded rats (age: 72-195 days; 300-400 g; n = 14) were group housed preoperatively and individually housed postoperatively within the same colony room. Rats received food and water ad libitum throughout the procedure.
Injection apparatus
Tracer injections were made using one of two methods. The first method utilized a 1 μl Hamilton syringe (Hamilton, Reno, NV) with a blunt tip. The tracer solution was ejected from the syringe by manually depressing the plunger until the desired amount was ejected. Although this method was successfully used to inject tracers into the LMN for several rats, we sometimes had difficulty injecting into ADN with the blunt syringe. To increase our success rate, we used calibrated 5 μl glass pipettes (World Precision Instruments, Sarasota, FL) that were pulled to a sharp point with a pipette puller (model PN-3; Narashige, Tokyo, Japan). The tip of the pipette was broken to ≈50 μm diameter, and pipettes were backfilled with the tracer solution. The pipette was then connected to a custom-built manual pressure injection unit to allow ejection of tracer into the brain. For successful injections reported here, a single method of tracer injection was used for each rat, including cases in which multiple injections were introduced into the same rat (i.e., CTB injections).
The goal of the present study was to assess the distribution and morphology of PoS neurons that provide projections to the LMN and ADN, and these projections are known to comprise exclusively ipsilateral fibers (Shibata, 1989; van Groen and Wyss, 1990; Ishizuka, 2001; Donovan and Wyss, 1983). Given the exclusively ipsilateral projections, the present study included bilateral injections of tracers into the LMN or ADN for all animals. All labeled neurons were characterized based on the assumption that this labeling resulted from tracer injection into the ipsilateral target nucleus. This procedure was used in order to minimize the number of animals used for the experiments and did not compromise interpretation of the results.
Cholera toxin injection procedure
One of two CTB-fluorophore conjugates, Alexa Fluor 488 (cyan-green) or 594 (orange-red) (Invitrogen, Carlsbad, CA), was loaded into the injector. Rats were anesthetized with intramuscular injection of ketamine/xylazine (90mg/kg and 10mg/kg, respectively) or intraperitoneal injection of sodium pentobarbital (Nembutal; 50 mg/kg) and positioned in a stereotaxic apparatus with the head held in place by ear bars (David Kopf Instruments, Tujunga, CA). The scalp was retracted and holes were drilled bilaterally above the ADN and LMN. Using previously reported coordinates as a reference point (Paxinos and Watson, 1998), the injector containing CTB conjugated to Alexa Fluor 594 or Alexa Fluor 488 was lowered into ADN (1.8 mm posterior, ±1.35 mm lateral, 5.5 mm ventral to Bregma). An injector containing CTB conjugated to the opposite fluorophore was lowered into LMN (4.55 mm posterior, ±1.05 mm lateral, 9.45 mm ventral to Bregma). At all sites, 300 nl of CTB was injected at 100 nl/min. The injector was left in place for 3 min after the injection to allow tracer diffusion before withdrawal. Following injector withdrawal, the scalp was sutured and the animal was allowed to recover one week. Buprenorphine (.015 mg/kg) was administered as a post-operative analgesic.
Biotinylated dextran amine injection procedure
The injector was filled with 10% lysine-fixable BDA in dH2O; molecular weight = 3,000 da (Invitrogen). Rats were prepared for surgery as described above. For rats receiving LMN injections, holes were drilled bilaterally over LMN, and the loaded injector was lowered into the LMN of each hemisphere. For rats receiving ADN injections, holes were drilled bilaterally over ADN, and the injector was lowered into the ADN of each hemisphere. At each site, 300 nl of BDA was injected at 100 nl/min. The injector was left in place for 10 min after the injection to allow diffusion before the syringe was withdrawn. Rats were allowed to recover as described above.
Histology
Rats were deeply anesthetized with sodium pentobarbital (150 mg/kg, i.p.), and then perfused through the heart with 250 ml of normal saline followed by 500 ml of buffered 4% (w/v) paraformaldehyde/0.5% (w/v) glutaraldehyde, pH 7.4. After perfusion, brains were submerged overnight in the paraformaldehyde/glutaraldehyde fixative. Brains were then transferred to buffered 25% sucrose, pH 7.4, for cryoprotection. Following cryoprotection for ≥ 48 hr, a cryostat was used to acquire 50 μm coronal sections that included ADN, LMN, and PoS. For animals that received CTB injections, brain sections were immediately mounted on gelatin-coated microscope slides. Unstained brain tissue was then dehydrated and covered with glass slide covers. For animals that received BDA injections, brain sections were lifted from the cryostat blade and immersed in 0.1 M phosphate buffer (PB), pH 7.4. Tissue sections were washed in 0.1 M PB for 15 min (3 × 5 min) and then agitated in an avidin-biotin-peroxidase complex (ABC standard; Vector, Burlingame, CA) for 3-4 hr at room temperature. After ABC, the tissue was again washed (3 × 5 min) in 0.1 M PB prior to reaction of BDA labeled cells with nickel-enhanced 3,3′ diaminobenzidine tetrahydrochloride (DAB). For this reaction, tissue sections were agitated in buffered DAB (0.05% (w/v), pH 7.4) for 20 min, at which point nickel chloride (0.02% (w/v)) was added for an additional 10 min period. Following DAB reaction, sections were washed in 0.1 M PB for 30 min (6 × 5 min) and then mounted on microscope slides. Mounted sections were allowed to dry overnight, after which they were rehydrated, stained with thionin, dehydrated, and covered with glass.
Histological analysis
From tracer injections into LMN and ADN, neurons in many brain structures exhibited retrograde labeling. The focus of this paper, however, is on the connections within the HD circuit; consequently, discussion of labeled neurons is limited to those originating in PoS. Brain structures and fiber pathways are described according to Swanson's anatomical rat brain atlas (Swanson, 1992). For illustrations, diagrams of coronal brain sections were obtained from the digital rat brain atlas of Paxinos and Watson (1998).
For animals injected with CTB, brain sections including LMN, ADN, and PoS were examined under a Leitz Laborlux S microscope with Ploemopak 2.5 epi-fluorescence illuminator (Leitz, Wetzlar, Germany). For Alexa Fluor 488-labeled neurons, a Leitz L3 filter cube provided excitation from 450 to 490 nm and emission at 525 ± 20 nm with a 510 nm dichroic; Alexa Fluor 594-labeled neurons were visualized with a Chroma 31004 filter that provided excitation at 560 ± 20 nm and emission at 630 ± 30 nm with a 595 nm dichroic (Chroma Technology, Rockingham, VT). Upon confirmation that each CTB injection was contained within the bounds of the target structure, photomicrographs of the injection site(s) and PoS were taken with a Leica DFC300 digital camera (Leica Microsystems, Wetzlar, Germany) controlled by a computer (MacIntosh G5) running Leica Firecam (v. 1.7.1) software. For animals that received combination CTB injections into LMN and ADN, both fluorescent filters were used for visual inspection of labeled cells in LMN, ADN, and PoS. Labeled neurons were visually inspected at high magnification to determine whether any cells contained both fluorophores. For presentation, photomicrographs were taken of these sections. Enhanced images of injection sites in ADN and LMN, as well as of retrogradely labeled neurons in PoS, were digitally modified with Photoshop (Adobe Systems, San Jose, CA) to enhance contrast and color. Images of labeled PoS neurons were then digitally overlaid to illustrate similarities or differences in the distributions of neurons labeled by CTB injection into LMN and ADN.
Quantification
Morphological characteristics and distribution of BDA labeled neurons were analyzed under a light microscope. The size of the soma of all labeled cells within PoS was visually measured with an ocular micrometer, and the mean soma size was calculated for each projection cell population. To prevent underestimation of soma diameter, only somas that were contained within the tissue section were included in the analysis. This preliminary evaluation was performed by optically dissecting each tissue section and eliminating cells that were in focus at the top or bottom surface. In the event of punctate labeling, cells were only included in size estimation if the position and shape of the cell membrane was clearly visible.
For non-pyramidal cells, two axes were used to calculate cell dimensions: Axis A was perpendicular to the pial surface, and axis B was parallel to the pial surface. For pyramidal cells, axis A was parallel to the apical dendrite, including the dendritic arbor, and axis B was perpendicular to the apical dendrite, on the same plane as the basal dendritic protrusions. For non-pyramidal cells, cross-sectional area of the soma was calculated as an ellipse: AreaEL = πab, where a = 0.5 · axis A, and b = 0.5 · axis B. For pyramidal cells, the cross-sectional area of the soma was calculated as a triangle: AreaPYR= 0.5bh, where b = the base (axis B), and h = the height (axis A). No correction for shrinkage was performed on cell measurements.
Dendritic characterization included distribution and classification. Non-pyramidal cells were characterized by the absence of a large apical dendrite, and heterogeneity of somatic geometry. These cells were typically ovoid or granular in appearance. Pyramidal cells were characterized by the presence of a large-diameter apical dendrite and a homogeneous, somewhat triangular, appearance of the soma. In many cases, the dendrites could be followed until they ended abruptly at the point where the tissue had been sectioned.
Limitations
Given the axonal length of PoS→ADN and PoS→LMN projection cells, BDA labeling was usually limited to large-diameter dendrites. BDA labeling also prevented quantification of dendritic spines, which were not visible on the dendrites of PoS→ADN or PoS→LMN projection cells.
Results
Anatomical description of brain structures
Postsubiculum
The PoS has been described in detail previously (van Groen and Wyss, 1990b), and we have used this description to define the anatomical bounds of PoS. We note, however, that based on morphology and connectivity, some researchers do not consider the PoS to be a distinct structure, but rather the dorsal portion of the presubiculum (Witter and Amaral, 2004). Briefly, the PoS is a fairly large region of subicular cortex bounded dorsally and medially by retrosplenial granular a cortex, and ventrally by the presubiculum (Figure 1). Rostrally, PoS is bounded by the dorsal subiculum. PoS extends caudally until it tapers off and the dorsal retrosplenial area abuts the parasubiculum, just caudal to the point where the dorsal hippocampal commissure and external capsule terminate. As with parasubiculum and presubiculum, the PoS is characterized by the appearance of two broad regions, the internal and external lamina, separated by lamina dissecans. The external lamina includes cortical layers I-III: At the pial surface, PoS layer I includes a narrow, relatively cell-free plexiform layer. Layer II contains many small cells that are somewhat clustered into islands. Layer III is a broad band containing many pyramidal cells showing some alignment parallel to the pial surface. Layer IIIa is lamina dissecans, a narrow band sparsely populated by various types of neurons, which separates the internal and external lamina. At the caudal extent of PoS, the deep edge of lamina dissecans is bounded by layer IV, a narrow band of large pyramidal cells. Rostrally, however, layer IV seems to overlie layer IIIa. Layers V and VI are not separated in PoS, with small-medium pyramidal cells (layer V) juxtaposed with multiform cells (layer VI). Lying deep to layers V/VI is the dorsal hippocampal commissure.
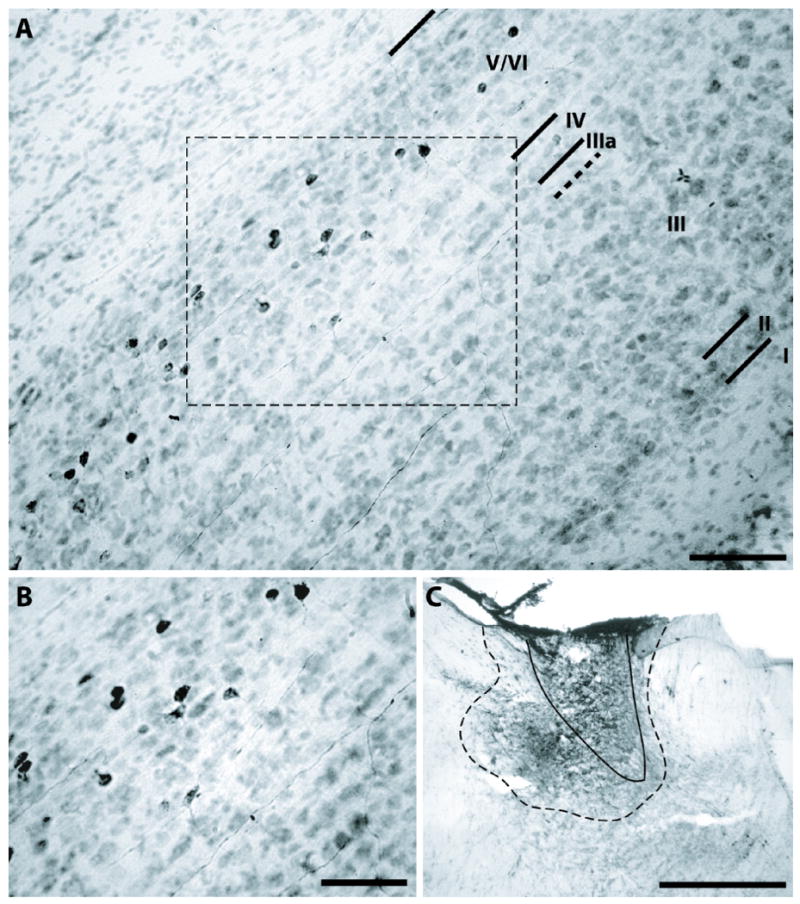
Figure 1.
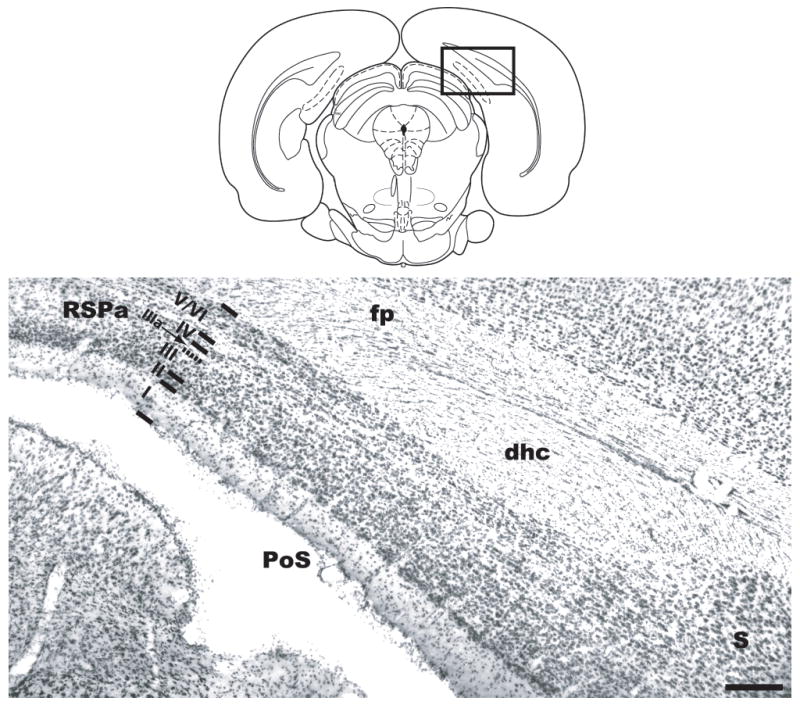
Schematic diagram and coronal section stained with thionin, illustrating the position of PoS relative to surrounding brain areas. Lines parallel to the pial surface and Roman numerals indicate PoS lamina. dhc, dorsal hippocampal commissure; fp, forceps posterior of corpus callosum; PoS, postsubiculum; S, subiculum; RSPa, retrosplenial granular a cortex. Scale bar, 400 μm. Rectangle in schematic diagram indicates approximate location of photographed tissue.
Tracing experiments
Cholera toxin, subunit B (Table 1)
Table 1.
Injection Sites
| Injection site | Laminar distribution of cells in PoS | |||
|---|---|---|---|---|
| Case # | LMN | ADN | LMN injection | ADN injection |
| 29 L | - | ++ | - | V/VI ++ |
| 29 R | ++ | + | IV ++ | V/VI + |
| 42 L | + | +A | IV + | IV + V/VI + |
| 49 L | + | + | IV + | V/VI + |
| 49 R | ++ | - | IV ++ | - |
| 70 L | + | ++A | IV + | IV ++ V/VI ++ |
| 70 R | ++A | ++ | IV ++ | V/VI ++ |
| 22 L | + | - | IV | - |
| 22 R | ++A | - | IV ++ | - |
| 41 L | ++A | - | IV ++ | - |
| 43 L | + | ± | IV + | V/VI ± |
| 43 R | ++A | ± | IV ++ | V/VI ± |
| 46 L | - | + | - | + |
| 46 R | + | - | IV ± | - |
| 44 L | ± | ++A | IV ± | IV +, V/VI ++ |
| 44 R | ± | + | IV ± | V/VI ± |
| 48 L | - | + | - | V/VI + |
| 51 R | + | - | IV + | - |
Location of cholera toxin injection into the LMN and ADN of left (L) and right (R) hemispheres and associated retrogradely labeled PoS neurons. For injection sites, minus (-) indicates no detectable presence of tracer; plus/minus (±) indicates marginal presence of tracer; plus (+) indicates tracer diffusion into a limited portion of the target structure; double plus (++) indicates nearly complete diffusion of tracer throughout target structure; the letter “A” indicates tracer diffusion into adjacent structures. For the laminar distribution of cells in PoS, minus (-) indicates no detection of labeled neurons; plus/minus (±) indicates sparse population of labeled cells; plus (+) indicates moderate population of labeled neurons; double plus (++) indicates dense population of labeled cells.
In most cases of CTB injection into the anterior thalamus, CTB diffused into regions that were adjacent to ADN, including the anteroventral (AVN) and laterodorsal thalamus (LDN). This tracer diffusion into adjacent thalamic nuclei is of particular concern in the present study, given the dense projection from PoS to LDN and AVN (Seki and Zyo, 1984; van Groen and Wyss, 1990b). Nevertheless, results from one rat (case #70) in which CTB was mostly confined to ADN in one hemisphere, but diffused into adjacent nuclei in the opposite hemisphere, are informative for distinguishing labeling that resulted from injections in the different thalamic nuclei. This case is described below in the next section.
Potential double labeling in PoS
In four rats (cases #29, 42, 49, and 70), both the ADN and LMN of the same hemisphere were filled with CTB, thus opening the possibility that double-labeled cells could be present in PoS if some cells projected to both nuclei. In case #70, the CTB-Alexa Fluor 594 conjugate entered ADN bilaterally (Figure 2). In the right hemisphere, this injection was mostly confined to the ADN, with only marginal diffusion into adjacent areas, which resulted in retrograde labeling mostly limited to cells along the deep white matter in the right hemisphere. In the right LMN, CTB-Alexa Fluor 488 injection resulted in a nearly complete filling of LMN. This injection resulted in a small strip of labeled PoS neurons along a band that lay intermediate in the superficial-deep axis. Importantly, none of the cells retrogradely labeled by the ADN injection or LMN injection contained both fluorophores, suggesting the PoS projection cells do not provide collaterals to both nuclei. In the left hemisphere, in addition to the ADN, CTB also diffused into the AVN and LDN. This CTB diffusion into adjacent thalamic nuclei resulted in a layer of labeled cells that lay superficial to the PoS→ADN projection cells, intermediate along the superficial-deep axis. These neurons had the appearance of pyramidal cells, with large somas and processes suggestive of large apical dendrites. Notably, these cells were interspersed with retrogradely labeled PoS→LMN cells, but no cells contained both fluorophores, further indicating that the same PoS cells do not project to both the LMN and the anterior thalamic nuclei.
Figure 2.
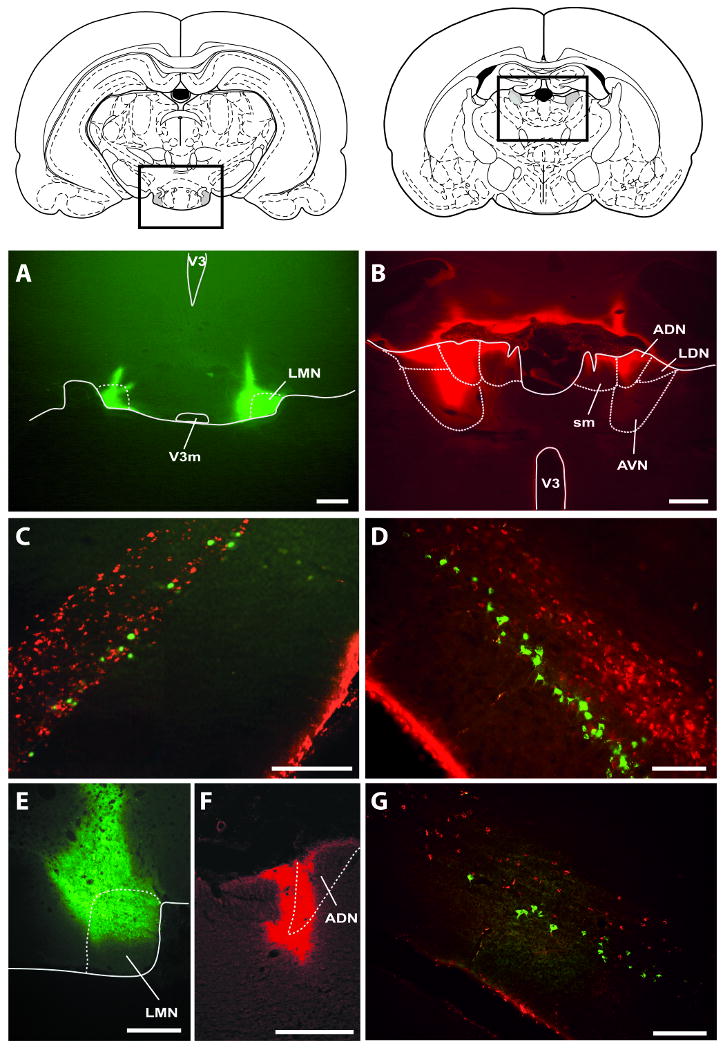
Retrograde labeling in PoS following tracer injection into LMN and ADN. A-D, Case #70. A, Cholera toxin-Alex Fluor 488 (CTB-488) injection sites in LMN. The left LMN is partially filled with CTB-488, whereas the right LMN is completely filled with CTB-488. Dashed lines indicate LMN, corresponding to LMN (shaded areas in rectangle) in diagram above. Scale bar, 500 μm; V3, third ventricle; V3m, third ventricle, mammillary recess. B, CTB-594 injection sites in the ADN. CTB-594 is present in the left ADN and surrounding areas including the anteroventral (AVN) and laterodorsal thalamic (LDN) nuclei. CTB-594 is mostly limited to the ADN in the right hemisphere, with little diffusion into surrounding areas. Dashed lines indicate ADN and surrounding nuclei, corresponding to the rectangle in the diagram above. Scale bar, 500 μm; sm, stria medullaris. C-D, Somas of layer IV and V-VI neurons in the left PoS show labeling following CTB-594 injection (red) into the left anterior thalamic nuclei. Somas of layer IV neurons show light labeling from CTB-488 injection (green) into a portion of the left LMN. In the right PoS, retrograde labeling is primarily limited to layer V/VI following CTB-594 injection that did not appear to diffuse outside of ADN. Note that there is little CTB-594 retrograde labeling in layer IV, presumably because there was an absence of CTB-594 injected into the ipsilateral AVN. Somas and proximal dendrites of layer IV neurons showed dense labeling following CTB-488 injection that completely filled the right LMN. Scale bars, 200 μm. E-G, Case #29. E-F, Cholera toxin was injected into a portion of the right LMN and ADN, respectively. Scale bars, 500 μm. G, The ADN injection resulted in light labeling of the deepest layers of the right PoS (red). The LMN injection resulted in moderate labeling of deep pyramidal cell layer (green). Scale bar, 200 μm. Note that for injections into ADN, some CTB-594 diffused into the third ventricle during injection, resulting in fluorescence along the ventricular wall of the fimbria (panel B), as well as of the PoS (panels C, D, G).
In case #29, CTB-Alexa Fluor 594 injection diffused through most of the left ADN, but only partially diffused through the right ADN. In addition, CTB-Alexa Fluor 488 was only present in the right LMN, limiting our assessment of potentially double-labeled PoS cells to the right hemisphere. The projection to the right LMN originated in a narrow band of neurons that lay intermediate along the superficial-deep axis in the right PoS. In contrast, the projection to ADN originated in cells that lay just superficial to the deep white matter, and no double labeled cells were observed. Similar results were obtained in case #42, which had limited diffusion of the tracer throughout the left ADN, with some additional diffusion into portions of AVN and LDN. This injection resulted in retrogradely labeled cells in the thin intermediate band and in the deep layer(s) of the left PoS. The LMN injection in case #42 showed nearly complete diffusion throughout the left LMN which filled cells in the intermediate thin band of cells in the left PoS, but no double labeled cells were observed. In case #49, the thalamic injection was mostly confined to the left ADN, which resulted in many labeled neurons in the deep layer(s) of the left PoS. The mammillary injections partially filled the left LMN and completely filled the right LMN. These mammillary injections resulted in labeled cells in the thin intermediate band in the PoS of both hemispheres. However, as in all other cases, no cells in PoS were found to be double labeled following injections into LMN and the anterior thalamic nuclei. In summary, thalamic injections resulted in many retrogradely labeled cells in the deep layers of PoS, and in cases of CTB diffusion into AVN or LDN, additional cells were labeled in a narrow strip that was intermediate along the superficial-deep axis. This narrow strip of cells appeared similar to the strip of cells that was labeled following CTB injection into LMN, but no double labeled cells were observed, confirming that different populations of PoS cells project to the thalamus and LMN.
PoS→LMN Cells
Along with the cases mentioned above, four additional rats received CTB injections into LMN (cases 22, 41, 43, and 46), but did not receive accurate CTB injections into the ipsilateral anterior thalamus. In all cases, CTB injection into LMN resulted in labeled cells in the ipsilateral PoS which formed a narrow band that lay parallel to the pial surface and intermediate in the superficial-deep axis. However, laminar distribution could not be conclusively determined from CTB labeling alone because only the labeled cells were visible. Nevertheless, comparison of labeled PoS neurons with adjacent thionin-stained PoS sections suggests that the PoS→LMN neurons are mostly located along the border of lamina dissecans (layer IIIa). These results are consistent with those reported above, as well as with those reported previously (van Groen and Wyss, 1990b; Shibata, 1989).
PoS→ADN Cells
In addition to the cases described above, four rats received CTB injection that included the ADN (cases 44, 46, 48, and 51) without CTB injections into the ipsilateral LMN. Labeled cells were observed in a layer of the ipsilateral PoS that was immediately superficial to the dorsal hippocampal commissure. This finding is consistent with previous reports that the PoS→ADN projection originates from layer VI (van Groen and Wyss, 1990b). However, as with the injections aimed at LMN, CTB injection does not allow laminar classification of the projection cells, and we were therefore unable to rely on CTB to determine the layer from which these projections originate.
Biotinylated Dextran Amine
PoS→LMN cells
Cases #54 and #55 included extensive bilateral injection of BDA into LMN, which resulted in heavy anterograde terminal labeling in ADN, along with retrograde labeling of many PoS projection cells. In both cases, retrogradely labeled cells were distributed along the border of PoS layers IIIa and IV (Figures 3,4). All labeled cells had rather homogeneous morphological characteristics consistent with pyramidal cells. Because uniformly large pyramidal cells are not known to appear in lamina dissecans (layer IIIa), it is highly probable that these PoS→LMN projection cells belong to layer IV. Additionally, all heavily labeled PoS→LMN neurons gave rise to apical dendrites extending toward the superficial layers of PoS. In cases where the apical dendrites could be reconstructed, the dendrites were followed to layer I or II, at which point they could no longer be followed.
Figure 3.
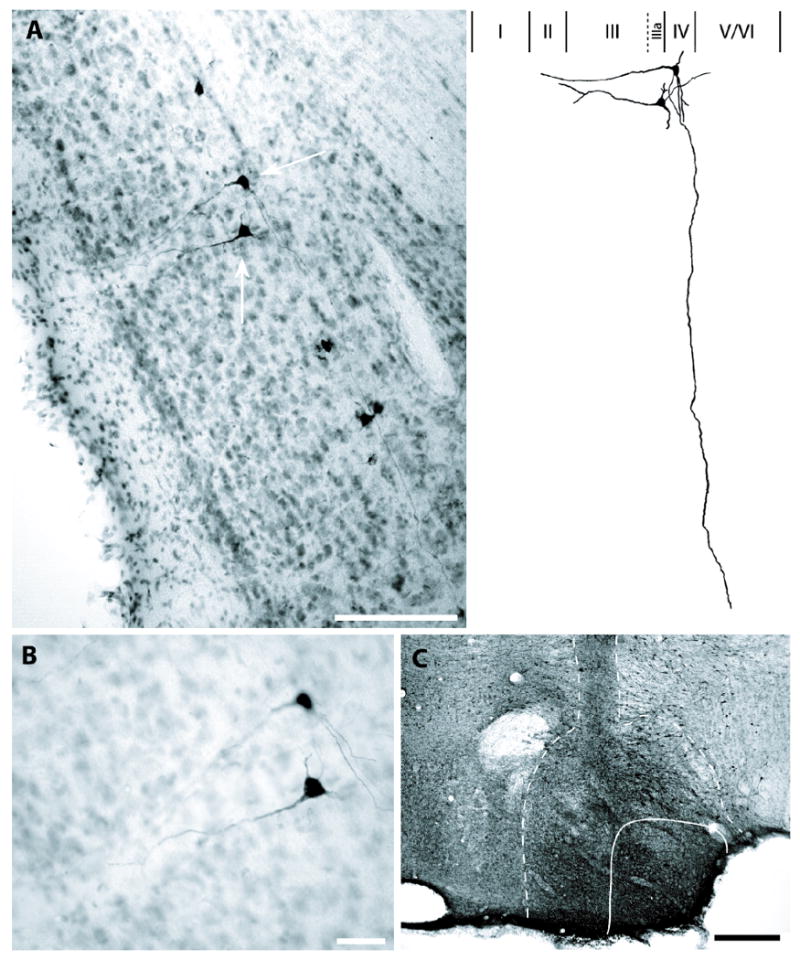
Pyramidal cells in PoS labeled by BDA injection into LMN; case #54. A, For two exemplary neurons (denoted by white arrows), large apical dendrites could be followed toward the superficial layers. For the uppermost cell, note the long basal dendrites confined to the deep layer(s) of postsubiculum and axon extending from the lower cell toward the deep white matter. Also, note the morphological homogeneity of labeled cells and their position, which shows some overlap with lamina dissecans (layer IIIa). Scale bar, 150 μm. Right, Schematic reconstruction of layer IV pyramidal cells depicted in A. Apical dendrites of both cells could be followed into layer II. The long basal dendrite that is contained within layer IV originates from the upper cell and could be followed to the lateral boundary of PoS/subiculum. Roman numerals indicate PoS lamina. B, High magnification illustrating the somas of the cells depicted in A. Scale bar, 25 μm. C, BDA injection site in ipsilateral LMN. Solid line indicates boundaries of LMN; dashed line indicates extent of BDA diffusion into adjacent structures. Dark vertical band above LMN indicates track of the injection cannula. Scale bar, 200 μm.
Figure 4.
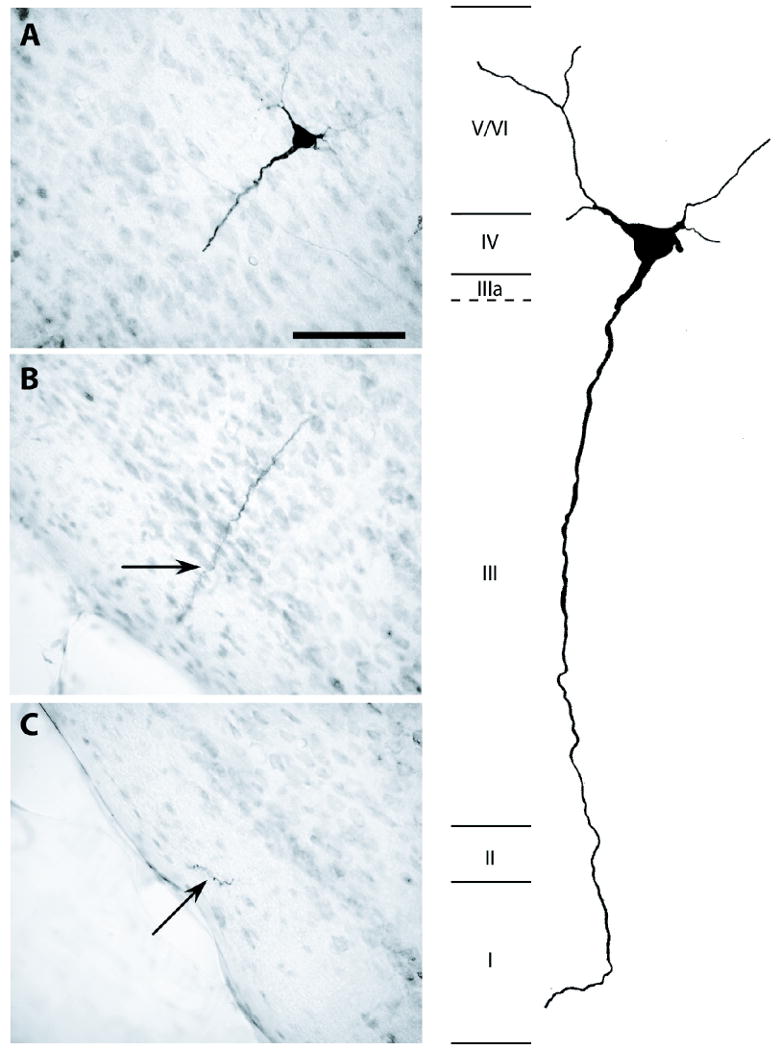
Pyramidal cell in PoS labeled by BDA injection into LMN; case #55. A-C, Adjacent brain sections containing portions of a heavily labeled pyramidal cell. Scale bar, 75 μm. Right, Schematic reconstruction of the labeled cell. Apical dendrite could be followed into layer I, and basal dendrites into layers V/VI. Roman numerals indicate PoS lamina. IIIa represents lamina dissecans.
PoS→ADN cells
Case #56 included extensive retrograde labeling of PoS neurons following BDA injection into ADN (Figure 5). As with the CTB injection, tracer diffusion into adjacent anterior thalamic areas is of concern, and the PoS→LDN pathway (van Groen and Wyss, 1990b), and/or PoS→AVN pathway (Seki and Zyo, 1984) resulted in several labeled pyramidal cells in PoS layer IV. Therefore, to eliminate the possibility of including PoS→AVN cells in our measurements, we did not include layer IV pyramidal neurons. This exclusion is warranted by several findings, including 1) the previous data suggesting the PoS→ADN projection originates exclusively from layer VI (van Groen and Wyss, 1990b), and 2) the paucity of labeled layer IV neurons following retrograde tracer injections that were mostly confined to ADN.
Figure 5.
Multiform cells in PoS layers V/VI labeled by BDA injection into ADN; case #56. A, Most neurons labeled by BDA injection into ADN lacked long apical dendrites and were not characterized by pyramidal shaped soma. Black lines indicate borders of PoS lamina. Scale bar, 100 μm. B, High magnification image of labeled cells from region outlined by rectangle in panel A. Scale bar, 50 μm. C, BDA injection was most concentrated in the ipsilateral ADN (outlined by solid black line), with some diffusion into adjacent nuclei including the anteroventral and anteromedial thalamic nuclei (outlined by dashed black line). Region of BDA diffusion is outlined by dashed black line. Scale bar, 100 μm.
In contrast to the homogeneous appearance of pyramidal cells in the PoS→LMN projections, the PoS→ADN cells showed considerable morphological variability. Consistent with a previous report (Sikes et al., 1977), most labeled PoS→ADN cells had a spherical appearance, whereas others had the appearance of pyramidal cells. Unlike the pyramidal PoS→LMN cells, however, these deep pyramidal cells had relatively small somas, consistent with their classification as layer V/VI pyramidal cells. Furthermore, the apical dendrites of these pyramidal cells appeared to have smaller diameters than those of the layer IV pyramidal cells and most dendrites did not appear to extend to layer I. Therefore, although we cannot exclude the possibility that some PoS→ADN pyramidal cells contain dendrites that extend to layer I, the number of these cells was markedly less, relative to the homogeneous PoS→LMN pyramidal cells of layer IV. The morphological heterogeneity of PoS→ADN cells is consistent with previous suggestions that the PoS→ADN projection originates in the polymorphic layer VI (van Groen and Wyss, 1990b), although some of these cells may also be located in PoS layer V, given that these layers are not easily separable in PoS.
Morphometric characteristics of postsubiculum projection cells
To characterize the morphometric properties of PoS→LMN projection cells, we measured the dimensions of all labeled cells in the PoS for cases #54 and #55, and the results are summarized in Table 2. For case #54, the mean soma size along axis A (apical axis) was 14.1 ± 1.05 μm (range: 10.0 - 20.0 μm), and 17.0 ± 1.27 μm (range: 12.5 - 22.5 μm) along axis B (basal axis). Across cells, the mean cross-sectional area of labeled neurons was 120.1 ± 8.95 μm2 (range: 62.5 - 200.0 μm2). For case #55, the mean soma size along axis A (apical axis) was 11.7 ± 0.92 μm (range = 7.5 – 17.5 μm), and 16.3 ± 1.30 μm (range: 10.0 - 22.5 μm) along axis B (basal axis). Across cells, the mean cross-sectional area of labeled neurons was 95.5 ± 7.60 μm2 (range: 56.3 - 175.0 μm2).
Table 2.
Description of PoS neurons retrogradely labeled by biotinylated dextran amine injection into LMN or ADN.
| Target Structure (case) | Cell Type | Layer | Mean ± SEM area (μm2) | Range (μm2) | Count |
|---|---|---|---|---|---|
| LMN (case #54) | Pyramidal | IV | 120.1 ± 8.95 | 62.5 - 200.0 | 180 |
| LMN (case #55) | Pyramidal | IV | 95.5 ± 7.60 | 56.3 - 175 | 158 |
| ADN (case #56) | Pyramidal | V/VI | 56.0 ± 10.98 | 37.8 - 78.1 | 26 |
| ADN (case #56) | Spherical | V/VI | 76.7 ± 5.8 | 39.3 - 137.4 | 176 |
For PoS→ADN cells, we measured the neurons that were retrogradely labeled by BDA injection into ADN from one case (#56) that had extensive somatic labeling. For cells with a spherical appearance (n = 176), the mean height (axis A; perpendicular to the pial surface) was 8.67 ± 0.60 μm (range: 5.0 - 17.5 μm), and the mean width (axis B) was 11.73 ± 0.81μm (range: 7.5 - 17.5 μm). The mean area of spherical PoS→ADN cells was 76.7 ± 5.8 μm2 (range: 39.3 - 137.4 μm2). For layer V/VI cells with pyramidal appearance (n = 26), the mean length of axis A was 9.0 ± 1.77 μm (range: 7.5 - 12.5 μm), and the mean length of axis B was 12.4 ± 2.43 μm (range: 10.0 - 15.0 μm). The mean area, calculated as the area of a triangle, was 56.0 ± 10.98 μm2 (range: 37.5 - 78.1 μm2). In summary, the PoS projection to the anterior thalamus arises from cells with both spherical and pyramidal somas, and this heterogeneity contrasts with the consistently large pyramidal cells that comprise the PoS→LMN projection.
Discussion
The present study used retrograde tracers injected into ADN and LMN to assess the laminar origins of PoS→ADN and PoS→LMN projections. Injection of unique CTB conjugates into ADN and LMN of the same rats show that PoS→LMN neurons lie superficial to the PoS→ADN neurons, and that PoS neurons do not provide collateral projections to both nuclei. BDA injection into ADN indicate that the PoS→ADN projection cells have varied morphological characteristics consistent with their distribution in layers V/VI. BDA injection into LMN indicated that the PoS→LMN projection originates in a narrow band of large pyramidal cells in layer IV. These pyramidal cells appear to overlap lamina dissecans at the anterior portion of PoS, but are positioned deep to the lamina dissecans toward the posterior portion of PoS before disappearing at the most posterior regions.
In the HD cell circuit, the PoS is important for providing spatial information concerning visual landmarks to HD cells in the ADN (Goodridge and Taube, 1997), as well as to hippocampal place cells (Calton et al., 2003). Assuming the visual landmark information that controls HD cells originates in visual cortex, one route of input to PoS is through the dorsal visual stream, the so-called “where” pathway (Ungerleider and Mishkin, 1982; Goodale and Milner, 1992), which would project to the PoS via the parietal and possibly retrosplenial cortices. However, parietal cortex lesions, which effectively eliminate the dorsal visual stream, do not disrupt ADN HD cells' tuning relative to visual landmarks (Calton et al., 2008), and retrosplenial cortex lesions only mildly disrupt visual landmark control compared to lesions in PoS (Clark et al., 2009). Therefore, the visual information provided to HD cells from PoS must arrive via a different route, possibility via the direct projection from visual cortex to PoS layers I and III reported by Vogt and Miller (1983). The present findings suggest the PoS→LMN projection cells may be in a position to receive direct input from these visual cortex projections that terminate in PoS layers I and III, given that each layer IV pyramidal cell produces a large-diameter apical dendrite that extends into the superficial layers. At this point, we cannot infer direct visual cortex activation of PoS layer IV pyramidal cells. However, further research is warranted to determine whether these connections exist, and, if so, whether these connections are involved in providing landmark control to HD cells.
If PoS→LMN projection neurons convey visual landmark information to HD cells in LMN, then the tuning of LMN HD cells relative to visual landmarks is expected to depend on PoS. Our recent preliminary data are consistent with this hypothesis, with LMN HD cells showing a near-random preferred firing direction shift in response to rotation of a visual landmark (Yoder and Taube, unpublished observations). Along with the present results showing unique PoS projections to ADN and LMN, this finding supports the view that visual information that controls HD cells in LMN may contribute to the landmark control of HD cells in ADN solely via mammillo-thalamic projections. Furthermore, this PoS→LMN projection may be responsible for providing landmark control throughout the HD circuit, including the retrosplenial cortex, dorsal tegmental area, and entorhinal cortex (Cho and Sharp, 2001; Sharp et al., 2001; Sargolini et al., 2006). Alternatively, the PoS→LMN and PoS→ADN projections may carry functionally redundant information related to visual landmarks. However, despite the possible columnar functional organization of PoS, we are unable to conclude from the present results that the separate PoS projections to LMN and ADN are activated by similar inputs. With the exception of layer V pyramidal cells, which are known to give rise to apical dendrites to layer III, no evidence currently exists to indicate that PoS→ADN cells may be in a position to receive direct activation by inputs from visual cortex, which terminate in layers I and III. The confinement of most dendrites of PoS→ADN cells to the deep layers contrasts with the apical dendrites of PoS→LMN cells, many of which appear to extend to layer I (Figure 6). Therefore, the present results indicate that the PoS→ADN and PoS→LMN projection cells may be activated by distinct signals, but further investigation is warranted to determine whether connectivity across different lamina within the PoS may allow the projection of visual landmark-related information to cells within the HD circuit. For example, it is possible that superficial layer I/III cells receive visual cortical inputs and send collaterals to deep layer neurons in PoS, which in turn could project to LMN or ADN. In any case, the PoS→LMN projection appears to provide an important component of directional perception, and damage to these fibers is likely to markedly disrupt an animal's ability to rely on visual information for accurate navigation.
Figure 6.
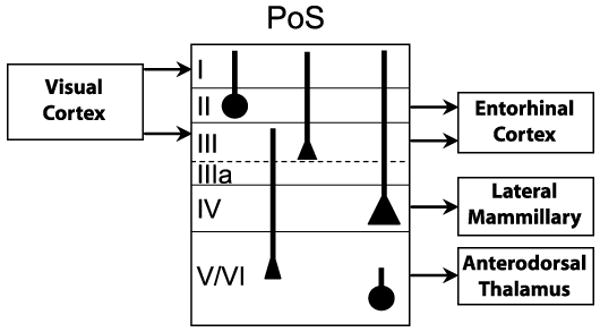
PoS projections to LMN and ADN originate in distinct cortical layers. Neurons terminating in the ADN are located in PoS layers V/VI, and include heterogeneous cell types. In contrast, PoS neurons that terminate in LMN consist of large pyramidal cells that lie in PoS layer IV. These layer IV pyramidal cells give rise to apical dendrites that are in a position to receive visual cortical inputs, which terminate in layers I and III.
Consistent with the hypothesized dependence of spatial perception on mammillary function, lesions of the mammillary bodies or the mammillothalamic tract have been found to impair rats' ability to utilize visual cues to navigate to a particular location (Saravis et al., 1990; Vann and Aggleton, 2003; but see Jarrard et al., 1984). In contrast, mammillary circuits are not necessary for navigation directly to a visible goal (beacon navigation) (Sutherland and Rodriguez, 1989), suggesting mammillary involvement in spatial memory is limited to the configuration of distal landmarks, or to the animal's location or directional heading relative to these landmarks. This impairment of visual cue use does not generalize to conditional associative tasks, however, as rats with mammillary lesions were able to correctly associate visual cues with spatial locations (Sziklas and Petrides, 2000). Furthermore, the mammillary region appears to be specifically important for spatial tasks that require memory, as spatial performance was impaired when recall of the goal location (relative to visual landmarks) was required over a delay period (Saravis et al., 1990; Sziklas and Petrides, 1993). It is important to note that this latter experiment (Sziklas and Petrides, 1993) indicated a performance difference between animals with limited mammillary lesions (medial and supramammillary) and those with extensive mammillary lesions (including medial, lateral, and supramammillary, along with the medial portion of the ventral tegmental area and medial forebrain bundle): animals with limited damage to the mammillary region showed no impairment on the radial arm maze, whereas animals with extensive mammillary damage showed impairment similar to that of animals with hippocampal lesions. It is therefore possible that the observed spatial deficits were induced by damage to the LMN. In any case, further experimentation is necessary to determine the role of LMN in spatial memory processes.
If, as suggested by our anatomical results, visual landmark information first gains control of the HD cell signal at LMN, then this information may be projected bilaterally to the ADN via the mammillo-thalamic tract (Blair et al., 1998; Gonzalo-Ruiz et al., 1998). This suggestion is supported by the demonstration of impaired spatial task performance following mammillo-thalamic tract damage (Vann and Aggleton, 2003, Vann et al., 2003). Accordingly, if PoS input to LMN is necessary for reliable HD representation relative to landmarks, disruption of LMN HD cell function in relation to visual landmarks may underlie the spatial memory impairments observed during task performance on radial arm and water mazes following PoS lesions (Taube et al., 1992). Alternatively, PoS involvement in spatial cognition may not include the mammillary nuclei, given that LMN provides HD information to ADN, and damage to ADN only mildly disrupted landmark control of hippocampal place cells (Calton et al., 2003).
Summary
In summary, the present study provides the first conclusive evidence that the PoS projection to LMN originates from deep pyramidal cells that are anatomically distinct from the heterogeneous population of PoS cells that project to the anterior thalamus. These large pyramidal PoS→LMN cells send apical dendrites to the superficial layers of PoS, where they may receive direct input from visual cortex. Thus, the LMN appears to be the first point at which visual landmark information enters the HD cell circuit, and the LMN may convey this landmark information to the anterior thalamus via the mammillo-thalamic tract. Nevertheless, we cannot exclude the functional organization of cortical columns, which may allow redundant PoS projections to LMN and ADN, despite the fact that they originate from distinct layers in PoS. In any event, further experimentation is necessary to determine the functional roles of these connections within the HD cell circuit.
Acknowledgments
Supported by: Grant Sponsor: NIDCD; Grant Number: F32 DC84812 to RMY
Grant Sponsor: NINDS; Grant Number: R01 NS053907 to JST
References
- Allen GV, Hopkins DA. Mammillary body in the rat: topography and synaptology of projections from the subicular complex, prefrontal cortex, and midbrain tegmentum. J Comp Neurol. 1989;286:311–336. doi: 10.1002/cne.902860303. [DOI] [PubMed] [Google Scholar]
- Bassett JP, Tullman ML, Taube JS. Lesions of the tegmento-mammillary circuit in the head direction system disrupts the head direction signal in the anterior thalamus. J Neurosci. 2007;27:7564–7577. doi: 10.1523/JNEUROSCI.0268-07.2007. [DOI] [PMC free article] [PubMed] [Google Scholar]
- Biazoli CE, Jr, Goto M, Campos AM, Canteras NS. The supragenual nucleus: A putative relay station for ascending vestibular signs to head direction cells. Brain Res. 2006;1094:138–148. doi: 10.1016/j.brainres.2006.03.101. [DOI] [PubMed] [Google Scholar]
- Blackstad TW. Commissural connections of the hippocampal region in the rat, with special reference to their mode of termination. J Comp Neurol. 1956;105:417–537. doi: 10.1002/cne.901050305. [DOI] [PubMed] [Google Scholar]
- Blair HT, Cho J, Sharp PE. Role of the lateral mammillary nucleus in the rat head direction circuit: a combined single unit recording and lesion study. Neuron. 1998;21:1387–1397. doi: 10.1016/s0896-6273(00)80657-1. [DOI] [PubMed] [Google Scholar]
- Boccara CN, Sargolini F, Hult-Thoresen VM, Witter MP, Moser EI, Moser MB. Program No 94.9. 2008 Neuroscience Meeting Planner. Washington, DC: Society for Neuroscience; 2008. Laminar analysis of grid cells in presubiculum and parasubiculum. 2008. Online. [Google Scholar]
- Caballero-Bleda M, Witter MP. Regional and Laminar organization of projections from the presubiculum and parasubiculum to the entorhinal cortex: an anterograde tracing study in the rat. J Comp Neurol. 1993;328:115–129. doi: 10.1002/cne.903280109. [DOI] [PubMed] [Google Scholar]
- Calton JL, Stackman RW, Goodridge JP, Archey WB, Dudchenko PA, Taube JS. Hippocampal place cell instability following lesions of the head direction cell network. J Neurosci. 2003;23:9719–9731. doi: 10.1523/JNEUROSCI.23-30-09719.2003. [DOI] [PMC free article] [PubMed] [Google Scholar]
- Calton JL, Turner CS, Cyrenne DL, Lee BR, Taube JS. Landmark control and updating of self-movement cues are largely maintained in head direction cells after lesions of the posterior parietal cortex. Behav Neurosci. 2008;122:827–840. doi: 10.1037/0735-7044.122.4.827. [DOI] [PMC free article] [PubMed] [Google Scholar]
- Cho J, Sharp PE. Head direction, place, and movement correlates for cells in the rat retrosplenial cortex. Behav Neurosci. 2001;115:3–25. doi: 10.1037/0735-7044.115.1.3. [DOI] [PubMed] [Google Scholar]
- Clark BJ, Bassett JP, Wang SS, Taube JS. Impaired head direction cell representation in the anterodorsal thalamus after lesions of the retrosplenial cortex. J Neurosci. 2009 doi: 10.1523/JNEUROSCI.3380-09.2010. in press. [DOI] [PMC free article] [PubMed] [Google Scholar]
- Conrad CD, Stumpf WE. Direct visual input to the limbic system: crossed retinal projections to the nucleus anterodorsalis thalami in the tree shrew. Exp Brain Res. 1975;23:141–149. doi: 10.1007/BF00235456. [DOI] [PubMed] [Google Scholar]
- Donovan MK, Wyss JM. Evidence for some collateralization between cortical and diencephalic efferent axons of the rat subicular cortex. Brain Res. 1983;259:181–192. doi: 10.1016/0006-8993(83)91249-0. [DOI] [PubMed] [Google Scholar]
- Fyhn M, Molden S, Witter MP, Moser EI, Moser MB. Spatial representation in the entorhinal cortex. Science. 2004;305:1258–1264. doi: 10.1126/science.1099901. [DOI] [PubMed] [Google Scholar]
- Gonzalo-Ruiz A, Morte L, Sanz JM. Glutamate/aspartate and leu-enkephalin immunoreactivity in mammillothalamic projection neurons of the rat. Brain Res Bull. 1998;47:565–574. doi: 10.1016/s0361-9230(98)00077-x. [DOI] [PubMed] [Google Scholar]
- Goodale MA, Milner AD. Separate visual pathways for perception and action. Trends Neurosci. 1992;15:20–25. doi: 10.1016/0166-2236(92)90344-8. [DOI] [PubMed] [Google Scholar]
- Goodridge JP, Taube JS. Preferential use of the landmark navigational system by head direction cells in rats. Behav Neurosci. 1995;109:49–61. doi: 10.1037//0735-7044.109.1.49. [DOI] [PubMed] [Google Scholar]
- Goodridge JP, Taube JS. Interaction between the postsubiculum and anterior thalamus in the generation of head direction cell activity. J Neurosci. 1997;17:9315–9330. doi: 10.1523/JNEUROSCI.17-23-09315.1997. [DOI] [PMC free article] [PubMed] [Google Scholar]
- Hafting T, Fyhn M, Molden S, Moser BB, Moser EI. Microstructure of a spatial map in the entorhinal cortex. Nature. 2005;436:801–806. doi: 10.1038/nature03721. [DOI] [PubMed] [Google Scholar]
- Ishizuka N. Laminar organization of the pyramidal cell layer of the subiculum in the rat. J Comp Neurol. 2001;435:89–110. doi: 10.1002/cne.1195. [DOI] [PubMed] [Google Scholar]
- Itaya SK, Van Hoesen GW, Jenq CB. Direct retinal input to the limbic system of the rat. Brain Res. 1981;226:33–42. doi: 10.1016/0006-8993(81)91081-7. [DOI] [PubMed] [Google Scholar]
- Jarrard LE, Okaichi H, Steward O, Goldschmidt RB. On the role of hippocampal connections in the performance of place and cue tasks: comparisons with damage to hippocampus. Behav Neurosci. 1984;98:946–954. doi: 10.1037//0735-7044.98.6.946. [DOI] [PubMed] [Google Scholar]
- Lorente de Nó Studies on the structure of the cerebral cortex I. the area entorhinalis. Journal für Psychologie und Neurologie. 1933;45:381–438. [Google Scholar]
- Namura S, Takada M, Kikuchi H, Mizuno N. Topographical organization of subicular neurons projecting to subcortical regions. Brain Res Bull. 1994;35:221–231. doi: 10.1016/0361-9230(94)90126-0. [DOI] [PubMed] [Google Scholar]
- Paxinos G, Watson C. The Rat Brain. San Diego, CA: Academic Press; 1998. [Google Scholar]
- Saravis S, Sziklas V, Petrides M. Memory for places and the region of the mammillary bodies in rats. Eur J Neurosci. 1990;2:556–564. doi: 10.1111/j.1460-9568.1990.tb00446.x. [DOI] [PubMed] [Google Scholar]
- Sargolini F, Fyhn M, Hafting T, McNaughton BL, Witter MP, Moser MB, Moser EI. Conjunctive representation of position, direction, and velocity in entorhinal cortex. Science. 2006;312:758–762. doi: 10.1126/science.1125572. [DOI] [PubMed] [Google Scholar]
- Seki M, Zyo K. Anterior thalamic afferents from the mamillary body and the limbic cortex in the rat. J Comp Neurol. 1984;229:242–256. doi: 10.1002/cne.902290209. [DOI] [PubMed] [Google Scholar]
- Sharp PE. Multiple spatial/behavioral correlates for cells in the rat postsubiculum: multiple regression analysis and comparison to other hippocampal areas. Cereb Cortex. 1996;6:238–259. doi: 10.1093/cercor/6.2.238. [DOI] [PubMed] [Google Scholar]
- Sharp PE, Tinkelman A, Cho J. Angular velocity and head direction signals recorded from the dorsal tegmental nucleus of gudden in the rat: implications for path integration in the head direction cell circuit. Behav Neurosci. 2001;115:571–588. [PubMed] [Google Scholar]
- Shibata H. Descending projections to the mammillary nuclei in the rat, as studied by retrograde and anterograde transport of wheat germ agglutinin-horseradish peroxidase. J Comp Neurol. 1989;285:436–452. doi: 10.1002/cne.902850403. [DOI] [PubMed] [Google Scholar]
- Shibata H. Topographic organization of subcortical projections to the anterior thalamic nuclei in the rat. J Comp Neurol. 1992;323:117–127. doi: 10.1002/cne.903230110. [DOI] [PubMed] [Google Scholar]
- Shibata H. Direct projections from the anterior thalamic nuclei to the retrohippocampal region in the rat. J Comp Neurol. 1993;337:431–445. doi: 10.1002/cne.903370307. [DOI] [PubMed] [Google Scholar]
- Sikes RW, Chronister RB, White LE., Jr Origin of the direct hippocampus--anterior thalamic bundle in the rat: a combined horseradish peroxidase--Golgi analysis. Exp Neurol. 1977;57:379–395. doi: 10.1016/0014-4886(77)90074-7. [DOI] [PubMed] [Google Scholar]
- Song P, Wang XJ. Angular path integration by moving “hill of activity”: a spiking neuron model without recurrent excitation of the head-direction system. J Neurosci. 2005;25:1002–1014. doi: 10.1523/JNEUROSCI.4172-04.2005. [DOI] [PMC free article] [PubMed] [Google Scholar]
- Sutherland RJ, Rodriguez AJ. The role of the fornix/fimbria and some related structures in place learning and memory. Behav Brain Res. 1989;32:265–277. doi: 10.1016/s0166-4328(89)80059-2. [DOI] [PubMed] [Google Scholar]
- Swanson LW. Brain Maps: Structure of the Rat Brain. New York, NY: Elsevier; 1992. [Google Scholar]
- Sziklas V, Petrides M. Memory impairments following lesions to the mammillary region of the rat. Eur J Neurosci. 1993;5:525–540. doi: 10.1111/j.1460-9568.1993.tb00518.x. [DOI] [PubMed] [Google Scholar]
- Sziklas V, Petrides M. Selectivity of the spatial learning deficit after lesions of the mammillary region in rats. Hippocampus. 2000;10:325–328. doi: 10.1002/1098-1063(2000)10:3<325::AID-HIPO12>3.0.CO;2-D. [DOI] [PubMed] [Google Scholar]
- Taube JS. The head direction signal: origins and sensory-motor integration. Ann Rev Neurosci. 2007;30:181–207. doi: 10.1146/annurev.neuro.29.051605.112854. [DOI] [PubMed] [Google Scholar]
- Taube JS, Bassett JP. Persistent neural activity in head direction cells. Cereb Cortex. 2003;13:1162–1172. doi: 10.1093/cercor/bhg102. [DOI] [PubMed] [Google Scholar]
- Taube JS, Burton HL. Head direction cell activity monitored in a novel environment and during a cue conflict situation. J Neurophysiol. 1995;74:1953–1971. doi: 10.1152/jn.1995.74.5.1953. [DOI] [PubMed] [Google Scholar]
- Taube JS, Kesslak JP, Cotman CW. Lesions of the rat postsubiculum impair performance on spatial tasks. Behav Neural Biol. 1992;57:131–143. doi: 10.1016/0163-1047(92)90629-i. [DOI] [PubMed] [Google Scholar]
- Taube JS, Muller RU, Ranck JB., Jr Head-direction cells recorded from the postsubiculum in freely moving rats. I. Description and quantitative analysis. J Neurosci. 1990a;10:420–435. doi: 10.1523/JNEUROSCI.10-02-00420.1990. [DOI] [PMC free article] [PubMed] [Google Scholar]
- Taube JS, Muller RU, Ranck JB., Jr Head-direction cells recorded from the postsubiculum in freely moving rats. II. Effects of environmental manipulations. J Neurosci. 1990b;10:436–447. doi: 10.1523/JNEUROSCI.10-02-00436.1990. [DOI] [PMC free article] [PubMed] [Google Scholar]
- van Groen T, Wyss JM. Connections of the retrosplenial granular a cortex in the rat. J Comp Neurol. 1990a;300:593–606. doi: 10.1002/cne.903000412. [DOI] [PubMed] [Google Scholar]
- van Groen T, Wyss JM. The postsubicular cortex in the rat: characterization of the fourth region of the subicular cortex and its connections. Brain Res. 1990b;529:165–177. doi: 10.1016/0006-8993(90)90824-u. [DOI] [PubMed] [Google Scholar]
- van Groen T, Wyss JM. Connections of the retrosplenial dysgranular cortex in the rat. J Comp Neurol. 1992;315:200–216. doi: 10.1002/cne.903150207. [DOI] [PubMed] [Google Scholar]
- van Groen T, Wyss JM. Projections from the anterodorsal and anteroventral nucleus of the thalamus to the limbic cortex in the rat. J Comp Neurol. 1995;358:584–604. doi: 10.1002/cne.903580411. [DOI] [PubMed] [Google Scholar]
- van Groen T, Wyss JM. Connections of the retrosplenial granular b cortex in the rat. J Comp Neurol. 2003;463:249–263. doi: 10.1002/cne.10757. [DOI] [PubMed] [Google Scholar]
- Vann SD, Aggleton JP. Evidence of a spatial coding deficit in rats with lesions of the mammillary bodies or mammillothalamic tract. J Neurosci. 2003;23:3506–3514. doi: 10.1523/JNEUROSCI.23-08-03506.2003. [DOI] [PMC free article] [PubMed] [Google Scholar]
- Vann SD, Honey RC, Aggleton JP. Lesions of the mammillothalamic tract impair the acquisition of spatial but not non-spatial contextual conditional discriminations. Eur J Neurosci. 2003;18:2413–2416. doi: 10.1046/j.1460-9568.2003.02959.x. [DOI] [PubMed] [Google Scholar]
- Vercelli A, Marini G, Tredici G. Anatomical organization of the telencephalic connections of the parafascicular nucleus in adult and developing rats. Eur J Neurosci. 2003;18:275–289. doi: 10.1046/j.1460-9568.2003.02743.x. [DOI] [PubMed] [Google Scholar]
- Vogt BA, Miller MW. Cortical connections between rat cingulate cortex and visual, motor, and postsubicular cortices. J Comp Neurol. 1983;216:192–210. doi: 10.1002/cne.902160207. [DOI] [PubMed] [Google Scholar]
- Witter MP, Amaral DG. Hippocampal formation. In: Paxinos G, editor. The Rat nervous System. 3rd. Elsevier: Academic Press; New York, NY: 2004. pp. 635–704. [Google Scholar]