

Abstract
Critical speed (CS) constitutes an important metabolic and performance demarcator. However, active skeletal muscle blood flow distribution specifically surrounding CS remains unknown. We tested the hypotheses that CS could be accurately determined in the running rat and that measurement of hindlimb inter- and intramuscular blood flow below and above CS would support that the greatest muscle fibre recruitment above, relative to below, CS occurs in the predominantly glycolytic muscles. Seven male Sprague–Dawley rats performed five constant-speed tests to exhaustion at speeds between 95 and 115% of the speed that elicited  to determine CS. Subsequent constant-speed tests were performed at speeds incrementally surrounding CS to determine time to exhaustion,
  , and hindlimb muscle blood flow distribution. Speed and time to exhaustion conformed to a hyperbolic relationship (r2= 0.92 ± 0.03) which corresponded to a linear 1/time function (r2= 0.93 ± 0.02) with a CS of 48.6 ± 1.0 m min−1. Time to exhaustion below CS was ∼5× greater (P < 0.01) than that above. Below CS
  stabilized at a submaximal value (58.5 ± 2.5 ml kg−1 min−1) whereas above CS
  (81.7 ± 2.5 ml kg−1 min−1) increased to
  (84.0 ± 1.8 ml kg−1 min−1, P > 0.05 vs. above CS). The 11 individual muscles or muscle parts that evidenced the greatest blood flow increases above, relative to below, CS were composed of ≥69% Type IIb/d/x muscle fibres. Moreover, there was a significant correlation (P < 0.05, r= 0.42) between the increased blood flow above expressed relative to below CS and the percentage Type IIb/d/x fibres found in the individual muscles or muscle parts. These data validate the powerful CS construct in the rat and identify that running above CS, relative to below CS, incurs disproportionate blood flow increases (indicative of recruitment) in predominantly highly glycolytic muscle fibres.
Introduction
The hyperbolic relationship between power and time to exhaustion at high intensities, first demonstrated experimentally for tension development by a synergic muscle group by Monod & Scherer (1965), is a fundamental principle of integrative physiology and human performance. The power-time asymptote of this relationship represents a ‘critical’ power (CP) which constitutes the physiological boundary between heavy (below) and severe (above) intensity exercise. Empirical evidence in humans has demonstrated that during constant-rate exercise below CP, intramuscular pH and concentrations of phosphocreatine (PCr) and inorganic phosphate (Pi), blood lactate concentration, and O2 uptake ( ) stabilize and exercise of sustained duration may be performed (Poole et al. 1988; Jones et al. 2008). Conversely, at intensities above CP, intramuscular pH and [PCr] fall precipitously and blood [lactate], intramuscular [Pi] and pulmonary VO2 rise inexorably and sustained exercise is impossible (Poole et al. 1988; Jones et al. 2008).
Despite the well-described metabolic consequences of CP, little is known regarding the mechanistic underpinnings of the distinct  profiles and disproportionate exercise intolerance extant above versus below CP. For example, at exercise intensities specifically surrounding CP it is at present unclear how possible changes in recruitment patterns vary spatially or temporally with respect to muscle fibre-type composition. Moreover, the increasing metabolic inefficiency (systematically rising
  despite constant power, termed the
  slow component) as exercise progresses beyond ∼3 min above CP may result from: (1) progressive recruitment of additional fibres as those that were initially recruited fatigue (Krustrup et al. 2004; Endo et al. 2007), and/or (2) progressively developing inefficiency of already contracting fibres (Zoladz et al. 2008; Hepple et al. 2010). One way to investigate this issue is to examine active skeletal muscle blood flow distribution at speeds below and above this critical metabolic rate.
Due to technical and ethical limitations, resolution of blood flow distribution within and among locomotory skeletal muscle is impossible in humans. Conversely, the rat constitutes a valid and reliable model in which the resolution of inter- and intramuscular hindlimb blood flow responses to running exercise may be determined (Laughlin & Armstrong, 1982; Armstrong & Laughlin, 1983, 1985). However, it is pertinent to the present investigation that critical speed (CS, the running exercise equivalent of CP) has yet to be investigated systematically in this species and, therefore, blood flow responses specifically relative to CS have not been determined. Thus, the purpose of the present investigation was to determine CS in the rat, validate it with respect to metabolic responses and performance via time to exhaustion and  measurements at speeds above and below CS, and examine inter- and intramuscular hindlimb blood flow at those same speeds. Specifically, we tested the hypotheses that (1) exercise at a constant speed above CS could not be maintained beyond ∼15 min, which would be disproportionately lower than compared with below CS exercise, (2) the
  measured below CS would reach only submaximal values whereas above CS it would not be different from the directly measured
  , and (3) blood flow would be increased disproportionately in muscles composed of primarily glycolytic (Type IIb/d/x) muscle fibres compared to more oxidative (Type I/IIa) muscles at speeds above, relative to below, CS.
Methods
Animal selection and care
Seven male Sprague–Dawley rats (body mass: 344 ± 12 g, age: 8–10 weeks) participated in this investigation. All rats were purchased from Charles River Laboratories (Boston, MA, USA) and housed in accredited animal facilities at Kansas State University. Rats were maintained two per cage in a temperature- (21°C) and light- (12:12 h light/dark cycle) controlled environment with standard rat chow and water provided ad libitum. All experimental procedures detailed here were conducted according to guidelines established by The Journal of Physiology (Drummond, 2009) and approved by the Institutional Animal Care and Use Committee of Kansas State University.
Experimental protocol
All rats completed a familiarization phase, which consisted of five to six runs on a custom-built motor-driven treadmill for ∼5 min each. For the first several runs, the treadmill speed was maintained at ∼20–25 m min−1 (up a 5% grade which was maintained throughout the experimental protocol) throughout the duration of the run. For the last several runs, the speed of the treadmill was increased progressively over the last minute to ∼40–45 m min−1 in order to familiarize the rats with high speed running.
After completion of the familiarization phase, all rats performed a maximal incremental exercise test in order to determine the speed that elicited  (
( ). Rats were placed inside a metabolic chamber (14.5 × 43 × 7 cm) designed to fit into one stall on the treadmill. Ambient air was drawn through the chamber at a rate of 5000 ml min−1 (standard temperature and pressure dry) via a vacuum pump (Neptune-Dyna, model 4K, Dover, NJ, USA), through drierite (anhydrous CaSO4) and then through a flowmeter (Fischer-Porter model 10A1378, Burr Ridge, IL, USA). This ‘dry’ gas was delivered subsequently to an online O2 analyser (model S-3A/I; AEI Technologies, Pittsburgh, PA, USA). The analyser was calibrated before and after each exercise test in which
  was measured using precision-mixed gases that spanned the expected range of gas concentrations based on previous investigations (e.g. Musch et al. 1988). The maximal exercise tests were initiated with each rat running at 25 m min−1 for 2–3 min which served as a warm-up. During the second stage (2–3 min), the speed of the treadmill was increased to 40 m min−1. Thereafter, the treadmill speed was increased progressively in a ramp-like manner by ∼5–10 m min−1 every minute until the rat was unable or unwilling to keep pace with the treadmill belt. Both the speed of the treadmill and the corresponding
  were monitored and recorded continuously throughout the test. The criterion for a successful test was the observation of no increase in
  despite further increases in treadmill speed. Each rat was weighed upon test termination, and the results reported for
  measurements here reflect the rats’ post-exercise test weight. We have reported recently that this protocol produces highly reproducible
  measurements in untrained rats over a period of at least 5 weeks (Copp et al. 2009).
Subsequent to the maximal exercise test the speeds corresponding to 95, 100, 105, 110, and 115% of the  were calculated and each rat performed five runs to exhaustion, in random order, at these speeds. For each constant-speed test, rats were given a 2 min warm-up at 20–25 m min−1 followed by 1 min of quiet resting. To start the test, the treadmill speed was increased rapidly over a ∼10 s period to the desired speed. Rats were encouraged to run by applying manual bursts of high pressure air at the hindlimbs whenever they drifted towards the back of the treadmill lane. The tests were terminated whenever the rat could no longer maintain pace with the treadmill belt despite obvious exertion of effort and the time to exhaustion was measured to the nearest tenth of a second. The following criteria constituted a successful constant-speed test: (1) the ability of the rat to quickly adapt to the treadmill speed at the beginning of the test, therefore not ‘wasting’ any energy, (2) a noticeable change in gait (i.e. lowering of the hindquarters and a rising of the snout) preceding exhaustion, which is indicative of exertion of maximal effort (Copp et al. 2009), and (3) marked attenuation of the righting reflex when placed on their back in the supine position (an unexhausted rat will generally attempt to right itself in <1 s). If any of these criteria were not met the test was repeated on a different day. Importantly, the same experienced investigators administered all exercise tests in order to minimize differences during the subjective determination of exhaustion (i.e. observations of gait). The reproducibility of time to exhaustion for the constant speed tests was assessed by having rats repeat one constant-speed test at a randomly assigned %
 . The average coefficient of variation between the repeat and criterion run for the individual animals was 6.4 ± 1.1% (range 3.7–8.3%) indicating excellent reproducibility of the exhaustion bouts.
Data modelling
Following the successful completion of the tests, the CS and finite distance capacity (D′) were determined for each rat with three different models (Poole et al. 1988; Gaesser et al. 1995; Jones et al. 2008): (1) the hyperbolic speed-time model (time =D′/(speed – CS)) where the asymptote of the hyperbolic curve is the CS and the curvature constant is the D′, (2) the linear distance–time model, where the distance run is plotted as a function of the time to exhaustion (distance = CS × time +D′) and the slope of the regression line is the CS and the intercept is the D′, and (3) the linear 1/time model (speed =D′× 1/time + CS) where speed is plotted as a function of the inverse of time to exhaustion and the intercept of the regression line is the CS and the slope is the D′. Given that rats ran up an incline, D′ in vertical meters was multiplied by the rats’ average weight in kg from the constant-speed tests to determine m kg, then converted to joules (J) using the relationship: 1 J = 0.103155 m kg, which represents a finite work capacity (W′). The use of W′ presently facilitates across species and exercise mode comparisons. Each rat then performed additional exercise tests at the speeds corresponding to the y-intercepts of the upper and lower limit of the 95% confidence interval (c.i.) from the linear 1/time model (see Discussion for more details). Specifically, additional constant-speed tests above and below CS were performed in random order to determine time to exhaustion and  (see above for
  measurement details). A final
  test was then performed in order to determine if changes in
  had occurred to that point in the protocol. Finally, blood flow measurements (see below for details) below and above CS were performed last due to the terminal nature of the procedure. With the exception of the tests to determine blood flow above and below CS which were performed on the same day, a minimum of 24 h (up to 48 h) rest was given in between all exercise tests. For each rat the entire experimental protocol lasted ∼3 weeks.
Hindlimb skeletal muscle blood flow measurement above and below CS
All animals were anaesthetized initially with 5% isoflurane gas. While being maintained on a 2% isoflurane–O2 mixture, one catheter (PE-10 connected to PE-50, Clay Adams Brand, Sparks, MD, USA) was placed in the ascending aorta via the right carotid artery and another was placed in the caudal (tail) artery, as described previously (Musch & Terrell, 1992). Both catheters were tunnelled subcutaneously to the dorsal aspect of the cervical region and exteriorized through a puncture wound in the skin. The incisions were then closed, anaesthesia was terminated, and the animal was given =1 h to recover.
Given the potential difficulty of having rats run at high speeds following a previous microsphere injection, the first blood flow measurement was performed above CS in all animals. To begin, exercise was initiated, and the speed of the treadmill was increased progressively to the desired speed during the next ∼10–15 s. Each rat then exercised steadily for another ∼3 min. After ∼3.5 min of total exercise time, blood withdrawal from the tail artery catheter was initiated at a rate of 0.25 ml min−1. Heart rate (HR) and mean arterial blood pressure (MAP) were measured simultaneously and recorded via the carotid artery catheter for ∼10 s. Subsequently, the carotid artery catheter was disconnected from the pressure transducer and ∼0.5–0.6 × 10⁶ 15 μm diameter microspheres (46Sc or 85Sr in random order: Perkin Elmer Life and Analytical Sciences, Waltham, MA, USA) were injected into the aortic arch of the exercising animal to determine hindlimb blood flow. Immediately following the microsphere injection, an arterial blood sample (∼0.2 ml) was taken from the carotid artery catheter for determination of blood [lactate]. Immediately following the blood sampling, exercise was terminated and each rat was allowed a minimum of 45 min to recover. After 45 min of recovery from the initial exercise bout a resting arterial blood sample was taken. Subsequently, a second bout of exercise was initiated and the speed of the treadmill was increased progressively during the next ∼10–15 s to the below CS speed. After ∼3.5 min of total exercise time, microsphere injection (differently labelled from the first injection) and blood sampling procedures were performed exactly as described above for the first bout of exercise. Each animal was then killed via an overdose of pentobarbital (=50 mg (kg body weight)−1) via the carotid artery catheter. The thorax was opened, the carotid artery catheter was visualized and placement into the aortic arch was confirmed. The right and left kidneys and individual muscles and muscle parts of both hindlimbs were identified and removed. The tissues were blotted, weighed and placed immediately into test tubes for radioactivity counting. The fibre-type composition analysis of each individual muscle or muscle part by Delp & Duan (1996) was used to determine relationships between blood flow and muscle fibre type.
The radioactivity of each tissue was determined via a gamma scintillation counter (Packard Auto Gamma Spectrometer, model 5230, Downers Grove, IL, USA). Taking into account cross-talk between isotopes, blood flows to each tissue were determined using the reference sample method (Musch & Terrell, 1992) and expressed as millilitres per minute per 100 g of tissue (ml min−1 (100 g)−1). Adequate mixing of the microspheres was evaluated and verified in all rats for each injection by the demonstration of a <15% difference between blood flow to the right and left kidneys and/or to the right and left hindquarter musculature.
Statistical analyses
All data are presented as means ± standard error of the mean (s.e.m.). Comparisons among the r2 obtained from the hyperbolic model and linear transformations,  measurements, blood [lactate], HR and MAP were made via ANOVAs with repeated measures using Student–Newman–Keuls post hoc tests where appropriate. Student's paired t tests was used to compare the times to exhaustion and skeletal muscle blood flows measured at speeds above and below CS. The z-statistic was calculated for several variables to determine differences from zero. Pearson's product moment correlations and linear regression analyses were performed to examine relationships between variables. Significance was accepted at P < 0.05.
Results
Determination of critical speed
The average  at the beginning of the experimental protocol was 87.2 ± 2.6 ml kg−1 min−1 with an average
  of 61.6 ± 1.5 m min−1. The average speeds and times to exhaustion during constant-speed tests corresponding to between 95 and 115% of
  are presented in Table 1. Mean parameters and fits from the three CS estimation models are presented in Table 2 with representative fits of the three models from the same rat depicted in Fig. 1. There was a trend towards a significant correlation (r= 0.71, P= 0.07) between
  and estimated CS from the hyperbolic model.
Table 1.
Speeds and times to exhaustion for constant-speed tests used to determine critical speed
%
|
Speed (m min−1) | Time to exhaustion (s) |
|---|---|---|
| 95 | 58.5 ± 1.4 | 480.4 ± 128.9 |
| 100 | 61.6 ± 1.5 | 414.9 ± 162.7 |
| 105 | 64.7 ± 1.5 | 326.3 ± 107.9 |
| 110 | 67.8 ± 1.8 | 263.8 ± 71.1 |
| 115 | 70.9 ± 1.7 | 212.9 ± 59.4 |
Data are means ±s.e.m. % , percentage of the speed that elicits
  .
.
Table 2.
Comparison among the hyperbolic, linear distance/time and linear 1/time models for the estimation of critical speed (CS) and associated parameters
| Hyperbolic | Linear distance-time | Linear 1/time | |
|---|---|---|---|
| CS (m min−1) | 47.2 ± 1.1 | 48.5 ± 0.8 | 48.6 ± 1.0 |
%
|
76.6 ± 1.4 | 78.9 ± 1.1 | 79.1 ± 2.0 |
| Co-var (%) | 6.2 | 4.2 | 5.3 |
| W′ (J) | 331.0 ± 99.1 | 269.5 ± 48.2 | 265.2 ± 49.4 |
| Co-var (%) | 85.5 | 52.4 | 54.4 |
| r2 | 0.92 ± 0.03 | 0.99 ± 0.01* | 0.93 ± 0.02 |
Data are means ±s.e.m. % , percentage of the speed that elicited
  constituting CS; Co-var, coefficient of variation; W′, model parameter representing a finite work capacity above CS. *P < 0.05 versus hyperbolic and linear 1/time models.
Figure 1. Critical speed (CS) and W′ (model parameter representing a finite work capacity above CS) determined for the same representative rat using three different models.
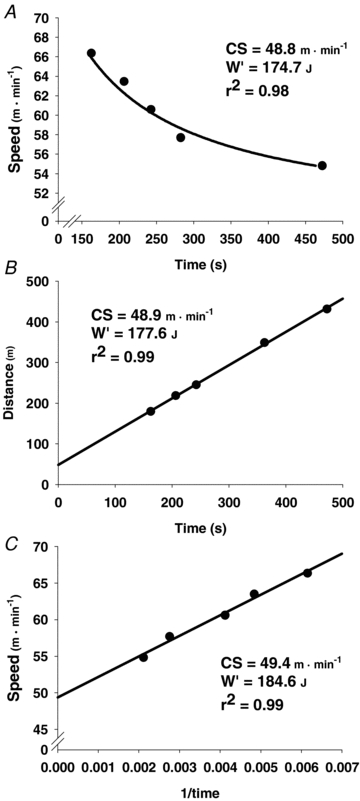
A, hyperbolic model; B, linear distance-time model; C, linear 1/time model.
 and time to exhaustion measurements
The lower (below CS) and upper (above CS) limits of the 95%c.i. of estimated CS from the linear 1/time model were 41.3 ± 1.8 m min−1 (P < 0.001 versus sVo2max and corresponding to 67 ± 3% of  ) and 56.1 ± 1.1 m min−1 (P < 0.001 versus
 and corresponding to 91 ± 2% of
  ), respectively. The time to exhaustion for the constant speed tests at these speeds was ∼5× greater (P < 0.001) below CS versus above CS (Fig. 2). The
  measurements above and below CS and their comparisons to the pre- and post-protocol
  tests are presented in Fig. 3. Importantly, there were no differences (P > 0.05) among the
  values obtained during the pre- (87.2 ± 2.6 ml kg−1 min−1) and post-protocol (84.0 ± 1.8 ml kg−1 min−1)
  and above-CS exercise tests (81.7 ± 2.5 ml kg−1 min−1), which differed markedly from the below-CS test (58.5 ± 2.5 ml kg−1 min−1, P < 0.05 versus all other
  measurements). Specifically, the absolute (2.3 ± 1.7 ml kg−1 min−1) and relative (3 ± 2%) differences between the post-protocol
  test and that performed above CS were not different from zero (z-statistic P > 0.05 for both), indicating that
  was achieved at the running speeds above CS.
Figure 2. Individual times to exhaustion during constant speed tests above (56.1 ± 1.1 m min−1) and below (41.3 ± 1.8 m min−1) critical speed (CS).
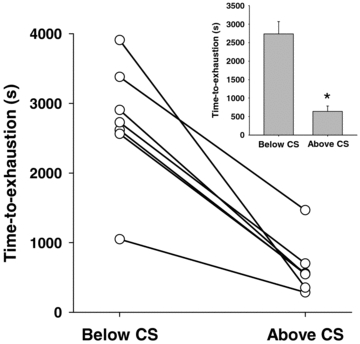
Inset, average time to exhaustion. *P < 0.05 versus below CS.
Figure 3. Whole body oxygen uptake ( ) measured during pre- and post-protocol maximal exercise tests and constant speed tests at speeds above and below critical speed (CS).
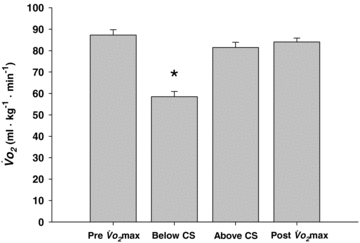
*P < 0.05 versus all other tests.
Hindlimb skeletal muscle blood flow
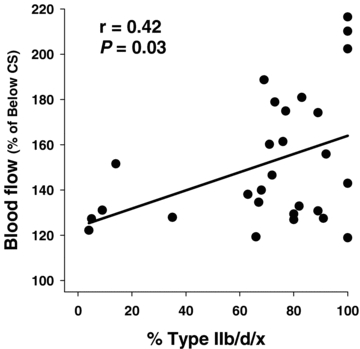
HR and MAP measured at rest and during above- and below-CS exercise are presented in Table 3. Blood flow to the total hindlimb skeletal musculature was significantly elevated (P < 0.05) above (220 ± 18 ml min−1 (100 g)−1) versus below CS (160 ± 10 ml min−1 (100 g)−1). Specifically, blood flow was increased (P < 0.05) above CS in 15 of the 28 individual muscles or muscle parts of the hindlimb compared to below CS (Table 4). Blood flow values as well as the relative increases in blood flow above versus below CS from representative muscles or muscle parts demonstrating the range of fibre-type compositions are presented in Fig. 4. There was a significant correlation (P < 0.05, r= 0.42) between the relative increase in blood flow above versus below CS and the percentage Type IIb/d/x fibre composition of the individual muscles or muscle parts (Fig. 5). Specifically, the 11 individual muscles or muscle parts that evidenced the greatest relative increases in blood flow were composed of predominantly highly glycolytic muscle fibres (≥69% Type IIb/d/x), which differed markedly in the responses observed from the highly oxidative (=60% Type I/IIa fibres) muscles or muscle parts. Blood [lactate] determined from the arterial blood samples was significantly different (P < 0.05) among the values measured above CS (10.0 ± 1.2 mg dl−1), at rest (0.6 ± 0.1 mg dl−1), and below CS (6.6 ± 1.2 mg dl−1; i.e. above CS > below CS > rest). Importantly, the resting blood [lactate] measured prior to the below CS run (i.e. 0.6 mg dl−1) indicates full recovery from the previous CS test as did resting HR (Table 3).
Table 3.
Heart rates (HR) and mean arterial pressures (MAP) measured at rest and at speeds above and below critical speed (CS)
| HR (bpm) | MAP (mmHg) | |
|---|---|---|
| Rest 1 | 427 ± 22 | 129 ± 6 |
| Above CS | 560 ± 7* | 139 ± 3† |
| Rest 2 | 420 ± 33 | 133 ± 3 |
| Below CS | 533 ± 15* | 139 ± 4† |
Data are mean ±s.e.m.*P < 0.05 versus Rest 1 and 2, †P < 0.05 versus Rest 1.
Table 4.
Individual rat hindlimb muscle and muscle part fibre-type compositions (percentage Type IIb/d/x muscle fibres) and blood flows (ml min−1 (100 g)−1)
| Blood flow | |||
|---|---|---|---|
| Below CS | Above CS | % increase | |
| Ankle extensors | |||
| Soleus (9%) | 286 ± 23 | 365 ± 39 | 131 ± 14 |
| Plantaris (80%) | 293 ± 15 | 367 ± 70 | 127 ± 24 |
| Gastrocnemius, red (14%) | 367 ± 32 | 566 ± 97 | 152 ± 21 |
| Gastrocnemius, white (100%) | 91 ± 13 | 122 ± 9* | 143 ± 15 |
| Gastrocnemius, mixed (91%) | 237 ± 16 | 291 ± 32 | 128 ± 19 |
| Tibialis posterior (73%) | 192 ± 23 | 327 ± 46* | 179 ± 21 |
| Flexor digitorum longus (68%) | 146 ± 12 | 196 ± 8* | 140 ± 12 |
| Flexor halicus longus (71%) | 113 ± 5 | 179 ± 24 | 160 ± 21 |
| Ankle flexors | |||
| Tibialis anterior, red (63%) | 391 ± 29 | 515 ± 56* | 138 ± 20 |
| Tibialis anterior, white (80%) | 143 ± 6 | 181 ± 18 | 129 ± 17 |
| Extensor digitorum longus (76%) | 79 ± 7 | 121 ± 17 | 161 ± 33 |
| Peroneals (67%) | 148 ± 9 | 189 ± 17 | 135 ± 21 |
| Knee extensors | |||
| Vastus intermedius (4%) | 441 ± 40 | 518 ± 40 | 122 ± 12 |
| Vastus medialis (82%) | 21 ± 4 | 19 ± 4 | 133 ± 15 |
| Vastus lateralis, red (35%) | 472 ± 27 | 592 ± 66 | 128 ± 15 |
| Vastus lateralis, white (100%) | 74 ± 14 | 130 ± 23* | 210 ± 35 |
| Vastus lateralis, mixed (89%) | 245 ± 14 | 321 ± 35* | 131 ± 11 |
| Rectus femoris, red (66%) | 291 ± 33 | 333 ± 25 | 119 ± 9 |
| Rectus femoris, white (100%) | 153 ± 11 | 176 ± 13 | 119 ± 11 |
| Knee flexors | |||
| Biceps femoris, anterior (100%) | 64 ± 11 | 116 ± 17* | 202 ± 26 |
| Biceps femoris, posterior (92%) | 120 ± 7 | 181 ± 10* | 156 ± 18 |
| Semitendinosus (83%) | 49 ± 3 | 89 ± 10* | 181 ± 19 |
| Semimembranosus, red (72%) | 220 ± 15 | 319 ± 43* | 147 ± 17 |
| Semimembranosus, white (100%) | 84 ± 11 | 168 ± 19* | 217 ± 29 |
| Thigh adductors | |||
| Adductor longus (5%) | 342 ± 32 | 440 ± 65* | 127 ± 8 |
| Adductor magnus & brevis (89%) | 141 ± 12 | 238 ± 31* | 174 ± 20 |
| Gracilis (77%) | 45 ± 8 | 73 ± 9* | 175 ± 14 |
| Pectineus (69%) | 71 ± 12 | 140 ± 37* | 189 ± 20 |
Data are means ±s.e.m. *P < 0.05 versus Below CS. Parentheses indicate percentage Type IIb/d/x muscle fibres from Delp & Duan (1996).
Figure 4.
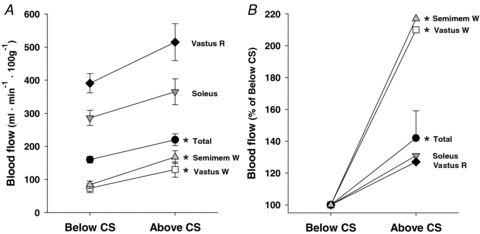
Blood flows (A) and the relative increases in blood flow (B, calculated as percent of below critical speed (CS), s.e.m. bars for individual muscles removed for clarity) to the total hindlimb musculature and representative individual muscles spanning the range of muscle fibre-type composition (according to Delp & Duan, 1996) measured at speeds above (56.1 ± 1.1 m min−1) and below (41.3 ± 1.8 m min−1) critical speed (CS, 48.5 ± 0.8 m min−1). Vastus R; red portion of the vastus lateralis (65% Type I/IIa), Soleus (91% Type I/IIa), Semimem W; white portion of the semimembranosus (100% Type IIb/d/x), Vastus W; white portion of the vastus lateralis (100% Type IIb/d/x). *P < 0.05 versus below CS. Note disproportionate increase in blood flow in these latter two muscles relative to below CS.
Figure 5. Relationship between the blood flow measured above (56.1 ± 1.1 m min−1) relative to below (41.3 ± 1.8 m min−1) CS and the percentage of Type IIb/d/x fibres found in the individual muscles and muscle parts of the rat hindlimb.
Discussion
The present study demonstrates that CS may be determined in the rat via several high-speed (between 95 and 115% of  ) exercise tests to exhaustion. Consistent with our hypotheses, metabolic (
 ) and performance (time to exhaustion) measurements at speeds surrounding CS substantiate a litany of human evidence by demonstrating that CS represents an important feature of bioenergetics and exercise performance in this species. Additionally, for the first time, blood flow measurements incrementally above CS provide direct evidence that muscles composed of predominantly glycolytic Type IIb/d/x muscle fibres are recruited to a disproportionately greater extent than more oxidative muscles or muscle parts compared with below CS running.
Determination and validation of CS in the rat
That CS may be determined in the running rat is consistent with various exercise modes in humans (cycling, Moritani et al. 1981; running, Hughson et al. 1984; swimming, Wakayoshi et al. 1992; rowing, Hill et al. 2003) and disparate animal species (crab, Full & Herreid, 1983; lungless salamander, Full, 1986; horse, Lauderdale & Hinchcliff, 1999; mouse, Billat et al. 2005). Here we observed no differences among the CS or W′ obtained from the three different models, which is consistent with some (Morton et al. 1997; Hill, 2004; Jones et al. 2008; Vanhatalo et al. 2010), but not all (Gaesser et al. 1995) reports and indicates that model selection did not bias the CS estimation. Considering the robustness of the CS parameter across exercise modes and species, and the value of the rat model to elucidate physiological mechanisms, we were surprised that, until now, no study had investigated systematically CS in the running rat. Several preliminary reports had placed the value between ∼22 and 26 m min−1 under various experimental conditions (Manchado et al. 2006; Manchado-Gobatto et al. 2008). The CS estimates here are substantially higher than those preliminary reports and seem more reasonable given that non-exercise trained rats are capable of sprinting ≥100 m min−1 (Armstrong & Laughlin, 1985).
Important features of the present investigation are that we employed an individualized protocol in which the speeds utilized to determine CS were relative to each rat's  and the incorporation of physiological and performance measurements above and below CS to provide validation of our estimation: all original in animal studies. That
  reached
  at a speed above CS but below
  is consistent with human data (Poole et al. 1988, 1990) and supports that CS is a unique metabolic rate above which an inherent, progressive instability of oxidative metabolism is manifested (for a review see Jones et al. 2010). Furthermore, the observation that
  did not change from the beginning to the end of the experimental protocol demonstrates that the animals could be considered ‘trained to exercise’ but not ‘exercise trained’ in a physiological sense (Laughlin & Armstrong, 1982). In regards to time to exhaustion, exercise tolerance was disproportionately greater (∼5×) below versus above CS (see Poole et al. 1988; Jones et al. 2008) which supports that CS represents the upper limit of sustained exercise performance in the rat.
Hindlimb skeletal muscle blood flow and muscle fibre recruitment
To our knowledge, the present investigation is the first to measure active skeletal muscle blood flow distribution at speeds specifically surrounding CS. While we found increases in blood flow in some muscles across the spectrum of fibre-type populations (according to the muscle-fibre composition analysis of Delp & Duan, 1996), consistent with our hypothesis, the muscles that evidenced the greatest relative increases in blood flow above versus below CS were composed of predominantly Type IIb/d/x fibres. This is consistent with a progressive recruitment of higher-threshold Type II fibres at greater exercise intensities (Gollnick et al. 1974; Vollestad & Blom, 1985). It is noteworthy that not all highly glycolytic muscles or muscle parts evidenced significant increases in blood flow above versus below CS. This suggests that the distinct metabolic profiles above CS do not result from broad recruitment of all glycolytic fibres within the hindlimb as some of the highest-threshold motor-units may not be active until more-severe exercise is performed. Rather, it appears that progressive recruitment of select regions may drive the observed responses implying that other factors such as, for example, biomechanical function also play a role in recruitment patterns (Sullivan & Armstrong, 1978).
In humans, the  profile for constant rate exercise above CP or CS evidences a pronounced slow component that drives
  to
to  (for a review see Gaesser & Poole, 1996). Intensive research efforts have yet to elucidate precisely the mechanistic bases of the
  slow component. For example, despite resolving that the vast majority of the slow component originates within the exercising limbs (Poole et al. 1991; Rossiter et al. 2002), substantial controversy surrounds whether the increasing metabolic inefficiency is driven by progressive motor unit recruitment as fibres fatigue (Krustrup et al. 2004; Endo et al. 2007) or greater inefficiency within already-recruited fibres (Zoladz et al. 2008; Hepple et al. 2010). Unfortunately, the high temporal fidelity
  determination ideal for accurate kinetics analysis and, therefore, the direct observation of a slow component response in the rat above CS is not at present feasible. Notwithstanding this consideration, conclusions regarding the presence of a slow component in the rat can be made with confidence given that (1)
  was attained at speeds above CS but significantly lower than
  from the maximal incremental protocol, which is consistent with the human literature (Poole et al. 1988), and (2) blood flow measured after 3.5–4 min of exercise above CS was greater than that predicted from below-CS values and similar to peak rat hindlimb blood flows reported in the literature (Fig. 6). In this initial investigation utilizing the rat CS model only single blood flow measurements were possible above and below CS. Therefore, we cannot be certain if the greater recruitment evident in the Type IIb/d/x fibres was present from the beginning of the exercise bout or occurred subsequently. However, the evidence suggests that the greater relative recruitment of Type IIb/d/x observed here above CS was, at the very least, concurrent with a slow component response. This interpretation is consistent with and supported by the classic studies of Laughlin & Armstrong (1982) and Armstrong & Laughlin (1983), which utilized the same microsphere technique. For example, at 60 m min−1 robust blood flow increases versus those measured during the steady-state at 45 m min−1 were evident within ∼30 s to 1 min of exercise onset in many highly oxidative muscle regions but were not evident in highly glycolytic regions until after ∼2–3 min of exercise (Laughlin & Armstrong, 1982; Armstrong & Laughlin, 1983). Although these findings were not related directly to CS or slow component mechanisms, a slow component response was alluded to when suggesting that significant numbers of superficial fast-glycolytic fibres must not be recruited until several minutes into high-speed exercise. Specifically, they suggest that as the more oxidative muscle fibres fatigue and lose the ability to produce force, more glycolytic fibres are recruited while blood flow (and by implication
  ) remains elevated in the fatiguing fibres (Armstrong & Laughlin, 1983). Moreover, the fibres that are progressively recruited are generally located within muscles that are already active rather than previously non-working muscles (Armstrong & Laughlin, 1983; Endo et al. 2007). These data, in conjunction with the results of the present investigation, support that it is the additive effect of a progressive metabolic inefficiency within fibres recruited from the onset of exercise (Zoladz et al. 2008; Hepple et al. 2010) concomitant with the progressive recruitment of motor units composed of a majority (but probably not solely) of Type II/b/d/x fibres (present results, Krustrup et al. 2004; Endo et al. 2007) that underlies the slow component response. Future investigations utilizing the current model will benefit from determining CS and performing blood flow measurements at distinct time points within given bouts of exercise and relating them to metabolic responses above and below CS in order to address more specifically the determinants of the
  slow component.
Figure 6. Total hindlimb blood flow measured above and below critical speed (CS) in the present study with comparison to an average value from data published at a lower speed (Copp et al. 2010a,b;).
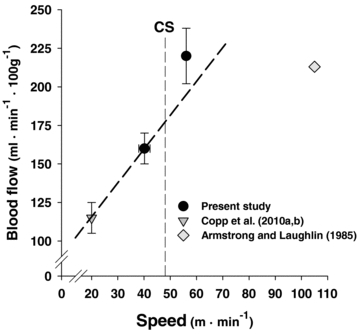
Note the disproportionately high blood flow found above CS versus that predicted from the sub-CS measurements. The data from Armstrong & Laughlin (1985) support that the blood flow values above CS are close to maximal for the rat hindlimb.
Experimental and model considerations
The use of the 95%c.i. from the 1/time model for the above- and below-CS speeds takes into account the accuracy of the CS estimation for each animal and provides confidence that all animals were actually above and below CS for subsequent tests thereby decreasing the opportunity for false negative findings. Here, this resulted in ∼15% increments above and below CS, which is slightly greater than that utilized typically for humans (e.g. 10% in Jones et al. 2008). An important consideration of the present model is that greater accuracy of the CS estimation may be attained via exclusion of inconsistent runners but at the cost of the requirement for more experimental animals.
The sample coefficients of variation for W′ (≥52.4%) are considerably higher than that for CS (≤6.2%). This may represent the inherent difficulty of determining W′ accurately or reliably (Gaesser et al. 1995) or real sample variability. Indeed, the W′ for inclined running may be even more variable than its notional equivalent for cycling or knee extension exercise based on the larger inter-individual biomechanical and internal-work disparities for running versus cycling or knee extension. These factors should be considered when selecting an appropriate experimental model.
The rat hindlimb is composed of a vast majority of Type IIb/d/x muscle fibres (Delp & Duan, 1996). Thus, the greater recruitment in the highly glycolytic fibres observed here above CS relative to below CS may occur in this model simply because they constitute the majority of the fibres present. Despite this possibility, it is clear that dramatic increases in relative flow (greater than ∼160%) observed in many of the glycolytic fibres was not present in the muscles composed of predominantly Type I/IIa fibres.
Summary and conclusions
The current study is the first to demonstrate that CS may be determined in the running rat. Physiological and performance measurements at speeds incrementally above and below CS demonstrated that, similar to humans, CS represents a crucial performance and metabolic demarcator. Specifically, we have shown that during constant-speed exercise below CS,  stabilizes at submaximal values and exercise of sustained duration (=45 min) may be performed. At speeds above CS,
  rises systematically to
  and exhaustion ensues rapidly (i.e. within ∼10 min). Thus, this investigation presents a valid and practical model in which the mechanistic bases of the distinct metabolic profiles above CS and their relation with exercise exhaustion may be investigated. For example, measurements of active skeletal inter- and intramuscular blood flow 3.5–4 min into exercise at specific speeds surrounding CS demonstrate that muscles and muscle portions of all fibre types are increasingly recruited above CS, but that the regions most heavily recruited above, relative to below, CS are composed of a majority of Type IIb/d/x fibres.
Acknowledgments
The authors gratefully acknowledge the technical assistance of K. Sue Hageman. This work was supported by a Kansas State University SMILE award to D.C.P.
Glossary
Abbreviations
- CS
critical speed
- CP
critical power

oxygen uptake
- PCr
phosphocreatine
- Pi
inorganic phosphate
- HR
heart rate
- MAP
mean arterial pressure
Author contributions
S.W.C., D.M.H., T.I.M. and D.C.P. contributed equally to conception and design of experiments, collection, analysis and interpretation of data, and drafting the article or revising it critically for important intellectual content. All authors have read and approved the final version of this manuscript.
References
- Armstrong RB, Laughlin MH. Blood flows within and among rat muscles as a function of time during high speed treadmill exercise. J Physiol. 1983;344:189–208. doi: 10.1113/jphysiol.1983.sp014933. [DOI] [PMC free article] [PubMed] [Google Scholar]
- Armstrong RB, Laughlin MH. Rat muscle blood flows during high-speed locomotion. J Appl Physiol. 1985;59:1322–1328. doi: 10.1152/jappl.1985.59.4.1322. [DOI] [PubMed] [Google Scholar]
- Billat VL, Mouisel E, Roblot N, Melki J. Inter- and intrastrain variation in mouse critical running speed. J Appl Physiol. 2005;98:1258–1263. doi: 10.1152/japplphysiol.00991.2004. [DOI] [PubMed] [Google Scholar]
-
Copp SW, Davis RT, Poole DC, Musch TI. Reproducibility of endurance capacity and
 peak in male Sprague-Dawley rats. J Appl Physiol. 2009;106:1072–1078. doi: 10.1152/japplphysiol.91566.2008. [DOI] [PubMed] [Google Scholar]
 - Copp SW, Hirai DM, Hageman KS, Poole DC, Musch TI. Nitric oxide synthase inhibition during treadmill exercise reveals fiber-type specific vascular control in the rat hindlimb. Am J Physiol. 2010a;298:R478–485. doi: 10.1152/ajpregu.00631.2009. [DOI] [PMC free article] [PubMed] [Google Scholar]
- Copp SW, Hirai DM, Schwagerl PJ, Musch TI, Poole DC. Effects of neuronal nitric oxide synthase inhibition on resting and exercising hindlimb muscle blood flow in the rat. J Physiol. 2010b;588:1321–1331. doi: 10.1113/jphysiol.2009.183723. [DOI] [PMC free article] [PubMed] [Google Scholar]
- Delp MD, Duan C. Composition and size of type I, IIA, IID/X, and IIB fibers and citrate synthase activity of rat muscle. J Appl Physiol. 1996;80:261–270. doi: 10.1152/jappl.1996.80.1.261. [DOI] [PubMed] [Google Scholar]
- Drummond GB. Reporting ethical matters in The Journal of Physiology: standards and advice. J Physiol. 2009;587:713–719. doi: 10.1113/jphysiol.2008.167387. [DOI] [PMC free article] [PubMed] [Google Scholar]
-
Endo MY, Kobayakawa M, Kinugasa R, Kuno S, Akima H, Rossiter HB, Miura A, Fukuba Y. Thigh muscle activation distribution and pulmonary
 kinetics during moderate, heavy, and very heavy intensity cycling exercise in humans. Am J Physiol Regul Integr Comp Physiol. 2007;293:R812–820. doi: 10.1152/ajpregu.00028.2007. [DOI] [PubMed] [Google Scholar]
 - Full RJ. Locomotion without lungs: energetics and performance of a lungless salamander. Am J Physiol Regul Integr Comp Physiol. 1986;251:R775–780. doi: 10.1152/ajpregu.1986.251.4.R775. [DOI] [PubMed] [Google Scholar]
- Full RJ, Herreid CF. Aerobic response to exercise of the fastest land crab. Am J Physiol Regul Integr Comp Physiol. 1983;244:R530–536. doi: 10.1152/ajpregu.1983.244.4.R530. [DOI] [PubMed] [Google Scholar]
- Gaesser GA, Carnevale TJ, Garfinkel A, Walter DO, Womack CJ. Estimation of critical power with nonlinear and linear models. Med Sci Sports Exerc. 1995;27:1430–1438. [PubMed] [Google Scholar]
- Gaesser GA, Poole DC. The slow component of oxygen uptake kinetics in humans. Exercise Sport Sci Rev. 1996;24:35–71. [PubMed] [Google Scholar]
- Gollnick PD, Piehl K, Saltin B. Selective glycogen depletion pattern in human muscle fibres after exercise of varying intensity and at varying pedalling rates. J Physiol. 1974;241:45–57. doi: 10.1113/jphysiol.1974.sp010639. [DOI] [PMC free article] [PubMed] [Google Scholar]
- Hepple RT, Howlett RA, Kindig CA, Stary CM, Hogan MC. The O2 cost of the tension-time integral in isolated single myocytes during fatigue. Am J Physiol Regul Integr Comp Physiol. 2010;298:R983–988. doi: 10.1152/ajpregu.00715.2009. [DOI] [PMC free article] [PubMed] [Google Scholar]
- Hill DW. The relationship between power and time to fatigue in cycle ergometer exercise. Int J Sports Med. 2004;25:357–361. doi: 10.1055/s-2004-815838. [DOI] [PubMed] [Google Scholar]
- Hill DW, Alain C, Kennedy MD. Modeling the relationship between velocity and time to fatigue in rowing. Med Sci Sports Exercise. 2003;35:2098–2105. doi: 10.1249/01.MSS.0000099111.78949.0E. [DOI] [PubMed] [Google Scholar]
- Hughson RL, Orok CJ, Staudt LE. A high velocity treadmill running test to assess endurance running potential. Int J Sports Med. 1984;5:23–25. doi: 10.1055/s-2008-1025875. [DOI] [PubMed] [Google Scholar]
-
Jones AM, Vanhatalo A, Burnley M, Morton RH, Poole DC. Critical power: Implications for the determination of
 max and exercise tolerance. Med Sci Sports Exerc. 2010;42:1876–1890. doi: 10.1249/MSS.0b013e3181d9cf7f. [DOI] [PubMed] [Google Scholar]
 - Jones AM, Wilkerson DP, DiMenna F, Fulford J, Poole DC. Muscle metabolic responses to exercise above and below the “critical power” assessed using 31P-MRS. Am J Physiol Regul Integr Comp Physiol. 2008;294:R585–593. doi: 10.1152/ajpregu.00731.2007. [DOI] [PubMed] [Google Scholar]
- Krustrup P, Soderlund K, Mohr M, Bangsbo J. The slow component of oxygen uptake during intense, sub-maximal exercise in man is associated with additional fibre recruitment. Pflugers Arch. 2004;447:855–866. doi: 10.1007/s00424-003-1203-z. [DOI] [PubMed] [Google Scholar]
- Lauderdale MA, Hinchcliff KW. Hyperbolic relationship between time-to-fatigue and workload. Equine Vet J. 1999;30:586–590. doi: 10.1111/j.2042-3306.1999.tb05289.x. [DOI] [PubMed] [Google Scholar]
- Laughlin MH, Armstrong RB. Muscular blood flow distribution patterns as a function of running speed in rats. Am J Physiol Heart Circ Physiol. 1982;243:H296–306. doi: 10.1152/ajpheart.1982.243.2.H296. [DOI] [PubMed] [Google Scholar]
- Manchado-Gobatto F, Clecia S, Ribeiro C, Araujo G, Araujo M, Contarteze R, Voltarelli F, Moura R, Stevanato E, Gobatto C, de Mello M. Effects of light-dark cycle on critical velocity and anaerobic capacity determination in running Wistar rats (abstract) Med Sci Sports Exerc. 2008;40:S397–S398. [Google Scholar]
- Manchado F, Gobatto C, Contarteze R, Papoti M, de Mello M. Critical velocity and anaerobic running capacity determination of running rats (abstract) Med Sci Sports Exerc. 2006;38:S516. [Google Scholar]
- Monod H, Scherrer J. The work capacity of a synergic muscular group. Ergonomics. 1965;8:329–338. [Google Scholar]
- Moritani T, Nagata A, deVries HA, Muro M. Critical power as a measure of physical work capacity and anaerobic threshold. Ergonomics. 1981;24:339–350. doi: 10.1080/00140138108924856. [DOI] [PubMed] [Google Scholar]
- Morton RH, Green S, Bishop D, Jenkins DG. Ramp and constant power trials produce equivalent critical power estimates. Med Sci Sports Exerc. 1997;29:833–836. doi: 10.1097/00005768-199706000-00015. [DOI] [PubMed] [Google Scholar]
- Musch TI, Bruno A, Bradford GE, Vayonis A, Moore RL. Measurements of metabolic rate in rats: a comparison of techniques. J Appl Physiol. 1988;65:964–970. doi: 10.1152/jappl.1988.65.2.964. [DOI] [PubMed] [Google Scholar]
- Musch TI, Terrell JA. Skeletal muscle blood flow abnormalities in rats with a chronic myocardial infarction: rest and exercise. Am J Physiol Heart Circ Physiol. 1992;262:H411–419. doi: 10.1152/ajpheart.1992.262.2.H411. [DOI] [PubMed] [Google Scholar]
- Poole DC, Schaffartzik W, Knight DR, Derion T, Kennedy B, Guy HJ, Prediletto R, Wagner PD. Contribution of exercising legs to the slow component of oxygen uptake kinetics in humans. J Appl Physiol. 1991;71:1245–1260. doi: 10.1152/jappl.1991.71.4.1245. [DOI] [PubMed] [Google Scholar]
- Poole DC, Ward SA, Gardner GW, Whipp BJ. Metabolic and respiratory profile of the upper limit for prolonged exercise in man. Ergonomics. 1988;31:1265–1279. doi: 10.1080/00140138808966766. [DOI] [PubMed] [Google Scholar]
- Poole DC, Ward SA, Whipp BJ. The effects of training on the metabolic and respiratory profile of high-intensity cycle ergometer exercise. Eur J Appl Physiol Occup Physiol. 1990;59:421–429. doi: 10.1007/BF02388623. [DOI] [PubMed] [Google Scholar]
- Rossiter HB, Ward SA, Howe FA, Kowalchuk JM, Griffiths JR, Whipp BJ. Dynamics of intramuscular 31P-MRS Pi peak splitting and the slow components of PCr and O2 uptake during exercise. J Appl Physiol. 2002;93:2059–2069. doi: 10.1152/japplphysiol.00446.2002. [DOI] [PubMed] [Google Scholar]
- Sullivan TE, Armstrong RB. Rat locomotory muscle fiber activity during trotting and galloping. J Appl Physiol. 1978;44:358–363. doi: 10.1152/jappl.1978.44.3.358. [DOI] [PubMed] [Google Scholar]
- Vanhatalo A, Fulford J, DiMenna FJ, Jones AM. Influence of hyperoxia on muscle metabolic responses and the power-duration relationship during severe-intensity exercise in humans: a 31P magnetic resonance spectroscopy study. Exp Physiol. 2010;95:528–540. doi: 10.1113/expphysiol.2009.050500. [DOI] [PubMed] [Google Scholar]
- Vollestad NK, Blom PC. Effect of varying exercise intensity on glycogen depletion in human muscle fibres. Acta physiol Scand. 1985;125:395–405. doi: 10.1111/j.1748-1716.1985.tb07735.x. [DOI] [PubMed] [Google Scholar]
- Wakayoshi K, Ikuta K, Yoshida T, Udo M, Moritani T, Mutoh Y, Miyashita M. Determination and validity of critical velocity as an index of swimming performance in the competitive swimmer. Eur J Appl Physiol Occup Physiol. 1992;64:153–157. doi: 10.1007/BF00717953. [DOI] [PubMed] [Google Scholar]
-
Zoladz JA, Gladden LB, Hogan MC, Nieckarz Z, Grassi B. Progressive recruitment of muscle fibers is not necessary for the slow component of
 kinetics. J Appl Physiol. 2008;105:575–580. doi: 10.1152/japplphysiol.01129.2007. [DOI] [PubMed] [Google Scholar]