

Abstract
A series of 4-[1-(substituted aryl/alkyl carbonyl)-benzoimidazol-2-yl]-benzene sulphonic acids (1-20) was synthesized and evaluated, in vitro, for their antimicrobial activity and the results indicated that compounds 4-[1-(4-Nitrobenzoyl)-1H-benzoimidazol-2-yl]-benzenesulfonic acid (9) and 4-(1-octadec-9-enoyl-1H-benzoimidazol-2-yl)-benzenesulfonic acid (18) were found to be the most active ones. QSAR investigations indicated that the multi-target QSAR model was effective in describing the antimicrobial activity over the one-target QSAR models. Further the mt-QSAR model indicated the importance of the topological parameter, Balaban index (J) followed by the electronic parameter, LUMO and topological parameter, valence second order molecular connectivity index (2χv) in describing the antimicrobial activity of synthesized compounds (1-20).
Keywords: Benzimidazoles, QSAR, Antimicrobial, Antiviral
Graphical abstract
The in vitro antimicrobial activity of a series of substituted benzimidazoles (1-20) indicated that compounds 4-[1-(4-Nitrobenzoyl)-1H-benzoimidazol-2-yl]-benzene sulfonic acid (9) and 4-(1-octadec-9-enoyl-1H-benzoimidazol-2-yl)-benzenesulfonic acid (18) were found to be the most active ones.

Research highlights
►A series of substituted benzimidazoles (1-20) was synthesized and characterized.►The antimicrobial results indicated that compounds 9 and 18 were found to be the most active ones.►QSAR studies revealed the effectiveness of multi-target QSAR model over one-target QSAR models.
1. Introduction
The increasing incidence of infection caused by the rapid development of microbial resistance to most of the known antibiotics is a serious health problem. There are a number of factors responsible for mutations in the microbial genomes. As multidrug-resistant microbial strains proliferate, the necessity for effective therapy has stimulated research on the design and synthesis of novel antimicrobial molecules [1].
In spite of nearly three decades of intensive research toward the treatment and eradication of HIV/AIDS, the disease remains a global health problem. The advent of highly active antiretroviral therapy (HAART) in the mid 1990s, which employed various combinations of reverse transcriptase and protease inhibitors, led to marked improvements of clinical outcomes. While the diversity of drugs now available to the clinician has substantially improved HIV treatment, still significant challenges remain. Of particular concern are long-term treatment side effects and the emergence of drug-resistant viral strains [2].
The heterocyclic molecule, benzimidazole, is isosteric with indole and purine nuclei, which are present in a number of fundamental cellular components and bioactive compounds which makes the benzimidazole molecule endowed with a variety of biological properties [3]. The study of recent literature reveals that benzimidazole is reported to have number of biological activities viz. antiviral [4], antifungal [5], antihelmintic [6], antiprotozoal [7], psychotropic [8], anti-HIV [9], antitumor [10], antioxidant [11] and anticoagulant [12] activities.
Indeed, a number of important drugs used in different therapeutic areas contain the benzimidazole ring, as proton pump inhibitors (omeprazole), antihypertensives (candesartan, telmisartan), antihistaminics (astemizole), antihelmintics (albendazole, mebendazole), as well as several other kinds of still investigational therapeutic agents, including antitumorals and antivirals [1].
QSAR refers to a discipline in computational chemistry that addresses the modeling of biological activities or chemical reactivity based on the quantitative description for the chemical structure of molecules. QSAR relies on the basic assumption that molecules with similar physicochemical properties or structures will have similar activities [13]. Quantitative structure–activity relationship (QSAR) is one of the most important areas in chemometrics, and is a valuable tool that is used extensively in drug design and medicinal chemistry. Once a reliable QSAR model is established, we can predict the activities of molecules, and know which structural features play an important role in biological processes [14].
Bearing these results in mind and in continuation of our research efforts in searching novel antiviral agents [15], [16], we hereby present the synthesis, antimicrobial and antiviral activity and QSAR modeling of 4-[1-(substituted aryl/alkyl carbonyl)-benzoimidazol-2-yl]-benzenesulfonic acids.
2. Chemistry
The synthesis of compounds 1-20 followed the general pathway elicited in Scheme 1 . The key intermediate, 4-(1H-benzoimidazol-2-yl)-benzenesulfonic acid was prepared by the condensation of benzimidazole with aryldiazonium chloride of 4-amino-benzenesulfonic acid, which in turn prepared by the diazotization of 4-amino-benzenesulfonic acid [17]. However, based on our experience, the application of the cupric chloride for the condensation of aryldiazonium chloride with benzimidazole as suggested by Dahiya and Pathak [18] resulted in resinous (sticky) products. Therefore, the coupling was carried out by using sodium acetate along with stirring at cold conditions for the initial 3 h followed by 48 h stirring at room temperature which resulted in a solid product. For the synthesis of 4-[1-(substituted aryl/alkyl carbonyl)-benzoimidazol-2-yl]-benzenesulfonic acids, the key intermediates 4-(1H-benzoimidazol-2-yl)-benzenesulfonic acid has been reacted with corresponding aryl/alkyl acid chlorides which were formed by the reaction of corresponding aryl/alkyl acids with thionyl chloride. It is important to note here that the yield of most of the synthesized benzimidazoles were below 50%. The low yield of synthetic compounds may be attributed to any one or more of the following reasons [17]: a). The reaction may be reversible and position of equilibrium is unfavorable to the product; b). The incursion of side reactions leading to the formation of by-products; c). The premature work-up of the reaction before its completion; d). The volatilization of products during reaction or work-up; e). The loss of product due to incomplete extraction, inefficient crystallization or other work-up procedures; f). The presence of contaminants in the reactants or reagents leading to a less efficient reaction. The physicochemical characteristics of the synthesized compounds are presented in Table 1 .
Scheme 1.

Scheme for the synthesis of 4-[1-(substituted aryl/alkyl)-benzoimidazol-2-yl]-benzenesulfonic acids.
Table 1.

| Comp. | R1 | R2 | R3 | R4 | R5 | X | Mol. Formula | Mol. Wt. | m.p. | Rf value (CHCl3) | Yield % |
|---|---|---|---|---|---|---|---|---|---|---|---|
| 1 | NH2 | H | H | H | H | C O | C20H15N3O4S | 393.42 | 116–-118 | 0.33 | 70.9 |
| 2 | H | H | H | H | H | C O | C20H14N2O4S | 378.40 | 93–95 | 0.49 | 43.9 |
| 3 | H | H | NH2 | H | H | C O | C20H15N3O4S | 393.42 | 212–-214 | 0.43 | 99.0 |
| 4 | Cl | H | H | H | H | C O | C20H13ClN2O4S | 412.85 | 128–-130 | 0.48 | 37.5 |
| 5 | H | H | Cl | H | H | C O | C20H13ClN2O4S | 412.85 | 65–-67 | 0.44 | 63.5 |
| 6 | H | OH | H | H | H | C O | C20H14N2O5S | 394.40 | 98–-100 | 0.41 | 101.6 |
| 7 | OH | H | OH | H | H | C O | C20H14N2O6S | 410.40 | 163–-165 | 0.38 | 70.6 |
| 8 | H | H | OCH3 | H | H | C O | C21H16N2O5S | 408.43 | 90–92 | 0.36 | 60.9 |
| 9 | H | H | NO2 | H | H | C O | C20H13N3O6S | 423.40 | 92–-94 | 0.34 | 46.3 |
| 10 | CH3 | H | H | H | H | C O | C21H16N2O4S | 392.43 | 70–72 | 0.35 | 37.0 |
| 11 | H | H | CH3 | H | H | C O | C21H16N2O4S | 392.43 | 95–97 | 0.45 | 28.1 |
| 16 | OH | H | H | H | H | C O | C20H14N2O5S | 394.40 | 78–-80 | 0.77 | 60.0 |
| 20 | H | H | CH3 | H | H | SO2 | C20H16N2O5S2 | 428.48 | 156–-158 | 0.40 | 35.8 |
| R | |||||||||||
| 12 | –CH CH–CH3 | C17H14N2O4S | 342.37 | 112–-114 | 0.82 | 30.2 | |||||
| 13 | –CH CH2 | C16H12N2O4S | 328.34 | 100–102 | 0.56 | 32.8 | |||||
| 14 | –C(CH3) = CH2 | C17H14N2O4S | 342.37 | 102–-104 | 0.43 | 33.5 | |||||
| 15 | C19H13N3O4S | 379.39 | 110–-112 | 0.96 | 44.0 | ||||||
| 17 | –CH2–(CH2)2–CH3 | C18H18N2O4S | 358.41 | 107–-109 | 0.42* | 33.8 | |||||
| 18 | –CH2–(CH2)6–CH CH–(CH2)7–CH3 | C31H42N2O4S | 538.74 | 109–111 | 0.75 | 31.7 | |||||
| 19 | –CH2–(CH2)13–CH3 | C29H40N2O4S | 512.70 | 115–117 | 0.83* | 61.3 | |||||
*TLC mobile phase – Benzene.
The structures of compounds 1-20 were assigned by IR and 1H NMR spectroscopic data, which are consistent with the proposed molecular structures. The primary amino group in compound 1 is depicted by the presence of NH asymmetric stretch at 3481.81 cm−1. The IR bending vibration corresponding to OCH3 of compound 8 appeared at 1425.61 cm−1. The presence of heterocyclic pyridine moiety in compound 15 is demonstrated by the presence of CH out of plane bending at 829.04 cm−1. The presence of an additional S–N stretch at 808.61 cm−1 apart from the SO3 asymmetric stretch in the region of 1260–1150 cm−1 indicated that compound 20 contains a link between SO2 and N1 of benzimidazole. The appearance of C O stretch in the range of 1630–1600 cm−1 indicated the formation of tertiary amides (1-20) by the reaction of acid chlorides with the 4-(1H-benzoimidazol-2-yl)-benzenesulfonic acid. Formation of tertiary amide is further evidenced by the absence of IR bands at 1725–1700 cm−1 and 1700–1680 cm−1 corresponding to the alkyl and aryl acids, respectively. The appearance of SO3 asymmetric stretch in the region of 1260–1150 cm−1 demonstrated the presence of SO3H group of benzenesulfonic acid attached to the 2nd position of benzimidazole.
The appearance of singlet around 2.5 δ ppm corresponds to the proton of SO3H in the NMR of all the compounds indicated the presence of para sulfonyl phenyl nucleus to the 2nd position of synthesized benzimidazoles (11-20). Further the multiplet corresponds to 6.9–8.6 δ ppm confirmed the presence of protons of benzimidazole and aryl nucleus. The appearance of δ at 8.46–9.66 confirmed the presence of the pyridine ring system in compound 15. The appearance doublet at 3.66–3.72 δ ppm (CH2 of CH CH2) and 3.79–3.85 δ ppm (CH of CH CH2) indicated the formation of compound 14 by the reaction of 4-(1H-benzoimidazol-2-yl)-benzenesulfonic acid and acid chloride of methacrylic acid. Further the coupling constant value of 18 Hz in compound 14 indicated that the nature of the double bond in the synthesized compound 14 is of trans nature. Compound 8 showed a singlet at δ 3.78 ppm corresponding to a proton of the OCH3. This confirmed the attachment of the para methoxy benzoyl group to the N1 position of benzimidazole. The absence of a singlet at δ 11 ppm in the NMR spectra of compounds 1-20 indicated the absence of the free COOH group. This confirms that the compounds 1-20 are tertiary amides and not the physical mixture of aryl/alkyl acids and 4-(1H-benzoimidazol-2-yl)-benzenesulfonic acid. Therefore, this assures the reaction of aryl/alkyl acid chlorides with the secondary nitrogen of the benzimidazole nucleus.
3. Results and discussion
3.1. Antimicrobial activity
The synthesized compounds were evaluated for their in vitro antimicrobial activities against two Gram-positive bacteria – Staphylococcus aureus, Bacillus subtilis; the Gram-negative bacterium – Escherichia coli and the fungal strains – Aspergillus niger and Candida albicans by tube dilution method [19] using ciprofloxacin and fluconazole as control drugs for antibacterial and antifungal activity, respectively. The results of the antimicrobial studies are presented in Table 2 . In general the compounds showed an improved antibacterial activity when compared to their antifungal activity. The deduced patterns of antimicrobial activity of the synthesized benzimidazoles are in the following order: Antibacterial activity > antifungal activity.
Table 2.
Antimicrobial activity of synthesized benzimidazole derivatives.
| Comp. | For ot-QSAR |
For mt-QSAR |
||||||
|---|---|---|---|---|---|---|---|---|
| pMICsa | pMICbs | pMICec | pMICca | pMICan | pMICab | pMICaf | pMICam | |
| 1 | 1.80 | 2.03 | 2.40 | 1.70 | 1.50 | 2.08 | 1.60 | 1.89 |
| 2 | 2.08 | 2.12 | 2.12 | 1.78 | 1.48 | 2.11 | 1.63 | 1.92 |
| 3 | 2.10 | 1.80 | 2.10 | 1.20 | 1.50 | 2.00 | 1.35 | 1.74 |
| 4 | 2.09 | 1.82 | 2.42 | 1.52 | 1.22 | 2.11 | 1.37 | 1.81 |
| 5 | 2.12 | 2.13 | 2.42 | 1.52 | 1.22 | 2.22 | 1.37 | 1.88 |
| 6 | 2.10 | 2.15 | 2.40 | 1.50 | 1.20 | 2.22 | 1.35 | 1.87 |
| 7 | 2.12 | 2.42 | 2.42 | 1.52 | 1.22 | 2.32 | 1.37 | 1.94 |
| 8 | 2.12 | 2.12 | 2.12 | 1.51 | 1.21 | 2.12 | 1.36 | 1.82 |
| 9 | 2.43 | 2.43 | 2.43 | 2.13 | 1.53 | 2.43 | 1.83 | 2.19 |
| 10 | 2.10 | 2.10 | 2.10 | 1.50 | 1.20 | 2.10 | 1.35 | 1.80 |
| 11 | 2.10 | 1.95 | 2.10 | 1.50 | 0.89 | 2.05 | 1.20 | 1.71 |
| 12 | 1.85 | 1.85 | 1.85 | 1.44 | 0.84 | 1.85 | 1.14 | 1.57 |
| 13 | 1.72 | 2.02 | 2.32 | 1.42 | 1.12 | 2.02 | 1.27 | 1.72 |
| 14 | 1.74 | 1.74 | 2.04 | 1.44 | 1.14 | 1.84 | 1.29 | 1.62 |
| 15 | 2.13 | 2.13 | 2.39 | 1.75 | 1.48 | 2.22 | 1.62 | 1.98 |
| 16 | 2.10 | 2.10 | 2.26 | 1.50 | 1.50 | 2.15 | 1.50 | 1.89 |
| 17 | 1.76 | 1.76 | 1.76 | 1.46 | 1.16 | 1.76 | 1.31 | 1.58 |
| 18 | 2.24 | 2.24 | 1.85 | 1.94 | 1.63 | 2.11 | 1.79 | 1.98 |
| 19 | 2.23 | 2.23 | 1.61 | 1.61 | 1.61 | 2.02 | 1.61 | 1.86 |
| 20 | 1.84 | 1.84 | 1.54 | 1.54 | 1.23 | 1.74 | 1.39 | 1.60 |
| SDa | 0.19 | 0.20 | 0.28 | 0.20 | 0.22 | 0.18 | 0.19 | 0.16 |
| Std. | 2.61* | 2.61* | 2.61* | 2.64** | 2.64** | 2.61 | 2.64 | 2.62 |
*Ciprofloxacin, **Fluconazole.
Standard deviation.
The compound 9 is the most effective compound against S. aureus with pMICsa value of 2.43 (Table 2), respectively. For activity against B. subtilis the compounds 7 and 9 yielded better activity (Table 2) in comparison to other compounds synthesized. The antimicrobial spectrum of synthesized benzimidazoles against E. coli demonstrated that compounds 4, 5, 7 and 9 were the most active ones with pMICec values of 2.42, 2.42, 2.42 and 2.43 (Table 2) respectively. From the above discussion it is evident that compound 9 emerged as the most active antibacterial benzimidazole. Compounds 9 and 18 emerged as the most effective antifungal agents against C. albicans whereas compound 18 was most active against A. niger (Table 2). From the above discussion it is evident that compound 18 emerged as the most effective antifungal benzimidazole.
The minimum bactericidal concentration/minimum fungicidal concentration (MBC/MFC) (Table 3 ) determination results revealed that the synthesized compounds were fungistatic against both fungi and bacteriostatic against S. aureus, B. subtilis but bacteriocidal against E. coli. In general, the MBC and MFC of synthesized benzimidazole derivatives were 3-fold higher than their MIC values, which indicated that they were bacteriostatic and fungistatic in action except for E. coli (a drug is considered to be bacteriosatic/fungistatic when its MBC and MFC values are 3-fold higher than its MIC values) [20]. In the case of S. aureus compounds 10 and 17 and for Bacillus subtitlis compounds 11 and 17 were found to be active bacteriocidal agents.
Table 3.
MBC/MFC of synthesized benzimidazole derivatives.
| Comp. | MBC (μg/ml) |
MFC (μg/ml) |
|||
|---|---|---|---|---|---|
| S. aureus | B. subtilis | E. coli | C. albicans | A. niger | |
| 1 | 50 | >50 | 1.56 | 50 | >50 |
| 2 | 12.5 | >50 | 1.56 | 50 | >50 |
| 3 | 12.5 | >50 | 25 | >50 | >50 |
| 4 | 25 | >50 | 1.56 | >50 | >50 |
| 5 | 25 | >50 | 1.56 | >50 | >50 |
| 6 | 12.5 | >50 | 3.12 | 50 | >50 |
| 7 | 12.5 | 25 | 1.56 | 12.5 | >50 |
| 8 | >50 | >50 | 3.12 | >50 | >50 |
| 9 | 50 | 50 | 1.56 | 25 | >50 |
| 10 | 6.25 | >50 | 3.12 | 50 | >50 |
| 11 | 12.5 | 6.25 | 25 | 50 | >50 |
| 12 | 12.5 | 50 | 12.5 | >50 | >50 |
| 13 | 6.25 | 12.5 | 1.56 | >50 | >50 |
| 14 | 6.25 | 12.5 | 12.5 | >50 | >50 |
| 15 | 12.5 | >50 | 1.56 | >50 | >50 |
| 16 | 25 | 25 | 12.5 | 50 | >50 |
| 17 | 6.25 | 6.25 | 6.25 | 12.5 | >50 |
| 18 | 12.5 | 50 | 3.12 | 50 | >50 |
| 19 | 6.25 | 12.5 | 12.5 | >50 | >50 |
| 20 | 6.25 | 12.5 | 12.5 | 50 | >50 |
| Std. | 0.019 | 0.019 | 0.019 | 0.040 | 0.040 |
3.2. QSAR studies
3.2.1. Development of one-target QSAR model
In order to understand the experimental antimicrobial data on a theoretical basis, we established a quantitative structure activity relationship (QSAR) between the in vitro antimicrobial activity of synthesized benzimidazole derivatives and descriptors coding for lipophilic, electronic, steric and topological properties of the molecules under consideration using the linear free energy relationship model (LFER) described by Hansch and Fujita [21]. Biological activity data determined as MIC values were first transformed into pMIC values and used as dependent variables in a QSAR study. The different molecular descriptors (independent variables) like log of octanol-water partition coefficient (log P), molar refractivity (MR), Kier’s molecular connectivity (0χ, 0χv, 1χ, 1χv, 2χ, 2χv) and shape (κ1, κα 1) topological indices, Randic topological index (R), Balaban topological index (J), Wiener topological index (W), Total energy (Te), energies of highest occupied molecular orbital (HOMO) and lowest unoccupied molecular orbital (LUMO), dipole moment (μ), electronic energy (Ele.E), nuclear energy (Nu.E) and molecular surface area (SA) calculated for of 4-[1-(substituted aryl/alkyl carbonyl)-benzoimidazol-2-yl]-benzenesulfonic acids are used as independent variables and are presented in Table 4 [22], [23], [24], [25], [26], [27].
Table 4.
Values of selected parameters used in regression analysis.
| Comp. | log P | MR | 2χv | R | J | Te | NE | LUMO |
|---|---|---|---|---|---|---|---|---|
| 1 | 3.07 | 104.11 | 7.69 | 13.36 | 1.36 | −4861.42 | 32108.70 | −1.28 |
| 2 | 3.87 | 99.29 | 7.47 | 12.95 | 1.34 | −4640.27 | 29585.80 | −1.37 |
| 3 | 3.07 | 104.11 | 7.72 | 13.34 | 1.34 | −4861.39 | 30708.30 | −1.13 |
| 4 | 4.43 | 103.90 | 8.02 | 13.36 | 1.36 | −5000.25 | 32054.10 | −1.34 |
| 5 | 4.43 | 103.90 | 8.08 | 13.34 | 1.34 | −5000.34 | 31558.70 | −1.43 |
| 6 | 3.48 | 101.10 | 7.65 | 13.34 | 1.34 | −4955.73 | 31701.40 | −1.43 |
| 7 | 3.09 | 102.92 | 7.80 | 13.75 | 1.37 | −5281.53 | 34388.40 | −1.41 |
| 8 | 3.74 | 106.54 | 7.83 | 13.88 | 1.33 | −5116.18 | 32616.70 | −1.18 |
| 9 | 3.16 | 106.32 | 7.90 | 14.25 | 1.33 | −5470.94 | 36375.50 | −1.85 |
| 10 | 4.36 | 105.19 | 7.92 | 13.36 | 1.36 | −4796.08 | 32177.00 | −1.34 |
| 11 | 4.36 | 105.19 | 7.97 | 13.34 | 1.34 | −4796.16 | 30732.20 | −1.18 |
| 12 | 3.02 | 90.36 | 6.63 | 11.41 | 1.54 | −4256.52 | 24803.10 | −1.40 |
| 13 | 2.65 | 84.44 | 6.34 | 10.91 | 1.53 | −4100.52 | 22838.50 | −1.45 |
| 14 | 3.00 | 88.48 | 6.88 | 11.29 | 1.56 | −4256.30 | 25159.20 | −1.41 |
| 15 | 2.53 | 97.76 | 7.34 | 12.95 | 1.34 | −4705.22 | 29639.90 | −1.43 |
| 16 | 3.48 | 101.10 | 7.62 | 13.36 | 1.36 | −4960.77 | 32297.30 | −1.32 |
| 17 | 3.46 | 93.10 | 7.29 | 11.91 | 1.54 | −4440.90 | 27410.30 | −1.40 |
| 18 | 8.56 | 154.26 | 11.52 | 18.41 | 1.24 | −6438.19 | 48954.00 | −1.39 |
| 19 | 8.05 | 143.70 | 11.18 | 17.41 | 1.29 | −6155.08 | 46304.10 | −1.39 |
| 20 | 3.96 | 108.96 | 9.97 | 13.68 | 1.39 | −5182.61 | 34218.00 | −1.41 |
In the present study, a data set of 20 benzimidazole derivatives was subjected to linear free energy regression analysis for model generation. The reference drugs were not included in model development as they belong to different structural series. Preliminary analysis was carried out in terms of correlation analysis. A correlation matrix constructed for antibacterial activity against S. aureus is presented in Table 5 . The correlations of different molecular descriptors with antimicrobial activity are presented in Table 6 . In general, high colinearity (r > 0.8) was observed between different parameters. The high interrelationship was observed between Te and Nu.E (r = 0.990) and low interrelationship was observed between 2 χ v and LUMO (r = 0.001).
Table 5.
Correlation matrix of synthesized benzimidazole derivatives against S. aureus.
| pMICsa | log P | MR | 2χv | J | Te | Nu. E | LUMO | HOMO | μ | |
|---|---|---|---|---|---|---|---|---|---|---|
| pMICsa | 1.000 | 0.420 | 0.562 | 0.438 | 0.824 | −0.699 | 0.657 | −0.242 | −0.234 | 0.118 |
| log p | 1.000 | 0.935 | 0.897 | −0.549 | −0.815 | 0.862 | 0.063 | −0.145 | −0.196 | |
| MR | 1.000 | 0.950 | −0.723 | −0.945 | 0.972 | 0.028 | −0.129 | −0.038 | ||
| 2χv | 1.000 | −0.642 | −0.907 | 0.930 | −0.001 | −0.173 | 0.085 | |||
| J | 1.000 | 0.790 | −0.773 | −0.091 | −0.019 | −0.200 | ||||
| Te | 1.000 | −0.990 | 0.131 | 0.193 | −0.050 | |||||
| Nu. E | 1.000 | −0.099 | −0.176 | −0.012 | ||||||
| LUMO | 1.000 | 0.390 | 0.222 | |||||||
| HOMO | 1.000 | −0.057 | ||||||||
| μ | 1.000 |
Table 6.
Correlation of antimicrobial activity of benzimidazole derivatives with studied molecular descriptors.
| pMICsa | pMICbs | pMICec | pMICca | pMICan | pMICab | pMICaf | pMICam | |
|---|---|---|---|---|---|---|---|---|
| log P | 0.420 | 0.261 | −0.484 | 0.306 | 0.389 | −0.014 | 0.402 | 0.182 |
| MR | 0.562 | 0.416 | −0.391 | 0.429 | 0.574 | 0.148 | 0.580 | 0.376 |
| 0χv | 0.530 | 0.387 | −0.438 | 0.414 | 0.546 | 0.099 | 0.555 | 0.332 |
| 1χv | 0.474 | 0.346 | −0.499 | 0.398 | 0.544 | 0.031 | 0.545 | 0.281 |
| 2χv | 0.438 | 0.294 | −0.529 | 0.363 | 0.504 | −0.018 | 0.503 | 0.227 |
| κ1 | 0.576 | 0.472 | −0.375 | 0.467 | 0.591 | 0.182 | 0.610 | 0.414 |
| κ2 | 0.497 | 0.413 | −0.414 | 0.435 | 0.563 | 0.110 | 0.576 | 0.350 |
| κα1 | 0.527 | 0.427 | −0.418 | 0.438 | 0.568 | 0.124 | 0.581 | 0.361 |
| κα2 | 0.458 | 0.377 | −0.443 | 0.410 | 0.542 | 0.067 | 0.550 | 0.308 |
| R | 0.669 | 0.531 | −0.277 | 0.493 | 0.634 | 0.291 | 0.650 | 0.506 |
| J | −0.824 | −0.610 | −0.144 | −0.457 | −0.632 | −0.606 | −0.630 | −0.707 |
| W | 0.525 | 0.439 | −0.385 | 0.458 | 0.577 | 0.146 | 0.597 | 0.383 |
| Te | −0.699 | −0.585 | 0.221 | −0.517 | −0.621 | −0.352 | −0.655 | −0.549 |
| El.E | −0.661 | −0.551 | 0.279 | −0.517 | −0.636 | −0.295 | −0.664 | −0.515 |
| Nu. E | 0.657 | 0.547 | −0.284 | 0.516 | 0.637 | 0.289 | 0.664 | 0.511 |
| LUMO | −0.242 | −0.458 | −0.172 | −0.656 | −0.165 | −0.354 | −0.454 | −0.453 |
| HOMO | −0.234 | −0.179 | 0.172 | −0.379 | −0.127 | −0.054 | −0.284 | −0.173 |
| μ | 0.118 | −0.150 | −0.137 | −0.122 | −0.135 | −0.088 | −0.143 | −0.127 |
Correlation matrix (Table 5) indicated the importance of the topological parameter, Balaban index (J) in describing antibacterial activity of synthesized benzimidazole derivatives against S. aureus [Eq. (1)].
ot-QSAR model for antibacterial activity against S. aureus
| (1) |
n = 20 r = 0.824 q 2 = 0.628 s = 0.110 F = 38.10
Here and thereafter, n – number of data points, r – correlation coefficient, q 2 – cross validated r 2 obtained by leave one out method, s – standard error of the estimate and F – Fischer statistics.
As the coefficient of J in Eq. (1) is negative, therefore the antibacterial activity against S. aureus will increase with a decrease in value of J. This is clearly evident from Table 4 that compounds 9, 18 and 19 having low J value of 1.33, 1.24 and 1.29 have higher pMICsa of 2.43, 2.24 and 2.23, respectively than the other compounds. Similarly, compound 14 having maximum J values 1.56 (Table 4), has minimum antibacterial activity against S. aureus.
The addition of electronic parameter, the energy of lowest unoccupied molecular orbital (LUMO) to Balaban index [Eq. (1)] improved the correlation (r = 0.883, Eq. (2)).
ot-QSAR model for antibacterial activity against S. aureus
| (2) |
n = 20 r = 0.883 q 2 = 0.592 s = 0.093 F = 30.25
Further the inclusion of the topological parameter, valence second order molecular connectivity index (2χv) improved the correlation coefficient value closer to 0.9 [Eq. (3)].
ot-QSAR model for antibacterial activity against S. aureus
| (3) |
n = 20 r = 0.895 q 2 = 0.536 s = 0.091 F = 21.57
The above results indicated that the antibacterial activity of synthesized benzimidazole derivatives are determined mainly by the topological parameter, Balaban index (J) followed by the electronic parameter, LUMO and topological parameter, valence second order molecular connectivity index (2 χ v).
The QSAR model expressed by Eq. (3) was cross validated by its appreciable q 2 values (q 2 = 0.536) obtained by leave one out (LOO) method. The value of q 2 greater than 0.5 is the basic requirement for qualifying a QSAR model to be valid one. The comparison of observed and predicted antimicrobial activities is presented in Table 7 . It can be seen from the results that the observed and predicted antimicrobial activities lie close to each other as evidenced by their low residual values. The plot of predicted pMICsa against observed pMICsa (Fig. 1 ) also favors the model expressed by Eq. (3). Further, the plot of observed pMICsa vs residual pMICsa (Fig. 2 ) indicated that there was no systemic error in model development as the propagation of residuals was observed on both positive and negative sides [28].
Table 7.
Comparison of observed and predicted antibacterial and antifungal activity obtained by ot-QSAR model.
| Comp. | pMICsa (Eq. (3)) |
pMICbs (Eq. (4)) |
pMICec (Eq. (5)) |
pMICca (Eq. (6)) |
pMICan (Eq. (7)) |
||||||||||
|---|---|---|---|---|---|---|---|---|---|---|---|---|---|---|---|
| Obs. | Pre. | Res. | Obs. | Pre. | Res. | Obs. | Pre. | Res. | Obs. | Pre. | Res. | Obs. | Pre. | Res. | |
| 1 | 1.80 | 2.04 | −0.24 | 2.03 | 2.01 | 0.02 | 2.40 | 2.22 | 0.18 | 1.70 | 1.50 | 0.20 | 1.50 | 1.37 | 0.13 |
| 2 | 2.08 | 2.14 | −0.06 | 2.12 | 2.11 | 0.01 | 2.12 | 2.38 | −0.26 | 1.78 | 1.62 | 0.16 | 1.48 | 1.19 | 0.29 |
| 3 | 2.10 | 2.03 | 0.07 | 1.80 | 1.93 | −0.13 | 2.10 | 2.20 | −0.10 | 1.20 | 1.38 | −0.18 | 1.50 | 1.31 | 0.19 |
| 4 | 2.09 | 2.06 | 0.03 | 1.82 | 2.05 | −0.23 | 2.42 | 2.16 | 0.26 | 1.52 | 1.55 | −0.03 | 1.22 | 1.25 | −0.03 |
| 5 | 2.12 | 2.15 | −0.03 | 2.13 | 2.15 | −0.02 | 2.42 | 2.27 | 0.15 | 1.52 | 1.67 | −0.15 | 1.22 | 1.23 | −0.01 |
| 6 | 2.10 | 2.15 | −0.05 | 2.15 | 2.14 | 0.01 | 2.40 | 2.35 | 0.05 | 1.50 | 1.67 | −0.17 | 1.20 | 1.31 | −0.11 |
| 7 | 2.12 | 2.09 | 0.03 | 2.42 | 2.10 | 0.32 | 2.42 | 2.24 | 0.18 | 1.52 | 1.62 | −0.10 | 1.22 | 1.46 | −0.24 |
| 8 | 2.12 | 2.06 | 0.06 | 2.12 | 1.98 | 0.14 | 2.12 | 2.22 | −0.10 | 1.51 | 1.44 | 0.07 | 1.21 | 1.33 | −0.12 |
| 9 | 2.43 | 2.35 | 0.08 | 2.43 | 2.47 | −0.04 | 2.43 | 2.54 | −0.11 | 2.13 | 2.10 | 0.03 | 1.53 | 1.54 | −0.01 |
| 10 | 2.10 | 2.06 | 0.04 | 2.10 | 2.05 | 0.05 | 2.10 | 2.19 | −0.09 | 1.50 | 1.56 | −0.06 | 1.20 | 1.26 | −0.06 |
| 11 | 2.10 | 2.03 | 0.07 | 1.95 | 1.96 | −0.01 | 2.10 | 2.15 | −0.05 | 1.50 | 1.43 | 0.07 | 0.89 | 1.20 | −0.31 |
| 12 | 1.85 | 1.76 | 0.09 | 1.85 | 1.83 | 0.02 | 1.85 | 2.03 | −0.18 | 1.44 | 1.41 | 0.03 | 0.84 | 1.06 | −0.22 |
| 13 | 1.72 | 1.81 | −0.09 | 2.02 | 1.88 | 0.14 | 2.32 | 2.15 | 0.17 | 1.42 | 1.47 | −0.05 | 1.12 | 1.01 | 0.11 |
| 14 | 1.74 | 1.71 | 0.03 | 1.74 | 1.80 | −0.06 | 2.04 | 1.92 | 0.12 | 1.44 | 1.39 | 0.05 | 1.14 | 1.08 | 0.06 |
| 15 | 2.13 | 2.17 | −0.04 | 2.13 | 2.15 | −0.02 | 2.39 | 2.44 | −0.05 | 1.75 | 1.68 | 0.07 | 1.48 | 1.31 | 0.17 |
| 16 | 2.10 | 2.06 | 0.04 | 2.10 | 2.03 | 0.07 | 2.26 | 2.25 | 0.01 | 1.50 | 1.54 | −0.04 | 1.50 | 1.34 | 0.16 |
| 17 | 1.76 | 1.74 | 0.02 | 1.76 | 1.83 | −0.07 | 1.76 | 1.88 | −0.12 | 1.46 | 1.41 | 0.05 | 1.16 | 1.14 | 0.02 |
| 18 | 2.24 | 2.24 | 0.00 | 2.24 | 2.27 | −0.03 | 1.85 | 1.72 | 0.13 | 1.94 | 1.76 | 0.18 | 1.63 | 1.60 | 0.03 |
| 19 | 2.23 | 2.16 | 0.07 | 2.23 | 2.20 | 0.03 | 1.61 | 1.68 | −0.07 | 1.61 | 1.70 | −0.09 | 1.61 | 1.53 | 0.08 |
| 20 | 1.84 | 1.98 | −0.14 | 1.84 | 2.06 | −0.22 | 1.54 | 1.68 | −0.14 | 1.54 | 1.59 | −0.05 | 1.23 | 1.38 | −0.15 |
Fig. 1.

Plot of predicted pMICsa against the experimental pMICsa for the MLR model developed by Eq. (3).
Fig. 2.
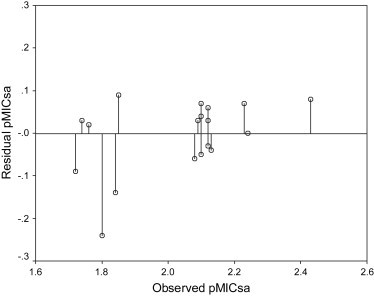
Plot of residual pMICsa against the experimental pMICsa by Eq. (3).
The MLR Eqs. (4), (5), (6), (7) were developed to predict the antimicrobial activity of benzimidazole derivatives against B. subtilis, E. coli, C. albicans and A. niger.
ot-QSAR model for antibacterial activity against B. subtilis
| (4) |
n = 20 r = 0.798 q 2 = 0.544 s = 0.128 F = 14.95
ot-QSAR model for antibacterial activity against E. coli
| (5) |
n = 20 r = 0.860 q 2 = 0.560 s = 0.157 F = 15.22
ot-QSAR model for antifungal activity against C. albicans
| (6) |
n = 20 r = 0.836 q 2 = 0.603 s = 0.117 F = 19.84
QSAR model for antifungal activity against A. niger
| (7) |
n = 20 r = 0.710 q 2 = 0.350 s = 0.166 F = 8.65
As in case of S. aureus, the MLR equations derived for B. subtilis and E. coli also indicated the importance of the topological parameter, Balaban index (J) followed by the electronic parameter, LUMO and topological parameter, valence second order molecular connectivity index (2 χ v) in describing antibacterial activity against B. subtilis and E. coli and antifungal activity against C. albicans. But in case of antifungal activity of benzimidazole derivatives against A. niger the MLR equation indicated importance of the lipophilic parameter, log of octanol–water partition coefficient log P and the electronic parameter, nuclear energy (Nu. E) in description of the activity.
As in case of Eq. (3), the predictive ability of Eqs. (4), (5), (6), (7) against respective microorganisms is supported by the low residual activity values (Table 7). Further the high q 2 values observed also supports the suitability of the QSAR models (q 2 > 0.5) described by Eqs. (5), (6). In case of the MLR models derived for A. niger, the q 2 value is less than 0.5, which shows that the developed models are invalid one. But one should not forget the recommendations of Golbraikh and Tropsha [29] who have reported that the only way to estimate the true predictive power of a QSAR model is to test their ability to predict accurately the biological activities of compounds. As the observed and predicted values are close to each other (Table 7), the QSAR model for A. niger [Eq. (7)] is a valid one.
It is important to note that all the equations were derived using the entire data set as there were no outliers in the data set. Generally for QSAR studies, the biological activities of compounds should span 2–3 orders of magnitude. But in the present study the range of antimicrobial activities of the synthesized compounds is within one order of magnitude. But it is important to note that the predictability of the QSAR models developed in the present study is highly evidenced by the low residual values. This is in accordance with results suggested by Bajaj et al. [30], who stated that the reliability of the QSAR model lies in its predictive ability even though the activity data are in the narrow range. Further, recent literature reveals that the QSAR have been applied to describe the relationship between narrow range of biological activity and physicochemical properties of the molecules [31], [32], [33]. When biological activity data lies in the narrow range, the presence of minimum standard deviation of the biological activity justifies its use in QSAR studies [34], [35]. The minimum standard deviation (Table 2) observed in the antimicrobial activity data justifies its use in QSAR studies.
3.2.2. Development of multi-target QSAR model
According to the above ot-QSAR models one should use five different equations to predict the activity of a new compound against the five microbial species. The ot-QSAR models, which are almost in all the literature, become unpractical or complicated to use when we have to predict each compound results for more than one-target. In these cases we have to develop one ot-QSAR for each target. However, very recently the interest has been increased in development of multi-target QSAR (mt-QSAR) models. In opposition to ot-QSAR, the mt-QSAR model is a single equation that considers the nature of molecular descriptors which are common and essential for describing the antimicrobial activity [36], [37], [38], [39], [40].
In the present study we have attempted to develop three different types of mt-QSAR models viz. mt-QSAR model for describing antibacterial activity of synthesized compounds against S. aureus, B. subtilis and E. coli, mt-QSAR model for describing antifungal activity of synthesized compounds against C. albicans and A. niger as well a common mt-QSAR model for describing the antimicrobial activity of synthesized benzimidazole derivatives against all the above mentioned microorganisms.
In order to develop mt-QSAR models, we have calculated the average antibacterial activity [pMICb = (pMICsa + pMICbs + pMICec)/3], antifungal activity [pMICf = (pMICca + pMICan)/2] and antimicrobial activity values [pMICam = (pMICsa + pMICbs + pMICec + pMICca + pMICan)/5] of benzimidazole derivatives which are presented in Table 2. These average activity values were also correlated with the molecular descriptors of synthesized compounds (Table 6). The LR model derived for the antibacterial activity of benzimidazole derivatives indicated the importance of topological parameter, Balaban index (J) [Eq. (8)].
mt-QSAR model for antibacterial activity
| (8) |
n = 20 r = 0.605 q 2 = 0.245 s = 0.144 F = 10.44
The addition of electronic parameter, LUMO and topological parameter, valence second order molecular connectivity index (2 χ v) improved the correlation to 0.732 [Eq. (9)] and 0.805 [Eq. (10)] respectively.
mt-QSAR model for antibacterial activity
| (9) |
n = 20 r = 0.732 q 2 = 0.280 s = 0.127 F = 9.82
mt-QSAR model for antibacterial activity
| (10) |
n = 20 r = 0.805 q 2 = 0.541 s = 0.110 F = 15.74
Based on the above-improved correlations, we decided to study the addition of electronic parameter, LUMO and topological parameter, valence second order molecular connectivity index (2 χ v) to the topological parameter, Balaban index (J). This addition resulted in appreciable improvement in the statistical parameters as depicted in [Eq. (11)].
mt-QSAR model for antibacterial activity
| (11) |
n = 20 r = 0.925 q 2 = 0.768 s = 0.073 F = 31.61
The mt-QSAR MLR model for antifungal activity revealed the importance of electronic parameter, LUMO and the topological parameter, Balaban index (J) in describing antifungal activity [Eq. (12)].
mt-QSAR model for antifungal activity
| (12) |
n = 20 r = 0.812 q 2 = 0.567 s = 0.115 F = 16.47
The mt-QSAR MLR model for antimicrobial activity revealed the importance of the topological parameter, Balaban index (J) followed by the electronic parameter, LUMO and topological parameter, valence second order molecular connectivity index (2 χ v) [Eq. (13)].
mt-QSAR model for antimicrobial activity
| (13) |
n = 20 r = 0.940 q 2 = 0.809 s = 0.057 F = 41.10
The predictability of Eqs. (11)–(13) was verified by calculating the antibacterial, antifungal and antimicrobial activities for substituted benzimidazoles respectively and the low residual activity values indicated the high predictability of above mentioned equations (Table 8 ). Further the plot of observed pMICam and predicted pMICam (Fig. 3 ) also in favor of the mt-QSAR target model for antimicrobial activity. The propagation of activity values on both sides of zero, in the plot of observed pMICam against residual pMICam, indicated that there was no systemic error in the development of mt-QSAR model (Fig. 4 ). The other statistically significant ot-QSAR and mt-QSAR models derived are presented in Table 9 .
Table 8.
Comparison of observed and predicted antibacterial, antifungal and antimicrobial activity obtained by mt-QSAR model.
| Comp. | pMICab (Eq. (11)) |
pMICaf (Eq. (12)) |
pMICam (Eq. (13)) |
||||||
|---|---|---|---|---|---|---|---|---|---|
| Obs. | Pre. | Res. | Obs. | Pre. | Res. | Obs. | Pre. | Res. | |
| 1 | 2.08 | 2.09 | −0.01 | 1.60 | 1.40 | 0.20 | 1.89 | 1.81 | 0.08 |
| 2 | 2.11 | 2.22 | −0.11 | 1.63 | 1.49 | 0.14 | 1.92 | 1.92 | 0.00 |
| 3 | 2.00 | 2.06 | −0.06 | 1.35 | 1.33 | 0.02 | 1.74 | 1.76 | −0.02 |
| 4 | 2.11 | 2.09 | 0.02 | 1.37 | 1.43 | −0.06 | 1.81 | 1.83 | −0.02 |
| 5 | 2.22 | 2.19 | 0.03 | 1.37 | 1.53 | −0.16 | 1.88 | 1.92 | −0.04 |
| 6 | 2.22 | 2.22 | 0.00 | 1.35 | 1.52 | −0.17 | 1.87 | 1.94 | −0.07 |
| 7 | 2.32 | 2.15 | 0.17 | 1.37 | 1.48 | −0.11 | 1.94 | 1.88 | 0.06 |
| 8 | 2.12 | 2.09 | 0.03 | 1.36 | 1.37 | −0.01 | 1.82 | 1.80 | 0.02 |
| 9 | 2.43 | 2.46 | −0.03 | 1.83 | 1.82 | 0.01 | 2.19 | 2.20 | −0.01 |
| 10 | 2.10 | 2.10 | 0.00 | 1.35 | 1.43 | −0.08 | 1.80 | 1.83 | −0.03 |
| 11 | 2.05 | 2.05 | 0.00 | 1.20 | 1.36 | −0.16 | 1.71 | 1.77 | −0.06 |
| 12 | 1.85 | 1.87 | −0.02 | 1.14 | 1.23 | −0.09 | 1.57 | 1.61 | −0.04 |
| 13 | 2.02 | 1.95 | 0.07 | 1.27 | 1.27 | 0.00 | 1.72 | 1.68 | 0.04 |
| 14 | 1.84 | 1.80 | 0.04 | 1.29 | 1.20 | 0.09 | 1.62 | 1.56 | 0.06 |
| 15 | 2.22 | 2.27 | −0.05 | 1.62 | 1.53 | 0.09 | 1.98 | 1.97 | 0.01 |
| 16 | 2.15 | 2.12 | 0.03 | 1.50 | 1.42 | 0.08 | 1.89 | 1.84 | 0.05 |
| 17 | 1.76 | 1.81 | −0.05 | 1.31 | 1.22 | 0.09 | 1.58 | 1.58 | 0.00 |
| 18 | 2.11 | 2.05 | 0.06 | 1.79 | 1.64 | 0.15 | 1.98 | 1.90 | 0.08 |
| 19 | 2.02 | 1.98 | 0.04 | 1.61 | 1.58 | 0.03 | 1.86 | 1.84 | 0.02 |
| 20 | 1.74 | 1.88 | −0.14 | 1.39 | 1.44 | −0.05 | 1.60 | 1.72 | −0.12 |
Fig. 3.

Plot of predicted pMICam against the experimental pMICam values for the MLR model developed by Eq. (13).
Fig. 4.

Plot of predicted pMICam values against the experimental pMICam values for the MLR model developed by Eq. (13).
Table 9.
Regression analysis and quality of correlation for modeling antibacterial and antifungal activity of synthesized Benzimidazole derivatives.
| S. No. | QSAR model | n | r | q2 | s | F |
|---|---|---|---|---|---|---|
| B. subtilis | ||||||
| 1 | pMICbs = −1.383J + 3.959 | 20 | 0.610 | 0.269 | 0.164 | 10.66 |
| E. coli | ||||||
| 2 | pMICec = −0.112 2χv + 3.034 | 20 | 0.528 | 0.108 | 0.247 | 6.97 |
| 3 | pMICec = −0.224 2χv + 2.622J + 7.559 | 20 | 0.823 | 0.558 | 0.170 | 17.90 |
| C. albicans | ||||||
| 4 | pMICca = −0.923 LUMO + 0.302 | 20 | 0.656 | 0.237 | 0.157 | 13.60 |
| A. niger | ||||||
| 5 | pMICan = 0.00002 NE + 0.556 | 20 | 0.636 | 0.314 | 0.177 | 12.28 |
| Antifungal activity | ||||||
| 6 | pMICaf = −1.319J + 3.257 | 20 | 0.629 | 0.278 | 0.149 | 11.81 |
| Antimicrobial activity | ||||||
| 7 | pMICam = −1.244J + 3.535 | 20 | 0.707 | 0.419 | 0.113 | 18.03 |
| 8 | pMICam = −1.370 J–0.568 LUMO + 2.869 | 20 | 0.877 | 0.705 | 0.079 | 28.60 |
| 9 | pMICam = −0.045 2χv – 1.680 LUMO + 4.503 | 20 | 0.767 | 0.456 | 0.106 | 12.15 |
The Balaban index J is a variant of connectivity index and represents extended connectivity. It is a good descriptor for the shape of molecules and is one of the widely used topological indices for QSAR and QSPR studies. The Balaban index of a connected (molecular) graph G is defined as [41]:
where, m is the number of edges, μ is the cyclomatic number, Du is the sum of distances between vertex u and all other vertices of G, and the summation goes over all edges from the edge set E (G). The electronic parameter LUMO, which denotes the energy of lowest unoccupied molecular orbital directly relates to the electron affinity and characterizes the sensibility of the molecule towards an attack by necleophile. The contribution of LUMO in describing antimicrobial activity may be attributed to the interaction of benzimidazole derivatives with nucleophilic amino acid residue like cysteine of microorganisms [42]. The topological descriptor, i.e. the valence second order molecular connectivity index encodes information related to the degree of stargraph likeness and takes a large value for more linear molecule [43]. The trend in Eq. (13) indicated that higher the values of J, LUMO and 2 χ v lower will be the antimicrobial activity of benzimidazole derivatives.
The residual activity values in the case of mt-QSAR model for antimicrobial activity are less when compared to the residuals of one-target models (Table 7) as well the multi-target models for antibacterial and antifungal activities (Table 8). This mt-QSAR equation (Eq. (13)) can be used to predict the activity of substituted benzimidazoles against different microbial species. Furthermore, the topological parameter, Balaban index (J) followed by the electronic parameter, LUMO and topological parameter, valence second order molecular connectivity index (2 χ v) is describing the antimicrobial activity of 4-[1-(substituted aryl/alkyl carbonyl)-benzoimidazol-2-yl]-benzenesulfonic acids (1-20).
It is important to mention here that the development of multi-QSAR target models exhibited the following advantages over one-target QSAR models: (a). There is an improvement in statistical parameters when compared to one-target models (improvement in r, q2, etc. cf. Eq. (13) with Eqs. (1), (2), (3), (4), (5), (6), (7)). (b). No change in the trend of molecular descriptors has been observed, i.e. all the three parameters, i.e. J, LUMO and 2 χ v showed the same negative correlation with antimicrobial activity as observed in the case of one-target models. (c). There was a significant decrease in residual values when compared to the residual values observed in one-target QSAR models, i.e. mt-QSAR model has better predictability than the ot-QSAR model.
3.3. Antiviral activity
A broad antiviral screening of the 4-[1-(substituted aryl/alkyl carbonyl)-benzoimidazol-2-yl]-benzenesulfonic acids (1-20) was performed against a variety of DNA and RNA viruses (Table 10, Table 11, Table 12, Table 13, Table 14 ). None of the compounds were inhibitory to the virus-induced cytopathicity at subtoxic concentrations.
Table 10.
Anti-Feline Corona Virus (FIPV) and anti-Feline Herpes Virus activity and cytotoxicity of synthesized benzimidazole derivatives in CRFK cell cultures.
| Comp. | CC50a (μg/mL) | EC50b (μg/mL) |
|
|---|---|---|---|
| Feline Herpes Virus (FIPV) | Feline Corona Virus | ||
| 1 | 11 | >4 | >4 |
| 2 | >100 | >100 | >100 |
| 3 | >100 | >100 | >100 |
| 4 | >100 | >100 | >100 |
| 5 | >100 | >100 | >100 |
| 6 | >100 | >100 | >100 |
| 7 | >100 | >100 | >100 |
| 8 | >100 | >100 | >100 |
| 9 | >100 | >100 | >100 |
| 10 | >100 | >100 | >100 |
| 11 | >100 | >100 | >100 |
| 12 | >100 | >100 | >100 |
| 13 | 82 | >20 | >20 |
| 14 | >100 | >100 | >100 |
| 15 | >100 | >100 | >100 |
| 16 | >100 | >100 | >100 |
| 17 | >100 | >100 | >100 |
| 18 | >100 | >100 | >100 |
| 19 | >100 | >100 | >100 |
| 20 | >100 | >100 | >100 |
| HHA | >100 | 32.6 | 2.0 |
| UDA | 14 | 1.5 | 0.4 |
| Ganciclovir (μM) | >100 | >100 | 1.7 |
CRFK cells: Crandell–Rees Feline Kidney cells.
50% Cytotoxic concentration, as determined by measuring the cell viability with the colorimetric formazan-based MTS assay.
50% Effective concentration, or compound concentration resulting in 50% inhibition of the virus-induced cytopathic effect, as determined by measuring the cell viability with the colorimetric formazan-based MTS assay.
Table 11.
Cytotoxicity and antiviral activity of synthesized benzimidazole derivatives in HEL cell cultures.
| Comp. | Minimum cytotoxic concentrationa (μg/mL) | EC50b (μg/mL) |
||||
|---|---|---|---|---|---|---|
| Herpes simplex virus-1 (KOS) | Herpes simplex virus-2 (G) | Vaccinia virus | Vesicular stomatitis virus | Herpes simplex virus-1 TK− KOS ACVr | ||
| 1 | >100 | >100 | >100 | >100 | >100 | >100 |
| 2 | >100 | >100 | >100 | >100 | >100 | >100 |
| 3 | >100 | >100 | >100 | >100 | >100 | >100 |
| 4 | >100 | >100 | >100 | >100 | >100 | >100 |
| 5 | >100 | >100 | >100 | >100 | >100 | >100 |
| 6 | >100 | >100 | >100 | >100 | >100 | >100 |
| 7 | 100 | >20 | >20 | >20 | >20 | >20 |
| 8 | >100 | >100 | >100 | >100 | >100 | >100 |
| 9 | >100 | >100 | >100 | >100 | >100 | >100 |
| 10 | >100 | >100 | >100 | >100 | >100 | >100 |
| 11 | >100 | >100 | >100 | >100 | >100 | >100 |
| 12 | >100 | >100 | >100 | >100 | >100 | >100 |
| 13 | 100 | >20 | >20 | >20 | >20 | >20 |
| 14 | >100 | >100 | >100 | >100 | >100 | >100 |
| 15 | >100 | >100 | >100 | >100 | >100 | >100 |
| 16 | >100 | >100 | >100 | >100 | >100 | >100 |
| 17 | >100 | >100 | >100 | >100 | >100 | >100 |
| 18 | >100 | >100 | >100 | >100 | >100 | >100 |
| 19 | >100 | >100 | >100 | >100 | >100 | >100 |
| 20 | >100 | >100 | >100 | >100 | >100 | >100 |
| Brivudin (μM) | >250 | 0.08 | 250 | 112 | >250 | >250 |
| Ribavirin (μM) | >250 | 1 | 2 | 10 | >250 | 2 |
| Cidofovir (μM) | >250 | 0.4 | 0.2 | >250 | >250 | >250 |
| Ganciclovir (μM) | >100 | 0.03 | 0.03 | >100 | >100 | 58 |
Required to cause a microscopically detectable alteration of normal cell morphology.
Required to reduce virus-induced cytopathogenicity by 50%.
Table 12.
Cytotoxicity and antiviral activity of synthesized benzimidazole derivatives in HeLa cell cultures.
| Comp. | Cytotoxicity (μg/ml) |
EC50c (μg/ml) |
||||||
|---|---|---|---|---|---|---|---|---|
| CC50a | Minimum cytotoxic concentrationb | Vesicular stomatitis virus |
Coxsackie virus B4 |
Respiratory syncytial virus |
||||
| visual CPE score | MTS | visual CPE score | MTS | visual CPE score | MTS | |||
| 1 | >100 | ≥20 | >20 | >20 | >20 | >20 | >20 | >20 |
| 2 | >100 | >100 | >100 | >100 | >100 | >100 | >100 | >100 |
| 3 | >100 | >100 | >100 | >100 | >100 | >100 | >100 | >100 |
| 4 | >100 | >100 | >100 | >100 | >100 | >100 | >100 | >100 |
| 5 | >100 | >100 | >100 | >100 | >100 | >100 | >100 | >100 |
| 6 | >100 | >100 | >100 | >100 | >100 | >100 | >100 | >100 |
| 7 | >100 | >100 | >100 | >100 | >100 | >100 | >100 | >100 |
| 8 | >100 | >100 | >100 | >100 | >100 | >100 | >100 | >100 |
| 9 | >100 | >100 | >100 | >100 | >100 | >100 | >100 | >100 |
| 10 | >100 | >100 | >100 | >100 | >100 | >100 | >100 | >100 |
| 11 | >100 | >100 | >100 | >100 | >100 | >100 | >100 | >100 |
| 12 | >100 | >100 | >100 | >100 | >100 | >100 | >100 | >100 |
| 13 | >100 | >100 | >100 | >100 | >100 | >100 | >100 | >100 |
| 14 | >100 | >100 | >100 | >100 | >100 | >100 | >100 | >100 |
| 15 | >100 | >100 | >100 | >100 | >100 | >100 | >100 | >100 |
| 16 | >100 | >100 | >100 | >100 | >100 | >100 | >100 | >100 |
| 17 | >100 | >100 | >100 | >100 | >100 | >100 | >100 | >100 |
| 18 | >100 | >100 | >100 | >100 | >100 | >100 | >100 | >100 |
| 19 | >100 | >100 | >100 | >100 | >100 | >100 | >100 | >100 |
| 20 | >100 | >100 | >100 | >100 | >100 | >100 | >100 | >100 |
| DS-5000 | >100 | >100 | >100 | >100 | 20 | 80.5 | 4 | 3.6 |
| (S)-DHPA (μM) | >250 | >250 | >250 | >250 | >250 | >250 | >250 | >250 |
| Ribavirin (μM) | >250 | >250 | 10 | 3.6 | 50 | 14 | 6 | 2.8 |
50% Cytotoxic concentration, as determined by measuring the cell viability with the colorimetric formazan-based MTS assay.
Minimum compound concentration that causes a microscopically detectable alteration of normal cell morphology.
50% Effective concentration, or concentration resulting in 50% inhibition of virus-induced cytopathic effect, as determined by visual scoring of the CPE, or by measuring the cell viability with the colorimetric formazan-based MTS assay.
Table 13.
Cytotoxicity and antiinfluenza activity of synthesized benzimidazole derivatives in MDCK cell cultures.
| Comp. | Cytotoxicity (μg/ml) |
EC50c (μg/ml) |
||||||
|---|---|---|---|---|---|---|---|---|
| CC50a | MCCb | Influenza A H1N1 subtype |
Influenza A H3N2 subtype |
Influenza B |
||||
| visual CPE score | MTS | visual CPE score | MTS | visual CPE score | MTS | |||
| 1 | 4.1 | ≥4 | >4 | >4 | >4 | >4 | >4 | >4 |
| 2 | >100 | >100 | >100 | >100 | >100 | >100 | >100 | >100 |
| 3 | 46.8 | 20 | >4 | >4 | >4 | >4 | >4 | >4 |
| 4 | >100 | >100 | >100 | >100 | >100 | >100 | >100 | >100 |
| 5 | >100 | >100 | >100 | >100 | >100 | >100 | >100 | >100 |
| 6 | >100 | 100 | >20 | >20 | >20 | >20 | >20 | >20 |
| 7 | 54.0 | 20 | >4 | >4 | >4 | >4 | >4 | >4 |
| 8 | >100 | >100 | >100 | >100 | >100 | >100 | >100 | >100 |
| 9 | >100 | >100 | >100 | >100 | >100 | >100 | >100 | >100 |
| 10 | >100 | >100 | >100 | >100 | >100 | >100 | >100 | >100 |
| 11 | >100 | >100 | >100 | >100 | >100 | >100 | >100 | >100 |
| 12 | >100 | >100 | >100 | >100 | >100 | >100 | >100 | >100 |
| 13 | 14.1 | ≥0.8 | >0.8 | >0.8 | >0.8 | >0.8 | >0.8 | >0.8 |
| 14 | >100 | >100 | >100 | >100 | >100 | >100 | >100 | >100 |
| 15 | >100 | >100 | >100 | >100 | >100 | >100 | >100 | >100 |
| 16 | >100 | 100 | >20 | >20 | >20 | >20 | >20 | >20 |
| 17 | >100 | >100 | >100 | >100 | >100 | >100 | >100 | >100 |
| 18 | >100 | >100 | >100 | >100 | >100 | >100 | >100 | >100 |
| 19 | >100 | >100 | >100 | >100 | >100 | >100 | >100 | >100 |
| 20 | >100 | >100 | >100 | >100 | >100 | >100 | >100 | >100 |
| Oseltamivir carboxylate (μM) | >100 | >100 | 12 | 28 | 9 | 6.9 | >100 | >100 |
| Ribavirin (μM) | >100 | >100 | 9 | 12 | 9 | 8.4 | 7 | 4.3 |
| Amantadine (μM) | >200 | >200 | 18 | 44 | 0.3 | 0.2 | >200 | >200 |
| Rimantadine (μM) | >200 | >200 | 4 | 12 | 0.03 | 0.02 | >200 | >200 |
50% Cytotoxic concentration, as determined by measuring the cell viability with the colorimetric formazan-based MTS assay.
Minimum cytotoxic concentration, i.e. Minimum compound concentration that causes a microscopically detectable alteration of normal cell morphology.
50% Effective concentration, or compound concentration resulting in 50% inhibition of the virus-induced cytopathic effect, as determined by visual scoring of the CPE, or by measuring the cell viability with the colorimetric formazan-based MTS assay.
Table 14.
Cytotoxicity and antiviral activity of synthesized benzimidazole derivatives in in Vero cell cultures.
| Comp. | Minimum cytotoxic concentrationa (μg/ml) | EC50b (μg/ml) |
||||
|---|---|---|---|---|---|---|
| Para-influenza-3 virus | Reovirus-1 | Sindbis virus | Coxsackie virus B4 | Punta Toro virus | ||
| 1 | 20 | >4 | >4 | >4 | >4 | >4 |
| 2 | >100 | >100 | >100 | >100 | >100 | >100 |
| 3 | >100 | >100 | >100 | >100 | >100 | >100 |
| 4 | >100 | >100 | >100 | >100 | >100 | >100 |
| 5 | >100 | >100 | >100 | >100 | >100 | >100 |
| 6 | >100 | >100 | >100 | >100 | >100 | >100 |
| 7 | >100 | >100 | >100 | >100 | >100 | >100 |
| 8 | >100 | >100 | >100 | >100 | >100 | >100 |
| 9 | >100 | >100 | >100 | >100 | >100 | >100 |
| 10 | >100 | >100 | >100 | >100 | >100 | >100 |
| 11 | >100 | >100 | >100 | >100 | >100 | >100 |
| 12 | >100 | >100 | >100 | >100 | >100 | >100 |
| 13 | >100 | >100 | >100 | >100 | >100 | >100 |
| 14 | >100 | >100 | >100 | >100 | >100 | >100 |
| 15 | >100 | >100 | >100 | >100 | >100 | >100 |
| 16 | >100 | >100 | >100 | >100 | >100 | >100 |
| 17 | >100 | >100 | >100 | >100 | >100 | >100 |
| 18 | >100 | >100 | >100 | >100 | >100 | >100 |
| 19 | >100 | >100 | >100 | >100 | >100 | >100 |
| 20 | >100 | >100 | >100 | >100 | >100 | >100 |
| DS-5000 | >100 | >100 | >100 | 100 | 58 | 100 |
| (S)-DHPA (μM) | >250 | >250 | >250 | >250 | >250 | >250 |
| Ribavirin (μM) | >250 | 95 | 112 | >250 | 250 | 112 |
Required to cause a microscopically detectable alteration of normal cell morphology.
Required to reduce virus-induced cytopathogenicity by 50%.
3.4. Structure activity relationship
From the results of antimicrobial and antiviral activities, the following structure activity relationship can be drawn:
-
1.
The results of antibacterial activity indicated that compound 9, 4-[1-(4-Nitrobenzoyl)-1H-benzoimidazol-2-yl]-benzenesulfonic acid was effective against all the three bacterial species under test. It may be due to the presence of the electron withdrawing nitro group. The role of electron withdrawing group in increasing the antimicrobial activity is similar to the results of Sharma et al. [44].
-
2.
The results of antifungal activity indicated that compound 18, 4-(1-octadec-9-enoyl-1H-benzoimidazol-2-yl)-benzenesulfonic acid was effective against both tested fungal strains.
-
3.
The comparison of most effective antibacterial and antifungal compound gave information that the aromatic acid substitution at N1 of benzimidazole is required for antibacterial activity and aliphatic acid substitution at N1 of benzimidazole is required for antifungal activity. This indicated that different structural requirements are essential for binding of drug to bacterial or fungal targets respectively [45].
-
4.
None of the compounds were endowed with antiviral activity at subtoxic concentrations.
4. Conclusion
A series of 4-[1-(substituted aryl/alkyl carbonyl)-benzoimidazol-2-yl]-benzenesulfonic acids (1-–20), was synthesized by the reaction of 4-(1H-benzoimidazol-2-yl)-benzenesulfonic acid with corresponding aryl/alkyl acid chlorides. The synthesized compounds were characterized by physicochemical and spectral means and the IR and NMR spectral data are found in agreement with the assigned molecular structures. Further, the synthesized compounds were evaluated for their in vitro antimicrobial activities against the bacterial strains S. aureus, B. subtilis; E. coli and fungal strains – A. niger and C. albicans by tube dilution method. The antimicrobial screening results indicated that compounds 4-[1-(4-Nitrobenzoyl)-1H-benzoimidazol-2-yl]-benzenesulfonic acid (9) and 4-(1-octadec-9-enoyl-1H-benzoimidazol-2-yl)-benzenesulfonic acid (18) were the most active ones. The antiviral evaluations revealed no specific antiviral activity for the test compounds. The QSAR study carried out to find the relationship between physicochemical parameters and antimicrobial activity of benzimidazole derivatives indicated the importance of the topological parameter, Balaban index (J) followed by the electronic parameter, LUMO and the topological parameter, valence second order molecular connectivity index (2 χ v) in describing the antimicrobial activity of 4-[1-(substituted aryl/alkyl carbonyl)-benzoimidazol-2-yl]-benzenesulfonic acids (1-20).
4.1. Synthesis of 4-[1-(2-amino-benzoyl-1H-benzoimidazol-2-yl]-benzenesulfonic acid (1)
4-Amino-benzenesulfonic acid (0.13 mol) in hydrochloric acid/water mixture (1:1) was diazotized using solution of sodium nitrite at 0–10 °C. To the diazotized mixture, benzimidazole (0.004 mol) was added with vigorous shaking. A solution of sodium acetate (40 g in 100 ml) was added drop wise to the above mixture by maintaining temperature at 5–10 °C. The above solution was stirred initially for 3 h at cold condition followed by continuation of stirring at room temperature for 48 h. The product, 4-(1H-benzoimidazol-2-yl)-benzenesulfonic acid obtained was filtered, dried and recrystallized using alcohol.
A solution of 4-(1H-benzoimidazol-2-yl)-benzenesulfonic acid (0.002 mol) in diethyl ether (50 ml) was added with a solution of acid chloride of anthranilic acid (0.002 mol) in diethyl ether (50 ml). The above mixture was stirred for 24 h at room temperature. The resultant product, 4-[1-(2-amino-benzoyl-1H-benzoimidazol-2-yl]-benzenesulfonic acid was isolated by evaporation of ether and purified by recrystallisation with methanol.
The compounds 2-20 are synthesized by the similar procedure followed for compound 1 using corresponding aryl/alkyl acid chlorides with 4-(1H-benzoimidazol-2-yl)-benzenesulfonic acid.
Compound 1: Mp (°C) 116–118; Yield-70.9%; 1H NMR (DMSO) δ ppm: 6.54–8.56 (m, 12H, Ar–H of ArNH2, ArSO3H and benzimidazole), 2.50 (s, 1H, OH of SO3H); IR (KBr pellets, cm−1): 1618.29 (C O str., tertiary amide), 755.51 (OCN bending), 1442.0 (C C str., skeletal vibration of phenyl nucleus), 1233.60 (SO3 asymmetric str.), 3481.81 (NH asymmetric str., primary amine).
Compound 6: Mp (°C) 98–100; Yield-101.6%; 1H NMR (DMSO) δ ppm: 7.0–8.11 (m, 12H, Ar–H of ArOH ArSO3H and benzimidazole), 2.50 (s, 1H, OH of SO3H); IR (KBr pellets, cm−1): 1610.90 (C O str., tertiary amide), 750.67 (OCN bending), 1452.01 (C C str., skeletal vibration of phenyl nucleus), 1106.82 (SO3 asymmetric str.), 1715.01 (CH str., aromatic), 991.75 (C–C out of plane bending; 1,3-disubstituted benzene).
Compound 8: Mp (°C) 90–92; Yield-60.9%; 1H NMR (DMSO) δ ppm: 6.95–8.10 (m, 12H, Ar–H of ArOCH3, ArSO3H and benzimidazole), 3.78 (s, 3H, OH, OCH3); IR (KBr pellets, cm−1): 1601.31 (C O str., tertiary amide), 751.4 (OCN bending), 1454.21 (C C str., skeletal vibration of phenyl nucleus), 1258.08 (SO3 asymmetric str.), 1687.12 (CH str., aromatic), 1425.61(CH3 bending of OCH3).
Compound 14: Mp (°C) 102–104; Yield-33.5%; 1H NMR (DMSO) δ ppm: 6.90–7.84 (m, 8H, Ar–H of ArSO3H and benzimidazole), 3.66–3.72 (d, 2H, CH2 of C CH2; J trans = 18 Hz); IR (KBr pellets, cm−1): 1613.57 (C O str., tertiary amide), 755.49 (OCN bending), 1450.12 (C C str., skeletal vibration of phenyl nucleus), 1233.56 (SO3 asymmetric stretch), 1004.74 (C–H out of plane bending of C(CH3) = CH2), 1384.75 (CH in plane bending of C(CH3) = CH2), 1531.84 (C C str.), 1262.16 (CH in plane bending of phenyl ring).
Compound 15: Mp (°C) 110–112; Yield-44.0%; 1H NMR (DMSO) δ ppm: 7.27–8.12 (m, 8H, Ar–H of ArSO3H and benzimidazole), 2.50 (s, 1H, OH of SO3H), 8.46–9.66 (m, 4H, H of pyridine ring); IR (KBr, pellets, cm−1): 1617.65 (C O str., tertiary amide), 751.40 (OCN bending), 1450.12 (C C str., skeletal vibration of phenyl nucleus), 1233.56 (SO3 asymmetric stretch), 1531.84 (C C str.), 1266.25 (CH in plane bending of phenyl ring), 1392.92 (C–N str. of tertiary amide), 829.04 (C–H out of plane bending of 3-substituted pyridine).
Compound 20: Mp (°C) 156–158; Yield-35.8%; 1H NMR (DMSO) δ ppm: 7.12–7.88 (m, 12H, Ar–H of ArCH3, ArSO3H and benzimidazole), 2.50 (s, 3H, CH3 of ArCH3); IR (KBr pellets, cm−1): 1621.74 (C O str., tertiary amide), 1450.12 (C C str., skeletal vibration of phenyl nucleus), 1192.7 (SO3 asymmetric stretch), 808.61 (S–N str.), 1033.34 (SO2 symmetric str.), 747.32 (OCN bending).
4.2. Evaluation of antimicrobial activity
4.2.1. Determination of minimum inhibitory concentration
The antimicrobial activity was performed against Gram-positive bacteria: S. aureus, Bacillus sublitis, Gram-negative bacterium: E. coli and fungal strains: C. albicans and A. niger by tube dilution method. Dilutions of test and standard compounds [ciprofloxacin (antibacterial) and fluconazole (antifungal)] were prepared in double strength nutrient broth – I.P. (bacteria) and Sabouraud dextrose broth I.P. (fungi) [46]. The samples were incubated at 37 °C for 24 h (bacteria), at 25 °C for 7 d (A. niger) and at 37 °C for 48 h (C. albicans), respectively, and the results were recorded in terms of MIC (the lowest concentration of test substance which inhibited the growth of microorganisms).
4.2.2. Determination of minimum bactericidal/fungicidal concentration (MBC/MFC)
The minimum bactericidal concentration (MBC) and fungicidal concentration (MFC) were determined by subculturing 100 μL of culture from each tube that remained clear in the MIC determination into fresh medium. MBC and MFC values represent the lowest concentration of compound that produces a 99.9% end point reduction [47].
4.3. QSAR studies
The structures of substituted benzimidazole derivatives are first pre-optimized with the Molecular Mechanics Force Field (MM+) procedure included in Hyperchem 6.03 [48] and the resulting geometries are further refined by means of the semiempirical method PM3 (parametric Method-3). We chose a gradient norm limit of 0.01 kcal/A° for the geometry optimization. The lowest energy structure was used for each molecule to calculate physicochemical properties using TSAR 3.3 software for Windows [49]. Further, the regression analysis was performed using the SPSS software package [50].
The predictive powers of the equations were validated by leave one out (LOO) cross validation method, where a model is built with N-1 compounds and Nth compound is predicted. Each compound is left out of the model derivation and predicted in turn. An indication of the performance is obtained from cross validated q 2) method which is defined as
where, Y predicted, Y actual and Y mean are predicted, actual and mean values of target property (pMIC) respectively. Σ (Y predicted − Y actual)2 is predictive residual error sum of squares [51].
4.4. Evaluation of antiviral activity
4.4.1. Antiviral assays
The antiviral screening of the 4-[1-(substituted aryl/alkyl carbonyl)-benzoimidazol-2-yl]-benzenesulfonic acids (1-20) was performed against Feline Corona virus (FIPV), Feline Herpes virus in CRFK cell cultures; Herpes simplex virus-1 (KOS) [HSV-1 KOS], Herpes simplex virus-2 (G) [HSV-2G], Vaccinia virus [VV], Vesicular stomatitis virus [VSV], Herpes simplex virus-1 TK− KOS ACVr [HSV-1 TK− KOS ACVr] in HEL cell cultures; Vesicular stomatitis virus (VSV), Coxsackie virus B4, Respiratory syncytial virus in HeLa cell cultures; Para-influenza-3 virus, Reovirus-1, Sindbis virus, Coxsackie virus B4, Punta Toro virus in Vero cell cultures; Influenza A virus H1N1 subtype, Influenza A virus H3N2 subtype and influenza B virus in MDCK cell cultures, human immunodeficiency virus type 1 (HIV-1)(IIIB) and HIV-2(ROD) in MT-4 cell cultures and the results were expressed as the 50% effective concentration (EC50) or drug concentration required to inhibit virus-induced cytopathicity by 50%. Read-out was through microscopical inspection or the MTS viability staining method. Cells, grown in 96-well plates, were infected with 100 CCID50 of virus, one CCID50 being the 50% cell culture infective dose in the presence of serial dilutions of the compounds. The cultures were further incubated at 37 °C for several (2–4) days, until complete cytopathicity was observed in the infected and untreated virus control.
4.4.2. Cytotoxic assays
The cytotoxicity of the compounds was evaluated in parallel with their antiviral activity in uninfected cell cultures, and is expressed as the minimum cytotoxic concentration (MCC) that causes a microscopically detectable alteration of normal cell morphology (HEL, HeLa, CRFK, MDCK and Vero cells).
Acknowledgements
We would like to thank Mrs. Leentje Persoons, Frieda De Meyer, Kristien Erven and Kris Uyttersprot, Rega Institute for Medical Research, Belgium for their excellent technical assistance in the evaluation of antiviral activity. The antiviral evaluations were supported by the K.U. Leuven (GOA no. 10/014).
References
- 1.Saleh M., Abbott S., Lauzon V.C., Penney C., Zacharie B. Bioorg. Med. Chem. Lett. 2010;20:945–949. doi: 10.1016/j.bmcl.2009.12.063. [DOI] [PubMed] [Google Scholar]
- 2.Miller J.F., Turner E.M., Gudmundsson K.S., Jenkinson S., Spaltenstein A., Thomson M., Wheelan P. Bioorg. Med. Chem. Lett. 2010;20:2125–2128. doi: 10.1016/j.bmcl.2010.02.053. [DOI] [PubMed] [Google Scholar]
- 3.Tonelli M., Simone M., Tasso B., Novelli F., Boido V., Sparatore F., Paglietti G., Pricl S., Giliberti G., Blois S., Ibba C., Sanna G., Loddo R., Colla P.L. Bioorg. Med. Chem. 2010;18:2937–2953. doi: 10.1016/j.bmc.2010.02.037. [DOI] [PubMed] [Google Scholar]
- 4.Luo X., Zhang Z., Yang Y., Xue F., Xiu N., She Y. Front. Chem. Eng. China. 2009;3(3):305–309. [Google Scholar]
- 5.Pilyugin V.S., Kuznetsova S.L., Sapozhnikov Y.E., Chikisheva G.E., Kiseleva G.V., Vorob’eva T.P., Klimakova E.V., Sapozhnikova N.A., Davletov R.D., Galeeva Z.B. Russ. J. Gen. Chem. 2008;78(3):446–450. [Google Scholar]
- 6.Pilyugin V.S., Mikhailyuk A.N., Kosareva V.M., Chikisheva G.E., Kiseleva G.V., Kuznetsova S.L., Vorobyeva T.P., Klimakova E.V. Russ. J. Org. Chem. 2003;39(8):1154–1160. [Google Scholar]
- 7.Chomicz L., Padzik M., Laudy A.E., Kozlowska M., Pietruczuk A., Piekarczyk J., Godineau N., Oledzka G., Kazimierczuk Z. Acta Parasitol. 2009;54(2):165–171. [Google Scholar]
- 8.Bokanov A.I., Evstratova M.I., Turchin K.F., Granik V.G., Andreeva N.I., Asnina V.V., Golovina S.M., Mashkovskii M.D. Pharm. Chem. J. 1997;31(10):27–29. [Google Scholar]
- 9.Rida S.M., EL-Hawash S.A.M., Fahmy H.T.Y., Hazzaa A.A., El-Meligy M.M.M. Arch. Pharm. Res. 2006;29(10):826–833. doi: 10.1007/BF02973901. [DOI] [PubMed] [Google Scholar]
- 10.Ranganatha S.R., Kavitha C.V., Vinaya K., Prasanna D.S., Chandrappa S., Raghavan S.C., Rangappa K.S. Arch. Pharm. Res. 2009;32(10):1335–1343. doi: 10.1007/s12272-009-2000-9. [DOI] [PubMed] [Google Scholar]
- 11.Dianov V.M. Pharm. Chem. J. 2007;41(6):20–21. [Google Scholar]
- 12.Kou H.L., Lien J.C., Chung C.H., Chang C.H., Lo S.C., Tsai I.C., Peng H.C., Kuo S.C., Huang T.F. Naunyn-Schmied Arch. Pharmacol. 2010;381(6):495–505. doi: 10.1007/s00210-010-0505-x. [DOI] [PubMed] [Google Scholar]
- 13.Huang C., Embrechts M.J., Sukumar N., Breneman C.M. Artif. Neural Networks. ICANN. 2007;4668:628–637. [Google Scholar]
- 14.Mungalpara J., Pandey A., Jain V., Mohan C.G. J. Mol. Model. 2010;16:629–644. doi: 10.1007/s00894-009-0591-1. [DOI] [PubMed] [Google Scholar]
- 15.Sharma D., Narasimhan B., Kumar P., Judge V., Narang R., Clercq E.D., Balzarini J. Eur. J. Med. Chem. 2009;44:2347–2353. doi: 10.1016/j.ejmech.2008.08.010. [DOI] [PubMed] [Google Scholar]
- 16.Kumar D., Judge V., Narang R., Sangwan S., Clercq E.D., Balzarini J., Narasimhan B. Eur. J. Med. Chem. 2010;45:2806–2816. doi: 10.1016/j.ejmech.2010.03.002. [DOI] [PMC free article] [PubMed] [Google Scholar]
- 17.Furniss B.S., Hannaford A.J., Smith P.W.G., Tatchell A.R. Addison Wesley Longman Inc.; California: 1998. Vogel’s Textbook of Practical Organic Chemistry. pp. 34, 951. [Google Scholar]
- 18.Dahiya R., Pathak D. Eur. J. Med. Chem. 2007;42:772–798. doi: 10.1016/j.ejmech.2006.11.015. [DOI] [PubMed] [Google Scholar]
- 19.Cappucino J.G., Sherman N. Addison Wesley Longman Inc; California: 1999. Microbiology – A Laboratory Mannual. pp. 263. [Google Scholar]
- 20.Emami S., Falhati M., Banifafemi A., Shafiee A. Bioorg. Med. Chem. 2004;12:5881–5889. doi: 10.1016/j.bmc.2004.08.030. [DOI] [PubMed] [Google Scholar]
- 21.Hansch C., Fujita T., Am J. Chem. Soc. 1964;86:1616–1626. [Google Scholar]
- 22.Hansch C., Leo A., Unger S.H., Kim K.H., Nikaitani D., Lien E.J. J. Med. Chem. 1973;16(11):1207–1216. doi: 10.1021/jm00269a003. [DOI] [PubMed] [Google Scholar]
- 23.Kier L.B., Hall L.H. Academic Press; New York: 1976. Molecular Connectivity in Chemistry and Drug Research. [Google Scholar]
- 24.Randic M. J. Am. Chem. Soc. 1975;97:6609–6615. [Google Scholar]
- 25.Balaban A.T. Chem. Phys. Lett. 1982;89:399–404. [Google Scholar]
- 26.Wiener H. J. Am. Chem. Soc. 1947;69:17–20. doi: 10.1021/ja01193a005. [DOI] [PubMed] [Google Scholar]
- 27.Randic M. Croat. Chem. Acta. 1993;66:289–312. [Google Scholar]
- 28.Heravi J.M., Kyani A. J. Chem. Inf. Comput. Sci. 2005;44:1328–1335. doi: 10.1021/ci0342270. [DOI] [PubMed] [Google Scholar]
- 29.Golbraikh A., Tropsha A. J. Mol. Graph. Model. 2002;20(4):269–276. doi: 10.1016/s1093-3263(01)00123-1. [DOI] [PubMed] [Google Scholar]
- 30.Bajaj S., Sambi S.S., Madan A.K. Croat. Chem. Acta. 2005;78(2):165–174. [Google Scholar]
- 31.Kumar A., Sharma P., Gurram V.K., Rane N. Biorg. Med. Chem. Lett. 2006;16:2484–2491. doi: 10.1016/j.bmcl.2006.01.080. [DOI] [PubMed] [Google Scholar]
- 32.Sharma P., Kumar A., Sharma M. Eur. J. Med. Chem. 2006;41:833–840. doi: 10.1016/j.ejmech.2006.03.022. [DOI] [PubMed] [Google Scholar]
- 33.Hatya S.A., Aki-sener E., Tekiner-Gulbas B., Yildiz I., Temiz-Arpaci O., Yalcin I., Altanlar N. Eur. J. Med. Chem. 2006;41:1398–1404. doi: 10.1016/j.ejmech.2006.06.011. [DOI] [PubMed] [Google Scholar]
- 34.Kumar A., Narasimhan B., Kumar D. Bioorg. Med. Chem. 2007;15:4113–4124. doi: 10.1016/j.bmc.2007.03.074. [DOI] [PubMed] [Google Scholar]
- 35.Narasimhan B., Judge V., Narang R., Ohlan S., Ohlan R. Bioorg. Med. Chem. Lett. 2007;17:5836–5845. doi: 10.1016/j.bmcl.2007.08.037. [DOI] [PubMed] [Google Scholar]
- 36.Prado-Prado F.J., Gonzalez-Diaz H., de la Vega O.M., Ubeira F.M., Chou K.C. Bioorg. Med. Chem. 2008;16(11):5871–5880. doi: 10.1016/j.bmc.2008.04.068. [DOI] [PubMed] [Google Scholar]
- 37.Gonzalez-Diaz H., Prado-Prado F.J. J. Comput. Chem. 2008;29(4):656–667. doi: 10.1002/jcc.20826. [DOI] [PubMed] [Google Scholar]
- 38.Cruz-Monteagudo M., Gonzalez-Diaz H., Aguero-Chapin G., Santana L., Borges F., Dominguez E.R., Podda G., Uriarte E. J. Comput. Chem. 2007;28(11):1909–1923. doi: 10.1002/jcc.20730. [DOI] [PubMed] [Google Scholar]
- 39.Gonzalez-Diaz H., Vilar S., Santana L., Uriarte E. Curr. Top. Med. Chem. 2007;7(10):1015–1029. doi: 10.2174/156802607780906771. [DOI] [PubMed] [Google Scholar]
- 40.Gonzalez-Diaz H., Gonzalez-Diaz Y., Santana L., Ubeira F.M., Uriarte E. Proteomics. 2008;8(4):750–778. doi: 10.1002/pmic.200700638. [DOI] [PubMed] [Google Scholar]
- 41.Zhou B., Trinajstic N. Croat. Chem. Acta. 2008;81(2):319–323. [Google Scholar]
- 42.Kumar P., Narasimhan B., Sharma D. ARKIVOC. 2008;xiii:159–178. [Google Scholar]
- 43.Sharma D., Narasimhan B., Kumar P., Jalbout A. Eur. J. Med. Chem. 2009;44(3):1119–1127. doi: 10.1016/j.ejmech.2008.06.009. [DOI] [PubMed] [Google Scholar]
- 44.Sharma P., Rane N., Gurram V.K. Bioorg. Med. Chem. Lett. 2004;14:4185–4190. doi: 10.1016/j.bmcl.2004.06.014. [DOI] [PubMed] [Google Scholar]
- 45.Sortino M., Delgado P., Jaurez S., Quiroga J., Abonia R., Insuasey B., Nogueras M., Rodero L., Garibotto F.M., Enriz R.D., Zacchino S.A. Bioorg. Med. Chem. Lett. 2007;15:484–494. doi: 10.1016/j.bmc.2006.09.038. [DOI] [PubMed] [Google Scholar]
- 46.vol. II. Ministry of Health Department: Govt. of India; New Delhi: 1996. (Pharmacopoeia of India). pp. A-88. [Google Scholar]
- 47.Rodriguez-Arguelles M.C., Lopez- Silva E.C., Sanmartin J., Pelagatti P., Zani F. J. Inorg. Biochem. 2005;99:2231–2239. doi: 10.1016/j.jinorgbio.2005.07.018. [DOI] [PubMed] [Google Scholar]
- 48.Hyperchem 6.0 . Hypercube, Inc.; Florida: 1993. [Google Scholar]
- 49.TSAR 3D . Oxford Molecular Limited; 2000. Version 3.3. [Google Scholar]
- 50.SPSS Inc.; Bangalore, India: 1999. SPSS for Windows. Version 10.05. [Google Scholar]
- 51.Tetko I.V., Tanchuk V.Y., Villa A.E. J. Chem. Inf. Comput. Sci. 2001;41:1407–1421. doi: 10.1021/ci010368v. [DOI] [PubMed] [Google Scholar]