

Abstract
This article describes recent advances in several areas of research involving the interfacial ordering of liquid crystals (LCs). The first advance revolves around the ordering of LCs at bio/chemically functionalized surfaces. Whereas the majority of past studies of surface-induced ordering of LCs have involved surfaces of solids that present a limited diversity of chemical functional groups (surfaces at which van der Waals forces dominate surface-induced ordering), recent studies have moved to investigate the ordering of LCs on chemically complex surfaces. For example, surfaces decorated with biomolecules (e.g. oligopeptides and proteins) and transition metal ions have been investigated, leading to an understanding of the roles that metal-ligand coordination interactions, electrical double-layers, acid-base interactions, and hydrogen bonding can have on the interfacial ordering of LCs. The opportunity to create chemically-responsive LCs capable of undergoing ordering transitions in the presence of targeted molecular events (e.g., ligand exchange around a metal center) has emerged from these fundamental studies. A second advance has focused on investigations of the ordering of LCs at interfaces with immiscible isotropic fluids, particularly water. In contrast to prior studies of surface-induced ordering of LCs on solid surfaces, LC- aqueous interfaces are deformable and molecules at these interfaces exhibit high levels of mobility and thus can reorganize in response to changes in interfacial environment. A range of fundamental investigations involving these LC-aqueous interfaces have revealed that (i) the spatial and temporal characteristics of assemblies formed from biomolecular interactions can be reported by surface-driven ordering transitions in the LCs, (ii) the interfacial phase behaviour of molecules and colloids can be coupled to (and manipulated via) the ordering (and nematic elasticity) of LCs, and (iii) confinement of LCs leads to unanticipated size-dependent ordering (particularly in the context of LC emulsion droplets). The third and final advance addressed in this article involves interactions between colloids mediated by LCs. Recent experiments involving microparticles deposited at the LC-aqueous interface have revealed that LC-mediated interactions can drive interfacial assemblies of particles through reversible ordering transitions (e.g., from one-dimensional chains to two-dimensional arrays with local hexagonal symmetry). In addition, recent single nanoparticle measurements suggest that the ordering of LCs about nanoparticles differs substantially from micrometer-sized particles and that the interactions between nanoparticles mediated by the LCs are far weaker than predicted by theory (sufficiently weak that the interactions are reversible and thus enable self-assembly). Finally, LC-mediated interactions between colloidal particles have also been shown to lead to the formation of colloid-in-LC gels that possess mechanical properties relevant to the design of materials to interface with living biological systems. Overall, these three topics serve to illustrate the broad opportunities that exist to do fundamental interfacial science and discovery-oriented research involving LCs.
INTRODUCTION
Outline of Article
This Feature Article is organized into four parts: First, a brief historical overview of the discovery of LCs and key physical concepts involving LCs are presented. The latter section aims to provide knowledge necessary to understand the advances described in the remainder of this article. Detailed treatments of these concepts can be found elsewhere.1-3 The second section of this article describes recent studies of the ordering of LCs on chemically functionalized surfaces of solids. The third section addresses the ordering of LCs at interfaces with immiscible aqueous phases. The section describes the influence of adsorbates at these interfaces on LC ordering transitions, and also the influence of the nematic elasticity of LCs on the organization of the adsorbates. The fourth section describes colloidal interactions mediated by LCs, with a particular focus directed to colloidal self-assembly at LC-aqueous interfaces and characterization of the influence of LC ordering on transport properties and interparticle interactions on the nanoscale. We end this brief outline by noting that this paper focuses on recent advances that have emerged from research in our own laboratory and it does not seek to be a comprehensive review of the literature. Where relevant, however, we do describe complementary studies that have occurred in other laboratories.
Historical Perspective
Until the late 1800s, scientists described physical matter as existing in three states (solid, liquid, gases).2 In 1888, however, Austrian botanist Friedrich Reinitzer isolated a form of cholesterol (cholesterol benzoate) and observed the existence of two melting points. He sent samples of his materials to physicist Otto Lehman in Germany who was investigating crystallization of materials using polarized light microscopy. Lehman deduced that the opaque fluid observed by Reinitzer was a distinct phase of matter, and that it exhibited properties of both liquids and solids; he coined the phrase “liquid crystal.” Subsequently, a classification scheme was introduced in 1922 by Georges Freidel, who identified the phases of LCs as being nematic, smectic, or cholesteric (chiral nematic). Nematic phases were ultimately understood to possess long range orientational order but to lack long-range positional order (Figure 1A). The term “mesogen” was also adopted to describe a molecule that forms a LC (a “mesophase”). Many additional LC phases have now been identified (eg., the Smectic A phase in Figure 1A), and advances in the synthesis of organic molecules continue to yield new LC phases and enable many of the useful properties of LCs to be tailored (e.g. optical and electrical properties).2, 3
Figure 1.
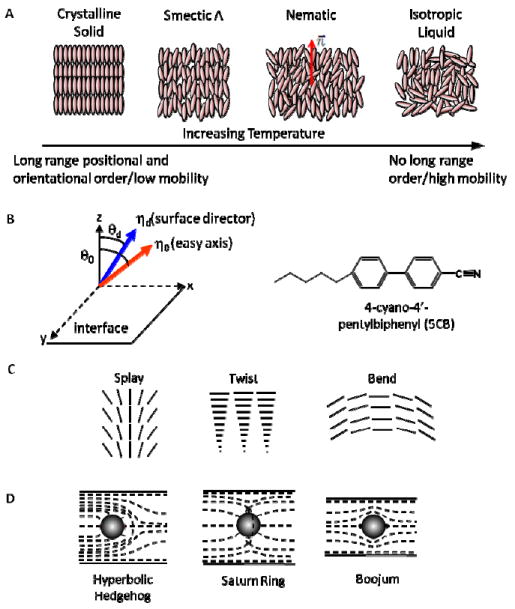
(A) Schematic illustration of temperature-dependent phases of materials that form LCs. (B) (left) Orientation of the director and easy axis of LC at a surface; (right) Chemical structure of 5CB. (C) Schematic illustration of three modes of strain of LCs: (i) splay, (ii) twist, and (iii) bend. (D) Schematic illustration of the director near particles inserted into LCs.
Essential Properties of Liquid Crystals
The most widely investigated LC phase is the nematic phase of the class of thermotropic LCs (thermotropic LCs exhibit changes in phases as a function of temperature—see Figure 1A). This article focuses on studies that have used nematic LCs, and in particular a nematic LC formed from 4-cyano-4’-pentylbiphenyl (5CB, Figure 1B). The orientational order of mesogens within a nematic can be described by a statistical preference of the mesogens to align in one direction (characterized by the director n⃗, see Figure 1A). Unlike isotropic liquids, this orientational preference is communicated over distances much greater than the size of the mesogens (~100μm is typical for a nematic LC). The long range orientational ordering of molecules within the nematic LC also leads to anisotropic optical properties (properties that enable characterization of the orientational order via the use of polarized light).1, 2
The central phenomenon addressed in this article is the surface-induced ordering of LCs, or the so-called “surface anchoring” of LCs, which results from interactions of LCs with a surface. The lowest free-energy orientation of the director of a LC relative to a surface is commonly called the “easy axis” of the LC (denoted as η0 in Figure 1B).3, 4 External fields acting on a LC in contact with a surface can cause the director to depart from the easy axis, thus leading to an orientation-dependent free energy of the interface. The orientation dependence of the interfacial free energy is often described as 2, 5
| (1) |
where σ is the interfacial free energy, σ0 is the part of the interfacial free energy that is independent of orientation, Wa is the anchoring energy, θd and θ0 are the orientations of the surface director and easy axis, respectively (Figure 1B). Typical values of Wa are 10-3-10-2 mJ/m2.2, 5
The long range ordering of molecules in an LC phase also gives rise to the elasticity of LCs. Nematic LCs can undergo three modes of orientational strain: splay, twist, and bend (Figure 1C). In a confined LC system (where the orientation of the LC is fixed at the confining boundary; i.e. infinite anchoring energy), the equilibrium profile of the director will be determined by a minimization of the elastic free energy associated with the strain of the LC. The Frank-Oseen equation describes the free energy density associated with strain of a nematic LC, namely2, 5-7
| (2) |
where K11 is the splay elastic constant, K22 is the twist elastic constant, and K33 is the bend elastic constant. The elastic constants are typically on the order of 10-11 N.2, 5, 6 We also note that more complete descriptions of LCs have been developed based on tensorial order parameters.1 As described in several examples below, the relative importance of surface and elastic contributions to the total free energy in a LC depends on the geometry of the LC system and underlies a variety of the interfacial phenomena described in this article.2, 5, 6
Finally, we note that in some confined LC systems, it is not possible to satisfy the surface anchoring conditions through continuous strain of the LC. In these systems (which are discussed in detail below), the boundary conditions are satisfied through the generation of defects in the LC.7-16 The defects correspond to localized regions of the LC where the orientational order of the LC is substantially reduced relative to the bulk LC. One well-studied case is that of particles inserted into nematic LCs.7, 8, 11-14 Depending on the anchoring of the LC on the particle surface, various types of topological defects can be formed in the LC (Figure 1D). For colloidal particles that cause homeotropic (perpendicular) anchoring of the LC, hyperbolic hedgehog or Saturn ring defects are formed.7, 15-18 For particles that cause planar (parallel) anchoring of the LC, boojum defects are formed (Figure 1D, right).7, 13, 15, 17, 18
In summary, the key concepts that underlie the descriptions of advances reported in the remainder of this paper are (i) surface anchoring of LCs, (ii) elastic strain of LCs, and (iii) formation of defects in LCs.
SECTION 1: ANCHORING OF LIQUID CRYSTALS ON CHEMICALLY FUNCTIONALIZED SURFACES OF SOLIDS
Recent studies have sought to understand and control the ordering of LCs at surfaces that differ substantially in chemical complexity from those studied in the past.3, 19-28 These recent studies have been motivated, in part, by the goal of exploiting highly cooperative ordering transitions in LCs to report biological and chemical events at surfaces. The chemical complexity of the surfaces has defined new challenges in terms of understanding the intermolecular interactions that lead to surface-induced ordering of LCs. Here we note that much of the motivation for past studies of the ordering of LCs at surfaces was connected to the design of electro-optical devices.3, 29 A particularly well-studied surface is a mechanically sheared film of polyimide, where a large number of studies have now established that the ordering of LCs is dominated by van der Waals dispersion forces. In contrast, at surfaces that are being investigated for the design of responsive LC materials, the range of interactions is far more complex and diverse, and includes electrical double layers, hydrogen bonding, and metal-ligand coordination interactions in addition to van der Waals forces.20, 21, 27, 30-32
Self-assembled monolayers (SAMs) formed from ω-functionalized alkanethiols have been widely used to explore the ordering of LCs.4, 19, 22-25, 33-36 These surfaces possess a number of attributes that make them useful for such studies, including that (i) a variety of chemical functional groups can be presented at these surfaces in a well defined manner, including biomolecular functional groups, and (ii) a number of methods exist to pattern surfaces with SAMs on micrometer and smaller scales.22, 24, 37
As a first example of recent studies of the ordering of LCs on surfaces that present chemical functionality relevant to the design of biomolecular interfaces, we note that oligo(ethylene glycol)-terminated SAMs, as shown in Figure 2A, have been widely explored because irreversible protein adsorption on these surfaces is low.37 In the majority of studies of the ordering of LCs on SAMs formed on films of gold, the gold films have been deposited onto glass substrates from a vapor at an oblique angle of incidence (Figure 2B).19, 24, 25, 36 The oblique deposition of the gold influences the structure of the polycrystalline films in several different ways: (i) Self-shadowing creates an anisotropic, nanometer-scale topography (on the size of the gold grains, which is 10-30nm for 20nm-thick films of gold), and (ii) the direction of deposition of the gold induces a preferred crystallographic orientation of the gold grains to create an in-plane crystallographic texturing of the film.26, 38 As described below, this texturing of the gold influences the organization of the SAMs adsorbed to the gold in ways that make the ordering of LCs strongly dependent on the chemical details of the SAMs. In summary, by controlling the angle of the deposition of the gold, both the nanometer scale topography as well as the organization of the SAMs on the gold can be manipulated. The ordering of the LCs on these surfaces is influenced by both factors.4, 19, 25, 26
Figure 2.
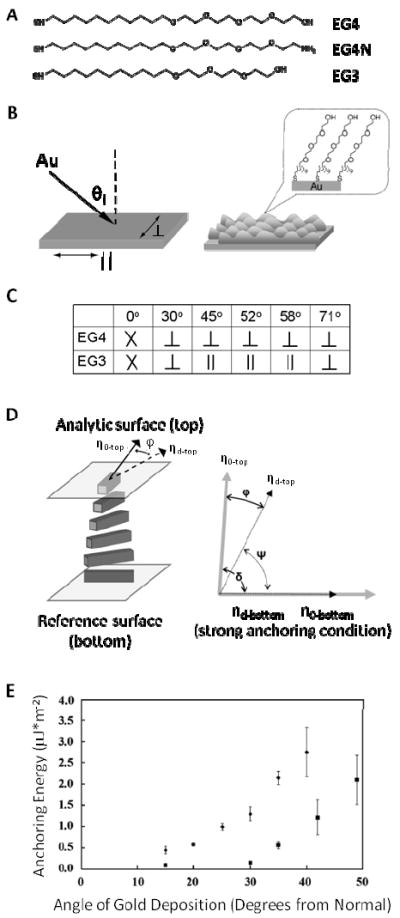
(A) Chemical structures of three different ethylene glycol-terminated thiols that form SAMs on gold. (B) Schematic illustrations of the oblique deposition of gold films and the formation of SAMs on the films. (C) Orientations of the easy axes of nematic 5CB anchored on SAMs formed from EG3 or EG4 thiols. The “X” indicates degenerate alignment of the LC. (D) Schematic of a twisted nematic liquid crystal (TNLC) cell to measure the azimuthal anchoring energy of the LC at a surface. (E) Dependence of the azimuthal anchoring energy of nematic 5CB on the angle of deposition, for gold films supporting SAMs formed from either EG4N (squares) or EG4 (diamonds). Error bars indicate 95% confidence intervals for at least 3 samples. Adapted with permission from Lowe, A. M.; Ozer, B. H.; Bai, Y.; Bertics, P. J.; Abbott, N. L., Applied Materials and Interfaces 2010, 2, 722-731. Copyright (2010) American Chemical Society, and Clare, B. H.; Guzman, O.; de Pablo, J. J.; Abbott, N. L., Langmuir 2006, 22, 4654-4659. Copyright (2006) American Chemical Society.
The influence of the nanoscale topography of the gold films and the organization of the SAMs on the ordering of nematic 5CB are both illustrated by the results shown in Figure 2C. For SAMs formed from the oligo(ethylene glycol)-terminated thiols EG3 and EG4, as shown in Figure 2A, it has been demonstrated that the easy axis of a nematic phase of 5CB is parallel to the surface decorated with the SAM (so-called planar anchoring).22, 23 Inspection of Figure 2C, however, reveals that when the SAM is formed from EG4 and the angle of deposition of the gold is 30° or greater, the azimuthal orientation of the LC is perpendicular to the direction of the deposition of the gold (see the symbol, ⊥, in Figure 2B). By using atomic force microscopy (AFM), it has been shown that this azimuthal orientation of the LC corresponds to one that minimizes the elastic strain of the LC over the topography of the gold surface.26 For surfaces with topography on the micrometer-scale, this effect of anisotropic roughness on the ordering of LCs has been described by Berreman-type models.26, 39 In contrast, when using SAMs formed from EG3 and gold films deposited at angles between 45° and 58°, the azimuthal orientation of nematic 5CB is parallel to the direction ion of deposition of the gold (see the symbol, ‖, Figure 2B).19 This orientation cannot be understood on the basis of minimization of the elastic strain of the LC over the topography, and instead, it reflects molecular-level interactions of the LC with the SAM. Specifically, past studies using infrared-visible sum frequency spectroscopy of SAMs deposited onto obliquely deposited gold films have demonstrated that the SAMs formed on these films exhibit macroscopic, inplane ordering of the terminal functional groups.38 The ordering arises from the crystallographic texturing of the gold films.38 For SAMs formed from EG3, it is likely that H-bonding between the terminal –OH-groups of the SAMs and the nitrile groups of the 5CB plays an important role in determining the orientation of the LC observed on the SAMs.40 We also note that so-called “odd-even” effects have also been seen with SAMs formed from alkanethiols, where SAMs formed from alkanethiols containing an odd number of carbons direct the LC to orient azimuthally in a direction perpendicular to the direction of deposition of the gold whereas alkanethiols containing an even number of carbons orient in the orthogonal in-plane direction. For SAMs formed from alkanethiols, van der Waals interactions between the methyl groups of the SAMs and LC influence the orientation of the LC. Additional details regarding these systems can be found in past publications.4, 41 Inspection of Figure 2C also reveals that when the crystallographic texturing is weak (such as when the gold film is deposited at an angle of 30°), the LC orients on the SAM formed from EG3 in a direction that is perpendicular to the direction of deposition of the gold film (indicating that the nanoscopic roughness of the gold film dominates the energetics of interaction of the LC with these surfaces). Furthermore, when the angle of deposition is greater than 58°, the orientation of the LC on the SAM formed from EG3 is again dictated by the topography of the surface.
Whereas all the observations reported above involve systems where the orientation of the LC lies in the plane of the surface, we note here that some SAMs cause nematic phases of LCs to orient perpendicular to the surface (so-called homeotropic anchoring). One such example is a mixed SAM formed from decanethiol and hexadecanethiol.4 The likely mechanism of interaction leading to the homeotropic alignment involves van der Waals interactions and interdigitation of the LC into the mixed monolayer. This mechanism of interaction is supported by the results of past studies using non-linear optical measurements. The interdigitation of the LC into the SAM is accompanied by the elimination of gauche defects from the aliphatic chains forming the SAM.42
As noted in the Introduction, a more complete characterization of the anchoring of a LC at a surface involves specification of the anchoring energy of the LC as well as the orientation of the easy axis. A variety of methods exist to measure the anchoring energies of LC on surfaces.43 One approach exploits the elastic nature of LCs, as illustrated in Figure 2D, and provides measurement of the azimuthal anchoring energy.19, 23-25 In brief, a strain (twist distortion) is engineered into the LC such that the LC exerts a torque on the confining surface at which the anchoring energy is to be determined. This torque is opposed by a surface torque that is generated as the director of the LC is displaced from the orientation of the easy axis. In a typical experiment, the twist distortion is created by aligning two surfaces with orthogonal easy axes, as shown in Figure 2D. To measure the anchoring energy at the top surface, the bottom surface is designed with a sufficiently high anchoring energy (> 10μJ/m2) such that the orientation of the LC does not deviate from the easy axis at the bottom surface. The angular deviation (φ in Figure 2D) of the LC from the easy axis of the top surface can be measured using a polarized light microscope. The azimuthal anchoring energy Waz can be calculated as:
| (3) |
where ψ is the total twist angle of the liquid crystal, d is the thickness of the film of LC, and φ is the magnitude of the angular displacement of the director from the easy axis. This so-called “torque-balance” method has been used to measure the anchoring energies of LCs on a variety of SAMs formed on obliquely deposited gold films.19, 23-25, 36 As shown in Figure 2E for the case of SAMs formed from EG4 and the corresponding amine-terminated alkanethiol (EG4N, Figure 2A), the magnitudes of anchoring energies on these SAMs typically range from 1-10μJ/m2. It is significant to note that these anchoring energies are approximately 100 times smaller than the anchoring energies typically reported for a polyimide-based surfaces used in an electro-optical device (300μJ/m2).44 Inspection of Figure 2E also reveals that the anchoring energies of LCs on surfaces are strong functions of the angle of deposition of the gold as well as the chemical structure of the thiol used to form the SAM (i.e. EG4N versus EG4).
Measurements of anchoring energies of LCs based on the methods described in Figure 2D have been extended to complex biological interfaces.45, 46 The presence or absence of biological molecules immobilized on surfaces has been shown to lead to large changes in the anchoring energies of LCs.19, 24, 36 Figure 3A shows how the presence of proteins printed onto surfaces using affinity microcontact printing117-122 influence the ordering of LCs.25, 47 In this example, polydimethylsiloxane (PDMS) stamps were covalently functionalized with an antibody to epidermal growth factor receptor (EGFR). The anti-EGFR-functionalized PDMS stamps were used to capture EGFR and transfer it to EG4N-functionalized gold films by mechanical contact (contact printing).25 Figure 3A shows polarized light micrographs of thin films of nematic 5CB in contact with either (i) a SAM formed from EG4N, or (ii) a SAM formed from EG4N onto which EGFR was transferred by affinity contact printing.25 Figure 3B shows the distribution of twist angles within the LCs, as quantified by measuring the twist angles of the LC at each pixel of an optical image.25 Inspection of Figure 3B reveals that prior to printing of the EGFR on the surface, the twist angle of the LC exhibited a sharp distribution centered at 49.3°. In contrast, after printing of the EGFR, the twist angle of the LC exhibited a broad distribution around an average value of 21.9°. This broad distribution gives rise to the heterogeneous appearance of the optical image of the LC shown in Figure 3A (right). The decrease in the twist angle of the LC caused by the EGFR indicates that the anchoring energy of the LC is substantially lowered by the presence of the EGFR on these surfaces. Additional details regarding the anchoring energies can be found in a recent publication.25 Although the current understanding of the intermolecular interactions between thermotropic LCs with proteins and peptides is limited, the results in Figure 3A and 3B suggest that EGFR printed onto the surface masks the interaction of the LC with the SAM formed from EG4N causing the decrease in anchoring energy of the LC.25
Figure 3.
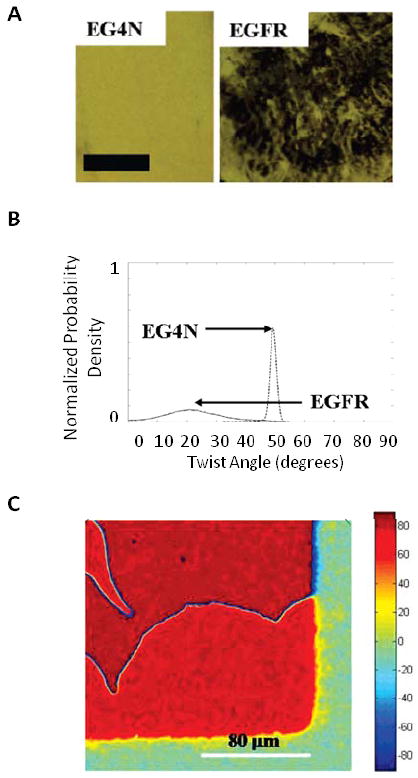
(A) Optical micrographs of nematic 5CB on gold films that were deposited at an oblique angle of deposition (35° from normal) and subsequently functionalized with (left) a SAM formed from EG4N, or (right) a SAM formed from EG4N onto which EGFR was deposited by affinity contact printing. Scale bar = 1mm. (B) Normalized distribution of twist angles corresponding to the optical images in (A). (C) High resolution map of the twist angle of a twisted nematic liquid crystal (TNLC) in contact with a surface patterned with SAMs formed from pentadecanethiol (C15) (red) or hexadecanethiol (C16) (green). Colors correspond to twist angles of the LC shown on color chart at right side of the figure. Adapted with permission from Lowe, A. M.; Ozer, B. H.; Bai, Y.; Bertics, P. J.; Abbott, N. L., Applied Materials and Interfaces 2010, 2, 722-731. Copyright (2010) American Chemical Society, and Lowe, A. M.; Bertics, P. J.; Abbott, N. L., Analytical Chemistry 2008, 80, 2637-2645. Copyright (2008) American Chemical Society
We end this section by noting that measurement of the twist angle of a LC at each pixel of a polarized light micrograph of a surface provides the basis of a method that can quickly map chemical patterns on surfaces with micrometer resolution.24 As an example, Figure 3C shows a spatial map of the twist angle of a nematic LC in contact with a surface prepared by microcontact printing hexadecanethiol (C16) onto an obliquely deposited gold film (green region) and subsequently immersing the sample into an ethanolic solution containing pentadecanethiol (C15) (red region). Disinclination lines and defects caused by changes in the handedness of the twist of the LC can also be seen in the image.24
Whereas the examples described in Figures 2 and 3 address biomolecular interfaces and ordering transitions in LCs that result from biomolecules on surfaces, a second series of studies reported over the past few years have investigated the design of surfaces that are decorated with transition metal ions.20, 21, 27 On these surfaces, coordination of the nitrile groups of LCs (e.g. nematic 5CB) to metal ions presented at the surfaces have been shown to dominate the orientational behavior of LCs on these surfaces (Figure 4A). Specifically, when transition metal ions such as Cu2+ are immobilized on surfaces, coordination of the nitrile groups of 5CB to the Cu2+ ions leads to a homeotropic orientation of the LC.21 The significance of this observation is that the homeotropic ordering of the LC is coupled to the prescence of the metal ion-ligand coordination complex (and changes in that complex – see below) formed on the surface.
Figure 4.
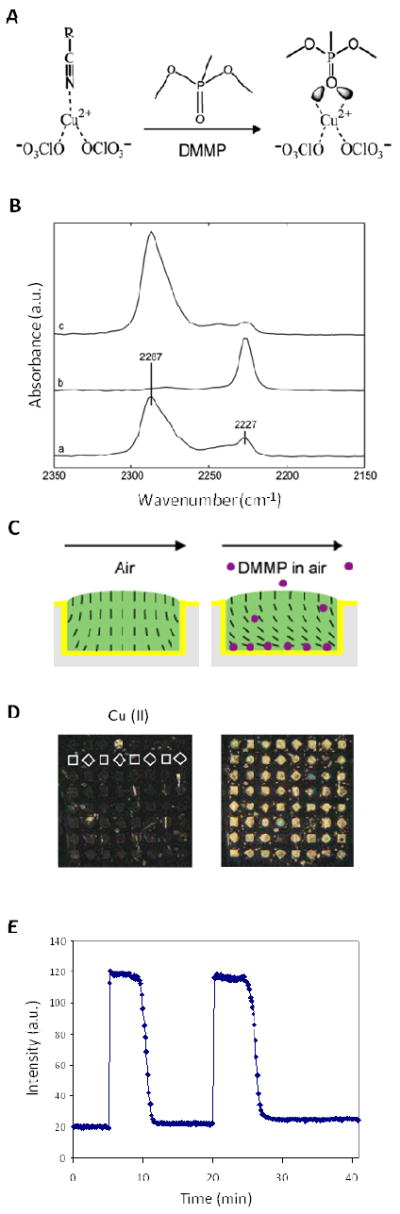
(A) Schematic illustration of the competitive molecular interactions between copper(II) perchlorate, the nitrile group of 5CB, and the phosphoryl group of DMMP. (B) PM-IRRAS spectra of a thin film of 8CB on a carboxylic acid-terminate SAM supporting copper (II) perchlorate salts (a) before and (b) during exposure to 10 ppm DMMP and (c) after a 30-min air purge. (C) Cartoon of the microwells used to house the LC. (D) Optical images (crossed polars) of 5CB supported on Cu2+ perchlorate salts hosted within an array of wells (depth of ~2.8 μm, width of 500 μm) (left) before and (right) during exposure to 10 ppm DMMP in nitrogen for 5 min. White outlines indicate the location of a single row of LC-filled wells in the left image. (E) Plot of the optical response of the LC upon exposure to DMMP, showing the reversible nature of the ordering transition. Adapted with permission from Cadwell, K. D.; Alf, M. E.; Abbott, N. L., J Phys Chem B 2006, 110, 26081-26088. Copyright (2006) American Chemical Society
The principal evidence for the formation of an interfacial coordination complex by nitrile-containing LCs and metal ions at surfaces comes from infrared (IR) spectroscopy. Polarization Modulation Infrared Reflection-Absorption Spectroscopy (PM-IRRAS) measurements show evidence of copper-coordinated and free nitrile peaks (Figure 4B (a)). The absorption peak at 2287 cm-1 in the IR spectrum corresponds to a stretching of the Cu-coordinated nitrile group and the peak at 2227 cm-1 corresponds to the free (uncoordinated) nitrile group. Further evidence of the coordination interaction was obtained by exposing the LC film supported on the Cu2+-decorated surface to dimethylmethylphosphonate (DMMP). In this experiment, the LC was supported in microwells with surfaces coated with Cu2+ (Figure 4C). As shown in Figure 4D, upon exposure to DMMP, the optical appearance of the LC changes from dark to bright, indicating an orientational transition from a homeotropic orientation to a tilted orientation (Figure 4C). This suggests that the DMMP has diffused through the LC and preferentially coordinated with the Cu2+ at the surface. In doing so, the DMMP displaces the LC from its coordination complex with the Cu2+ on the surface (Figure 4A). In support of this interpretation, spectroscopic evidence obtained using in situ PM-IRRAS shows that upon exposure to DMMP, the absorption peak corresponding to the nitrile group coordinated to Cu2+ (at 2287 cm-1) disappears, and the intensity of the free nitrile peak at 2227 cm-1 increases (Figure 4B (b)). Upon purging the system with air, the coordinated nitrile peak is recovered (Figure 4B(c)). The reversibility of the LC response, as shown in Figure 4E, indicates that the response is indeed governed by reversible coordination interactions, and that the coordination of DMMP with Cu2+ is stronger than nitrile with Cu2+.20
Whereas the experiments described in Figure 4D used Cu2+, the ordering of LCs at surfaces presenting a wide range of different transition metal ions has been explored.20, 21, 27 For example, Ni2+ will coordinate to nitrile-containing LCs with a strength of coordination that is sufficiently high that it is not disrupted by DMMP (correspondingly, when using Ni2+, no LC ordering transitions are measured upon exposure to DMMP).20 More broadly, the coordination of the metal ion to nitrile-containing LCs is specific to the metal ion. In general, high electron affinity metal ions form stable complexes with 5CB and cause homeotropic anchoring of the LC.27 We also note that a recent study has established that some fraction of the metal salt deposited onto the surface does dissolve into the LC. The reader is referred to that study for details.48
The above-described influence of competitive coordination interactions on ordering transitions in LCs has provided the basis for a novel approach to the design of chemical and biological sensors.20, 21, 27, 30 For example, detection of parts-per-billion concentrations of organophosphorous compounds has been demonstrated.30 In addition, by changing the identity of the metal ions presented on the surface, the detection and differentiation of four organophosphorous-based chemical warfare agents has been shown.21 A notable attribute of this sensing principle is that it is passive – that is, the reporting of the presence of a targeted analyte does not require a source of electrical power. Such principles may find use for the monitoring of chemical environments.
The observation that competitive intermolecular interactions at LC interfaces can trigger ordering transitions is a general one. As a second example, we note that LC ordering transitions can be triggered by the binding of amine-containing molecules to surfaces that present carboxylic acid groups.30 In this example, the initial orientation of the LC (5CB) is dictated by hydrogen bonding of the nitrile group of the LC to the carboxylic acid groups. Because the strength of the H bond is ~10-40 kJ/mol whereas organoamines will interact with the acid through an energetically more favorable acid-base interaction (> 70kJ/mol), exposure of the system to hexylamine led to disruption of the hydrogen bonding of the LC to the acid. As described in the Supporting Information (Figure S1), the orientation of the LC dictated by the initial H-bonded state of the LC was disrupted upon exposure to the amine.30
SECTION 2: AQUEOUS INTERFACES OF THERMOTROPIC LIQUID CRYSTALS
Whereas the experimental systems described above are based on chemically functionalized surfaces of solids, a second series of advances reported over the past 7 years has involved interfaces created between thermotropic LCs and immiscible aqueous solutions.49-51 The ordering of LCs at these aqueous interfaces is fundamentally different from the ordering at solid interfaces because the mobility of molecules is high at the aqueous interface and the interface is deformable. Because one side of the interface is an aqueous phase, the LC-aqueous interface enables investigations of the influence of biomolecular interactions on the ordering of LCs. A variety of approaches have been used to create LCaqueous interfaces for the investigations of interfacial phenomena, including planar interfaces created by stabilizing films of LCs in microfabricated structures (such as TEM grids, microwells, and micropillar systems).49, 52-55 In addition, recent studies have shown that LC-aqueous interfaces formed by emulsification of LCs within an aqueous phase is also a promising approach for fundamental studies of the influence of confinement on the ordering of LCs.56-58
Figure 5A shows a schematic illustration of an experimental set-up that can be used to prepare stable LC-aqueous interfaces. The approach uses a metallic grid supported on a chemically functionalized solid surface to form a stable film of LC with a thickness that is approximately that of the metallic grid. The underlying solid surface is treated to define the orientation of the LC at the bottom surface.49 For example, surfaces treated with octadecyltrichlorosilane (OTS) will give rise to homeotropic anchoring,59 whereas SAMs formed from hexadecanethiol (C16) and many other alkanethiols on gold films will give rise to a planar orientation of the easy axis of the LC (see above). The pores of the grid provide a mechanically stable support for the LC and prevent dewetting of the thin film of LC. After using capillary forces to fill the pores of the grid with LC, the supported film of LC is immersed into an aqueous solution to create an approximately flat LC-aqueous interface. In the illustration shown in Figure 5A, the director of the LC is shown inside one square of the grid. At the bottom of the LC film, the director of the LC is perpendicular to the surface (homeotropic alignment on OTS), and at the top surface, the LC is shown with an orientation parallel to the interface. Here we note that common LCs such as 5CB and E7 exhibit an easy axis that is parallel to the aqueous-LC interface (E7 is a nematic LC consisting of a mixture of four alkylcyanobiphenyls with different aliphatic chain lengths).5, 49 As shown in Figure 5A, the hybrid anchoring conditions induce a bend and splay strain in the LC within the film. In this strained state of the LC, elastic energy is stored in the film, a point that we return to below when discussing the lateral distribution of adsorbates at aqueous-LC interfaces.
Figure 5.
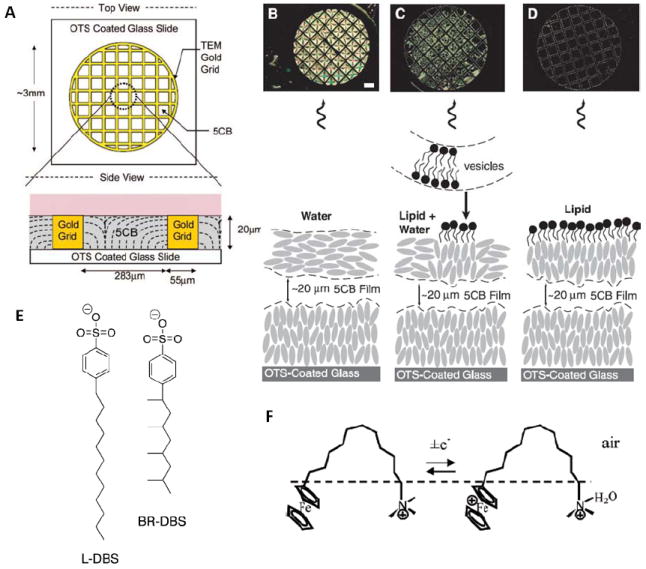
(A) Schematic illustration of the experimental system used to create stable LC-aqueous interfaces. (B) Optical image and cartoon representation of the anchoring of 5CB and the state of the aqueous- 5CB interface immediately after injection of a dispersion of vesicles formed from 0.1mM LDLPC in tris-buffered saline (TBS) (aqueous 10mM Tris, 100mM NaCl; pH 8.9). The optical image above the cartoon shows the transmission of polarized light (cross polars) through the 5CB. Scale bar, 200μm. (C) Optical image and cartoon representation of the anchoring of 5CB after ~10 to 20min of contact with the dispersion of L-DLPC vesicles. (D) Optical image and cartoon representation of the anchoring of 5CB after 2 hours of contact with the vesicle dispersion of L-DLPC vesicles. (E) Chemical structures of linear dodecyl-benzenesulfonate (L-DBS) and branched dodecylbenzene-sulfunate (BRDBS). (F) Structures of FTMA and oxidized FTMA and the proposed configuration at the air-water interface. Adapted with permission from Gupta, J. K.; Tjipto, E.; Zelikin, A. N.; Caruso, F.; Abbott, N. L., Langmuir 2008, 24, 5534-5542. Copyright (2008) American Chemical Society, and Brake, J. M.; Daschner, M. K.; Luk, Y. Y.; Abbott, N. L., Science 2003, 302, 2094-2097. Copyright (2003) AAAS.
A series of studies using surfactants and lipids have shown that ordering transitions in LCs can be triggered by the self-assembly of amphiphiles at aqueous-LC interfaces.49, 53, 55, 60, 61 These studies build from prior reports that monolayers of surfactants and lipids, when deposited at the surfaces of solids (e.g. Langmuir-Blodgett films) will orient LCs.62
Figure 5B-D shows optical micrographs (cross-polars) of ordering transitions induced in films of nematic 5CB by the adsorption of the lipid L-α-dilauroyl phosphatidylcholine (L-DLPC) at the LC-aqueous interface.49 In the absence of adsorbed lipids, the LC exhibits a bright optical appearance, consistent with planar anchoring of the LC at the aqueous interface (see discussion above). The first indication of the influence of adsorbed lipid on the ordering of the LC is the appearance of dark domains in the LC. These dark regions correspond to areas of the LC-aqueous interface at which the LC has adopted a perpendicular orientation.49 A number of observations (including observations based on the use of fluorescence microscopy to image DLPC doped with the fluorescently labeled lipid Texas Red dihexadecanoyl phosphatidylethanolamine (TR-DHPE) ) indicate that the domains of homeotropically anchored LC correspond to lipid-rich areas (i.e., lipid domains) at the interface.63 The origins of these domains are discussed further in the context of Figure 8. After equilibration of the LC-aqueous interface against the dispersion of L-DLPC for 2 hrs, a monolayer of L-DLPC is observed to form across the interface resulting in uniform homeotropic anchoring of the LC. Quantitative fluorescence imaging based on a comparison of the fluorescence intensity of the L-DLPC laden LC-aqueous interface to the fluorescence intensity of lipid bilayers on SiO2 surfaces is consistent with the presence of a monolayer of lipid at the interface. The measured fluorescence intensity of the L-DLPC/TR-DHPE at the LC-aqueous interface was 48% ± 7% of the fluorescence intensity of the bilayer on SiO2 surfaces. Overall, the results shown in Figure 5 demonstrate that spontaneous formation of a phospholipid assembly at the aqueous interface of a nematic LC leads to an ordering transition in the LC.
Figure 8.
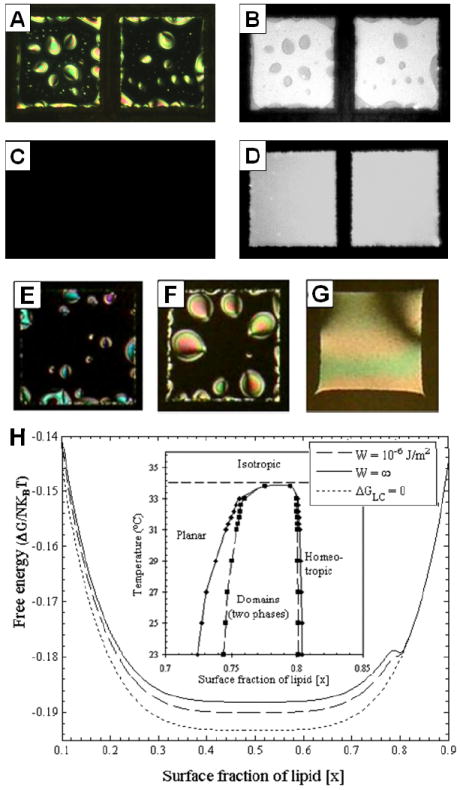
(A, C) Optical images (crossed polarizers) and (B, D) corresponding fluorescent images of LDLPC laden aqueous-5CB interfaces prepared by adsorption of lipid for 10 min from a 10μM unilamellar vesicle solution of L-DLPC doped with 0.1% Texas-Red-DPPE. (A, B) Nematic 5CB with a L-DLPC-laden interface. (C, D) Images of the samples in (A, B) heated to 34°C and equilibrated at that temperature for 2 hr. (E-G) Optical images of lipid-decorated film of nematic 5CB with thicknesses (E) 5μm, (F) 20μm, and (G) 40μm. (H) Plot of dimensionless free energy versus mole fraction of lipid at the aqueous-5CB interface in the presence (E=0.005; W = ∞ or W = 10-6 J/m2)/ absence (E = 0; ΔGLC = 0) of elastic energy for χ = 2. E is the dimensionless elastic energy calculated as Kπ2A*/ 8DkBT, where K is the temperature-dependent elastic constant of the LC, A* is the area per lipid molecule at saturation coverage, D is the thickness of the film of LC, kB is the Boltzmann constant, and T is temperature. (See text for details). Inset: Phase diagram of lipid at aqueous-LC interface for the case of strong (W = ∞) and weak (W = 10-6 J/m2). Adapted with permission from Gupta, J. K.; Meli, M. V.; Teren, S.; Abbott, N. L., Physical Review Letters 2008, 100, 048301. Copyright (2008) by the American Physical Society.
The influence of the molecular-level structure of amphiphiles adsorbed at the LC-aqueous interface on the ordering of LCs has also been investigated to provide insights into the mechanisms of interaction that give rise to the homeotropic ordering shown in Figure 5B-D. These studies provide support for the hypothesis that the interaction of the LC with the amphiphiles is mediated primarily via the tail of the lipid.52, 61, 64 For example, one study used two forms of dodecylbenzenesulfonate(DBS) (linear L-DBS and branched BR-DBS, shown in Figure 5E) to investigate the effects of surfactant tail structure on the ordering of the LC.52 Whereas L-DBS caused 5CB to order in a manner similar to many other linear surfactants (a continuous ordering transition to a homeotropic orientation was observed with increasing concentration of surfactant), BR-DBS did not cause homeotropic ordering of 5CB regardless of concentration. These results support the hypothesis that the branched tails of BR-DBS interferes with the tail-LC interaction responsible for the homeotropic ordering of the LC (see below).
A second related set of experiments investigated the ordering of LCs in the presence of surfactants that adopt looped conformations at the air-water interface (11-(ferrocenylundecyl)trimethylammonium bromide(FTMA), dodecyl-1,12-bis(trimethylammonium bromide)(DBTAB), and (11-hydroxyundecyl)trimethylammonium bromide(HTAB)) (Figure 5F).64 Interestingly, all of these surfactants caused the LC to remain in an orientation with the easy axis parallel to the aqueous-LC interface. This result indicates that the conformation of the tail of the surfactant is important in dictating the homeotropic LC orientation, a result that is consistent with a hypothesized interdigitation of the LC into the aliphatic tails of a surfactant-laden interface causing homeotropic anchoring.64 In addition, experiments performed by Fletcher et. al. using UV-polymerizable surfactants showed that polymerization of the hydrophobic tail of a surfactant at the LC-aqueous interface changes the ordering of the LC from homeotropic to planar, whereas polymerization of the hydrophilic head region does not produce a similar LC ordering transition.61 These results combined indicate that the surfactant head group does not have a large effect on the orientation of 5CB, whereas the aliphatic tail structure, length, and conformation greatly affect the ordering of the LC.
Interest in these mobile and dynamic surfactant- and lipid-laden LC-aqueous interfaces has been driven in part by the potential utility of these interfaces for reporting biomolecular interactions. We note that past studies of biological membranes have established that many biomolecular interactions at membranes are accompanied by reorganization of the components of the membrane (lipids, proteins, sugars)49. Because measurements of diffusion coefficients of lipids at the LC- aqueous interface have established levels of mobility and organization that are comparable to lipids within bilayers, a series of recent studies have sought to test the hypothesis that biomolecular interactions at LC-aqueous interfaces can lead to the reorganization of lipids at LC interfaces and thereby trigger ordering transitions in the LC. Support for the hypothesis has been found in the results of several studies.49, 55, 60, 65
The first studies to provide support for the above-described hypothesis focused on the interactions of phospholipases with phospholipid-laden interfaces of LCs. Those studies reported LC ordering transitions induced by either specific binding of the phospholipases to the lipids or hydrolysis of the lipids by the phospholipases (enzymatic activity of the phospholipases). For example, the specific binding of phospholipase A2 (PLA2) to D-α-dipalmitoyl phosphatidylcholine (D-DPPC) monolayers assembled at the LC-aqueous interface was investigated.65 This system is a useful model because specific binding of PLA2 to D-DPPC only occurs in the presence of Ca2+. This interaction has also been widely characterized using Langmuir films of D-DPPC, and a series of x-ray diffraction studies have established that the binding event in Langmuir films is accompanied by reorganization of the lipids.66 Here we note that the stereochemistry of the D-DPPC prevents hydrolysis of the lipid following binding of PLA2. Studies at the LC-aqueous interface revealed that addition of PLA2 to an aqueous solution containing Ca2+ in contact with the D-DPPC-laden interface of nematic 5CB does trigger an ordering transition in the LC (Figure 6A and B). Binding is accompanied by a uniform tilting of the LC away from the surface normal, which gives rise to the bright appearance of the image in Figure 6B. In contrast, addition of PLA2 (100nM) in the absence of Ca2+ did not lead to a change in the ordering of the LC (Figure 6C). This result demonstrates that specific biomolecular interactions such as the PLA2-DPPC binding event (which is relatively weak with a KD ~ 10-4M) can trigger ordering transitions in the LC (Figure 6D).65
Figure 6.
Optical images (crossed polarizer) of 5CB (A-C) showing PLA2 interaction with monolayers of D-DPPC. (A) Optical image of 5CB after 16 hr of exposure to 1nM PLA2 in TBS-Ca2+. (B) Optical image of 5CB after 16 hr exposure to 100nM PLA2 in TBS-Ca2+. (C) Optical image of 5CB after 16 hr exposure to 100nM PLA2 in TBS-EDTA. (D) Schematic illustration of PLA2 bound to D-DPPC thus perturbing the anchoring of the LC. (E-H) Mixed L-DLPC (98%) and Bi-X-DPPE (2%) monolayers were formed at the aqueous-5CB interface. The mixed monolayer was placed into contact with phosphate buffered saline (PBS) at pH 7.4 containing [(E) to (G)] 500 nM fluorescein-labeled NeutrAvidin or (H) 500nM NeutrAvidin that has been blocked with biotin. The optical texture of 5CB was imaged by [(E) and (F)] polarized white light with the sample located between cross polars and (F) white light without polarizers. The bright domains in (E) correspond to tilted or planar orientations of the LC at the interface between the LC and aqueous phase, and the black regions correspond to a homeotropic orientation. (G) Fluorescein-labeled NeutrAvidin associated with the lipid-laden aqueous- 5CB interface imaged by epifluorescence microscopy. (H) 500nM NeutrAvidin blocked with soluble biotin in solution. Scale bars 150μm. Adapted from Brake, J. M.; Daschner, M. K.; Luk, Y. Y.; Abbott, N. L., Science 2003, 302, 2094-2097. Copyright (2003) AAAS, and Brake, J. M.; Abbott, N. L., Langmuir 2007, 23, 8497-8507. Copyright (2007) American Chemical Society.
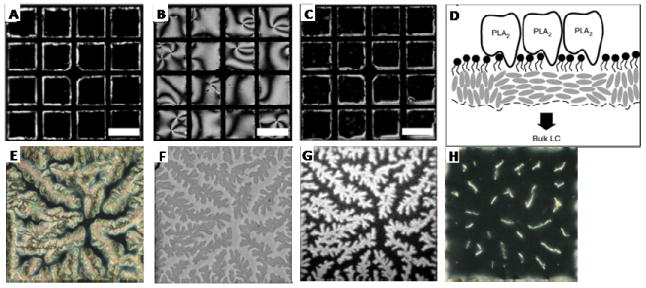
The binding of neutravidin to a mixed monolayer of N-((6-(biotinoyl)amino)hexanoyl)-1,2- dipalmitoyl-sn-glycero-3-phosphoethanolamine (Bi-X-DPPE) and L-DPLC assembled at an aqueous-LC interface has also been investigated. In contrast to PLA2, this binding event is very strong (KD ~ 10-14).49 Interestingly, binding of neutravidin to the biotinylated lipid also resulted in an ordering transition in the LC, but rather than being spatially uniform in nature (as shown in Figure 6B for binding of PLA2 to D-DPPC), dendritic brush-like patterned orientations of the LC formed in the presence of neutravidin (Figure 6E-H). Fluorescence images obtained using fluorescently labeled neutravidin established that the dendritic patterns of the LC were caused by the spatial distribution of neutravidin at the interface (Figure 6G). These results are significant because they demonstrate that not only can protein binding events at the LC-aqueous interface be reported by LC ordering transitions but also that patterned ordering of the LC can be used to indicate the formation of laterally organized protein assemblies.49 We note that a large number of past studies have reported the formation of 2D protein crystals at lipid-laden interfaces, and dendritic structures are commonly reported in those studies.67
In addition to reporting specific binding events involving proteins at interfaces, a number of studies have shown that it is possible to design LC-aqueous interfaces at which the enzymatic activity of proteins is reported.49, 65, 68 A system that is closely related to the one reported above involves L-DLPC monolayers at aqueous-LC interfaces and the enzymatic hydrolysis of the L-DLPC by PLA2 (Figure 7). As shown in Figure 7C-E, the products of hydrolysis of L-DLPC desorb from the aqueous-LC interface, leading to an ordering transition that ends with planar anchoring of the LC at the interface. We note here the presence of patterned domains of LC in Figure 7D, a point that we return to below. We also comment that PLA2 will catalyze the hydrolysis of monolayers of L-DPPC at the LC-aqueous interface. However, the response of the LC to hydrolysis of L-DPPC differs from the case of L-DLPC. The fatty acid and lysophospholipid products of DPPC degradation desorb very slowly, and instead laterally segregate on the interface. For L-DPPC, this leads to the appearance of permanent domains caused by the segregation of the hydrolysis products.49, 65
Figure 7.
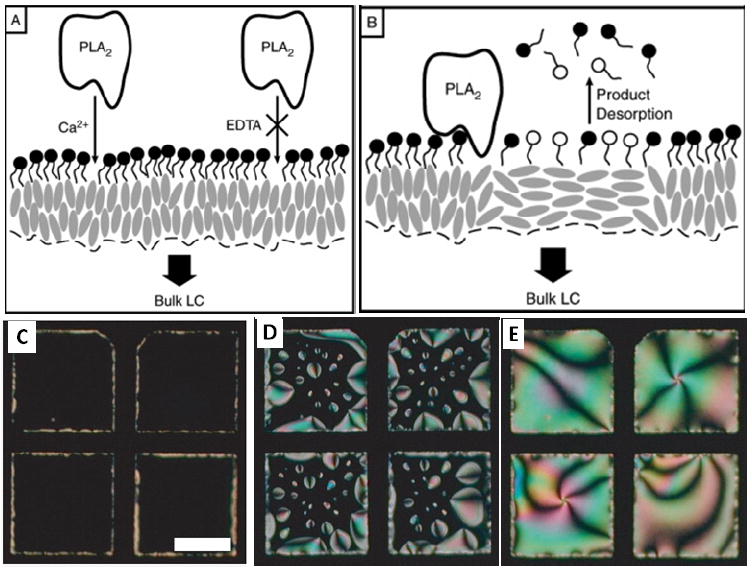
(A-B) Schematic illustration of the proposed mechanism by which PLA2 catalyzes the hydrolysis of L-DLPC at the LC-aqueous interface leading to an ordering transition in the LC. (A) PLA2 binds to the phospholipids at the LC-aqueous interface only in the presence of Ca2+. (B) Bound PLA2 hydrolyzes L-phospholipids, forming single-tailed lysophospholipids and fatty acids that desorb from the interface. (C-E) Polarized light micrographs showing the interface of nematic 5CB decorated with LDLPC (doped with 1% TR-DHPE) following contact with an aqueous solutions containing 1nM PLA2, (C) 0, (D) 45, and (E) 90 min. Scale bar, 150μm. Adapted from Brake, J. M.; Daschner, M. K.; Luk, Y. Y.; Abbott, N. L., Science 2003, 302, 2094-2097. Copyright (2003) AAAS, and Brake, J. M.; Abbott, N. L., Langmuir 2007, 23, 8497-8507. Copyright (2007) American Chemical Society.
The discussion of the LC-aqueous interface presented above has focused on ordering transitions induced in the LC by the arrival, processing and reorganization of adsorbates at the aqueous-LC interface. Recent studies, however, have demonstrated that the LC is not a passive reporter of the organization of adsorbates at LC-aqueous interfaces, but that the ordering of the LC can influence the organization of adsorbates at the interface.63, 69 In particular, experiments have identified the nematic elasticity of LC phases to influence the phase behavior and lateral organization of lipids and surfactants at aqueous-LC interfaces.63, 69
Figure 8 shows a series of experimental observations that illustrate the influence of the nematic ordering of LCs on the lateral organization of lipids at the LC-aqueous interface.63 Specifically, the experiments show that the bulk phase transition of the LC is coupled to an interfacial phase transition of the lipid. As mentioned above in the context of Figure 5, interfaces of LCs decorated with subsaturation coverages of lipid exhibit patterned LC orientations. Figure 8A and 8B show that the regions of the LC interface with the homeotropic orientation coincide with lipid-rich areas of the interface. Upon heating the system to approximately 34°C, however, both the nematic ordering of the LC and the interfacial domains of amphiphiles disappear (Figure 8 C and 8D). This phenomenon is reversible.63 Two potential mechanisms have been proposed to describe the interfacial phase separation of the amphiphiles driven by the isotropic-to-nematic phase transition of the bulk LC: (1) changes in the short-range interactions of lipid tails that are mediated by the nematic ordering of the LC, and (2) changes in the elastic energy stored in strained states of the LC that are induced by surface anchoring of the LC.63 These two mechanisms were described by a simple thermodynamic model in which the free energy of a lipid-decorated film was evaluated as
| (4) |
where n1 is the number of lipid molecules at the interface x is the fraction of saturation monolayer coverage, N is the number of lipids on the interface at saturation, θs is the tilt of the LC at the interface, ϕ is the easy angle of the LC, A* is the area per lipid molecule at saturation coverage, χ is a pairwise interaction parameter for lipid molecules at the interface, K(T) is the temperature-dependent elastic constant of the LC (assuming splay and bend elastic constants to be equal), Wa is the anchoring energy, and D is the thickness of the film of LC.1, 63 Using this model of the free energy as a function of the amount of lipid adsorbed to the interface, a phase diagram was evaluated for the limiting cases of strong (Wa = ∞) and weak (Wa = 10-6 J/m2) anchoring of the LC by the lipid (Figure 8H). The key conclusion that can be drawn from Figure 8H is that the nematic elasticity of the LC can induce phase separation in the lipid monolayer under conditions that do not lead to phase separation in the absence of nematic elasticity. In short, by forming lipid-rich domains at the LC-aqueous interface that result in homeotropic anchoring of the LC, the LC can release some stored elastic energy. This model also predicts that the elastic energy stored in the LC can be changed by varying the film thickness or by changing the anchoring of the LC at the solid surface. By varying the thickness of the LC cell from 5μm to 40μm, a change in the interfacial phase behavior of the lipids was indeed observed in experiments (Figure 8E-G). These latter observations cannot be explained on the basis of the influence of χ (χ is independent of film thickness), thus providing unambiguous evidence that the nematic elasticity of the LC plays a central role in the phase separation of the L-DLPC.
The results presented in Figure 8 (particularly E-G) show that the interfacial phase behavior of lipids depends strongly on the geometry of the LC system. This observation has motivated a series of recent investigations, including studies of LC droplets, of the effects of confinement on the ordering of LCs. While a number of prior studies of LC emulsion systems have been reported,6, 70-73 a significant recent advance has been the preparation of a “LC-in-water” emulsion system in which precise control over both the size and interfacial chemistry of the LC droplets has been achieved.56-58 This system has yielded some observations of size-dependent ordering of nematic phases that were not anticipated based on prior theoretical developments or experimental studies.58
The methodology used to fabricate the monodisperse LC emulsion droplets is shown in Figure 9.56, 58 The synthesis starts with the use of silica micro- or nano- particles of pre-determined size, onto which polyelectrolyte multilayers are deposited. 56, 58 A number of different polymer systems have been used, including poly(acrylic acid) (PAA) and poly(allylamine hydrochloride) (PAH).58 After fabrication of the multilayer structure on the surface of each particle, the silica core is etched using hydrofluoric acid (HF). The final step involves the infiltration of the LC into the core of the polymeric capsule. This step has been achieved by adding a volatile solvent to the LC (e.g., 5% ethanol to 5CB) to break the nematic order. In the absence of nematic order, the isotropic oil (5CB + ethanol) penetrates the polymeric “walls” of the capsule. Subsequent evaporation of the ethanol from the system and contact with a bulk aqueous phase results in the spontaneous transfer into the aqueous phase of the monodisperse polymeric capsules that are filled with nematic LCs.56, 58 By using hydrogen bonded polymeric multilayers (e.g. poly(methacrylic acid) and poly(vinylpyrrollidone)), it has also been shown that it is possible to remove the multilayers from the LC droplets to prepare “naked” droplets.56 This synthesis of emulsion droplets is useful because it permits control over both the interfacial chemistry of the droplets (through the choice of polymers used to prepare the capsules) and size. In particular, it is possible to fabricate micrometer and sub-micrometer-sized droplets that cannot be readily fabricated using microfluidic-based approaches. 56, 58 Furthermore, this method of preparing LC droplets allows the production of bulk quantities of the droplets. By preparing LC droplets with different sizes but with the same polymeric shells, the size-dependent ordering of the LCs has been investigated.58
Figure 9.
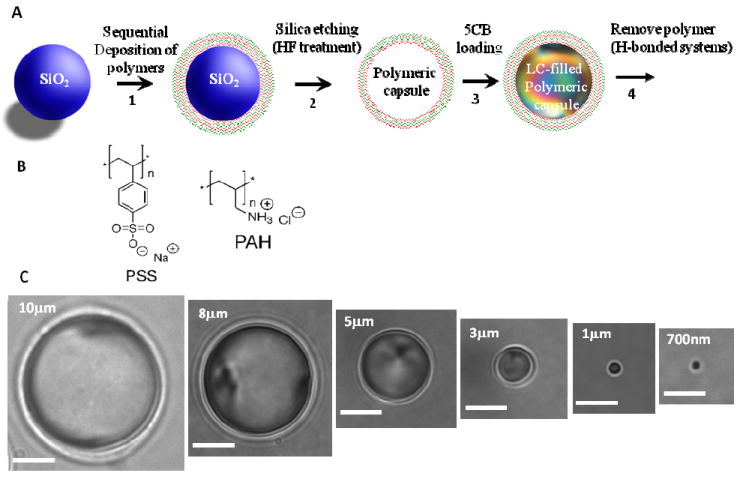
(A) Preparation of LC droplets of predetermined sizes within polymeric multilayer “shells”. Polymeric shells were prepared by sequential deposition of PSS and PAH onto silica templates and subsequent etching of silica. The resulting polymeric shells were filled with LCs (see text for details). (B) Chemical structures of the polymers used to create polymeric multilayer shells. (C) Bright-field micrographs of polymer-encapsulated 5CB droplets obtained using silica templates with diameters of 10± 0.22 μm, 8 ± 0.20 μm, 5 ± 0.19 μm, 1 ± 0.04 μm, 0.7 ± 0.08 μm, respectively. All scale bars, 3μm. Adapted with permission from Gupta, J. K.; Sivakumar, S.; Caruso, F.; Abbott, N. L., Angew Chem Int Ed 2009, 48, 1652-1655. Copyright (2009) by Wiley-InterScience.
Figure 10 shows the results of an experimental investigation that used the above-described emulsion droplets to explore the influence of confinement on the ordering of LCs.58 Prior to this investigation, scaling arguments had been used to predict that the ordering of LCs in small droplets would be uniform in the limit of decreasing size (Figure 10B). This prediction arises from the understanding that the orientation dependent interfacial energy of an LC droplet scales with the square of the droplet radius (WaR2) whereas the bulk elastic energy of the droplet scales linearly with droplet radius (KR). Thus, for LC droplets that satisfy the constraint R ≪ K/W, the LC within the droplet is predicted to avoid spatial variation of its director (n(r) = constant), consistent with elastic energies dominating the orientation of the director at small R. In contrast, for large droplets (R ≫ K/W), surface effects are predicted to dominate and the LC will be strained to satisfy the boundary conditions. The predicted transition in the ordering of the LC (for the case where the easy axis of the LC is parallel to the droplet interface, see below) with decreasing size is shown in Figure 10A and 10B. Experimental measurements (polarized light micrographs) of the size-dependent ordering of nematic 5CB when using LC droplets with diameters that ranged from 3μm to ~700nm (prepared as described above) revealed a number of important findings: (i) For large droplets, so-called “bipolar ordering” of the LC is observed; Figure 10C shows the point defects of the bipolar configuration (shown in white arrows) located at the poles of the droplet; (ii) Based on the observation of bipolar ordering in large droplets, it is inferred that the preferred alignment of the LC on the droplet surface is parallel to the surface; (iii) The ordering of LCs in small droplets with diameters ~700nm is radial (Figure 10I) and not uniform (Figure 10B); a defect is clearly located in the center of the droplet. Overall, these experimental observations are not consistent with the above-described predictions based on scaling arguments of surface and elastic effects.
Figure 10.
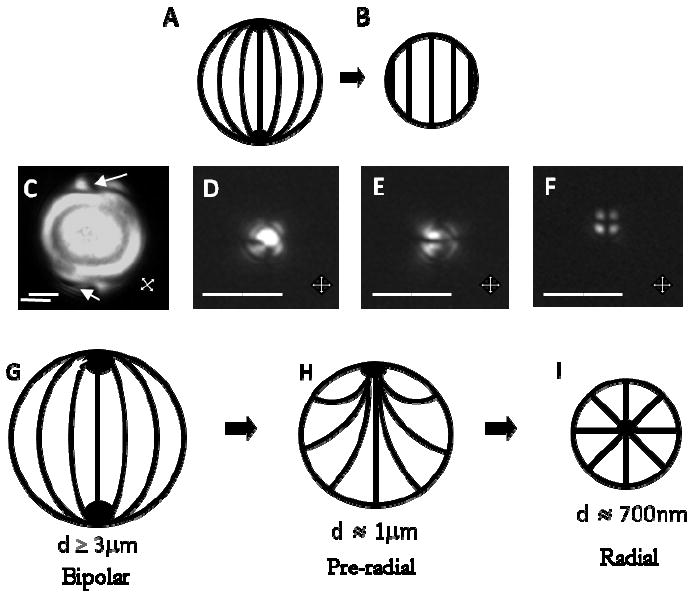
(A) Bipolar and (B) homogeneous director configurations within LC droplets. (C-F) Polarized optical micrographs of polymer-encapsulated 5CB droplets. (C) Diameter 8.0 ± 0.2 μm with bipolar ordering. (D, E) Diameter 1.0 ± 0.2 μm with pre-radial ordering. (F) Diameter 0.70 ± 0.08 μm with radial ordering. (G-I) Cartoons of bipolar, pre-radial, and radial ordering of the LC droplets. Scale bars, 2μm for C-E, 1μm for F. Reprinted with permission from Gupta, J. K.; Sivakumar, S.; Caruso, F.; Abbott, N. L., Angew Chem Int Ed 2009, 48, 1652-1655. Copyright (2009) by Wiley-InterScience.
In light of the experimental observations of monodisperse LC droplets as described above, a revised model has been formulated to describe size-dependent ordering of LCs. The revised model includes the contributions of saddle-splay and splay-bend elastic energies in the Frank-Oseen elastic energy density. The Frank-Oseen elastic energy density including K24(saddle-splay) and K13(splay-bend) elastic constants is contained within the brackets of the following expression for a confined LC2, 5-7
| (5) |
The last term in the Equation (5) describes orientation-dependent interfacial contributions to the free energy of the droplet. Equation (5) was used to evaluate the relative free energies of LC droplets with uniform (Figure 10B) and radial (Figure 10I) director profiles. For the radial profile to be stabilized with respect to the uniform one, the following constraint was determined to be a necessary condition:
| (6) |
Simplication of the above expressions leads to the constraint:
| (7) |
This model predicts that the radial configuration is more stable than the uniform configuration when the above constraint (Equation (7)) is satisfied. For nematic 5CB droplets with diameters in the micrometer/sub-micrometer range and using literature values of K11, K13, and K24, the above constraint was indeed calculated to be satisfied.58 While the model suggests a possible explanation for the experimental observations of size-dependent ordering of LC droplets on the micrometer and sub-micrometer size range, the principal conclusion emerging from the above-described experimental studies is that ordering of LCs in confined systems reflects a complex combination of elastic and surface energies that remains to be fully understood.
In addition to exploring the influence of size on the ordering of LCs within droplets, the experimental system described above has also been used to characterize adsorbate-driven ordering transitions in confined LC systems.56 Figure 11A (top) shows schematic illustrations of the LC director profiles deduced to exist within LC droplets (diameter 8.0 μm) as a function of increasing concentration of surfactant added to the aqueous phase in which the LC droplets were dispersed. For a fixed droplet size, the adsorption of surfactant (sodium dodecyl sulfate, SDS) changes the ordering of the LC from a bipolar configuration to a radial configuration (left to right). At intermediate concentrations of SDS, the defects of the LC droplet transition from point defects at the poles of the droplet to a disclination loop and then again to a point defect corresponding to the so called pre-radial ordering of the LC. Figure 11B shows an important result: the response of the LC droplet to the concentration of SDS in solution depends strongly on the size of the droplet. This result demonstrates that by controlling the size of the LC droplets (as can be achieved using the template-based synthesis of LC droplets described above), ordering transitions triggered in LC droplets by interfacial adsorbates can be tuned.58
Figure 11.
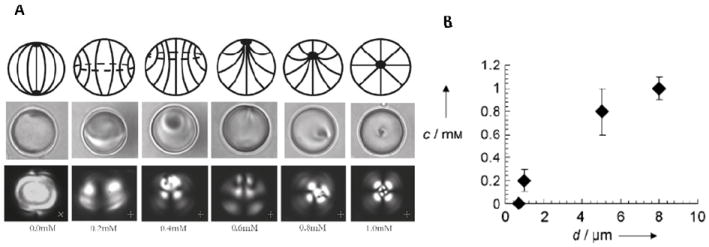
(A) Surface-driven ordering transitions of LC droplets of fixed size. The change in surface anchoring of the LC droplet (from tangential to perpendicular) was achieved by equilibrating 8.0 ± 0.2 μm diameter, polymer-encapsulated 5CB droplets with aqueous solutions containing SDS at concentrations that ranged from 0 to 1 mM. Top row: schematic illustrations of the topological ordering of the LC within each droplet. Bottom row: corresponding polarized light micrographs of the 5CB droplets. (B) Size-dependent response of polymer-encapsulated LC droplets to concentration of SDS. The SDS concentration (c) that causes radial ordering of the LC droplet is plotted as a function of droplet diameter (d). Adapted with permission from Gupta, J. K.; Sivakumar, S.; Caruso, F.; Abbott, N. L., Angew Chem Int Ed 2009, 48, 1652-1655. Copyright (2009) by Wiley-InterScience, and Gupta, J. K.; Zimmerman, J. S.; de Pablo, J. J.; Caruso, F.; Abbott, N. L., Langmuir 2009, 25, 9016-9024. Copyright (2009) from the American Chemical Society.
SECTION 3: COLLOIDAL INTERACTIONS MEDIATED BY LCS
A series of studies over the past decade have described how LCs can be used as solvents to direct the assembly of a range of colloidal species.10-14, 74 These past studies have included investigations of LC-mediated interactions of microparticles and droplets in the bulk of LC phases as well as investigations of the ordering of colloids at interfaces of LCs. Here we refer the reader to the following references for examples of research on colloidal interactions in the bulk of LCs.7, 10, 11 Below, instead, we focus on studies from our own research group on the ordering of microparticles at LC-aqueous interfaces as well as some recent studies of singl nanoparticles in LCs.
The experimental geometry used to investigate the assembly of colloidal particles at aqueous-LC interfaces is very similar to that described above in the context of investigations of lipid adsorption at aqueous-LC interfaces (Figure 12A).13 Microparticles (silica spheres with diameters of 3.3μm) were deposited onto the aqueous-LC interface by sedimentation through the aqueous phase (see Figure 13A). The microparticles were treated with dimethyloctadecyl[3-(trimethoxysilyl)propyl]ammonium chloride (DMOAP) to cause homeotropic anchoring of the LC on the surface of the particles. Figure 12B shows a polarized light micrograph of a microparticle at the LC-aqueous interface, and Figure 12C shows the corresponding bright-field image. Inspection of the bright-field image reveals a dark region corresponding to the scattering of light from a topological point defect in the LC (left of the particle in Figure 12C). From these images it was deduced that the ordering of LC around the microparticles possessed a dipolar symmetry, with the dipole oriented parallel to the interface. Figure 12D shows a schematic illustration of the director field near a particle on the LC interface. The director profile is similar to a so-called hyperbolic hedgehog defect observed with microparticles dispersed in bulk LCs (see Figure 1D). Interestingly, when the interface between the aqueous phase and 5CB was driven through a surfactant-induced ordering transition to a homeotropic orientation (Figure 12E) the location of the defect was observed to rotate below the microparticle, as shown in Figure 12F-H.
Figure 12.
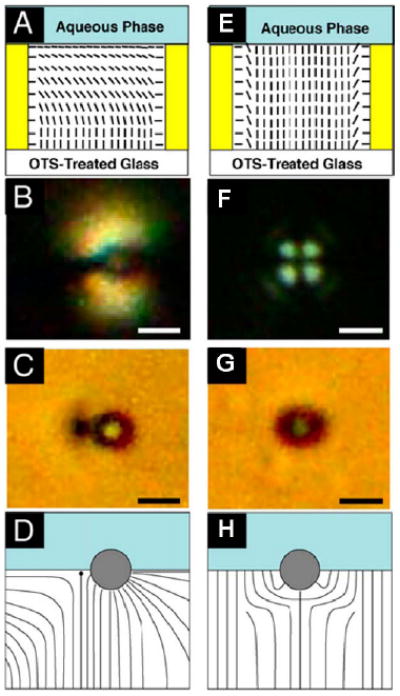
(A, E) Schematic illustrations of nematic 5CB confined within a specimen grid supported on OTS-treated glass surfaces. The orientation of the nematic 5CB at the interface to the aqueous phase is shown to be parallel to the interface in (A) (planar) and perpendicular to the interface in (F) (homeotropic). (B,C) Micrographs of a DMOAP-treated microparticle at the 5CB-aqueous interface using (B) polarized and (C) bright-field imaging. Illustration of the side view (D) of the LC orientation surrounding a single DMOAP-treated microparticle when the orientation of 5CB at the 5CB-aqueous interface was planar. (F, G) Micrographs of a DMOAP-treated microparticle at the 5CB-aqueous interface using (F) polarized and (G) bright-field imaging. Illustration of the side view (H) of the LC orientation surrounding a single DMOAP-treated microparticle when the orientation of 5CB at the 5CBaqueous interface was homeotropic. Scale bars, 2μm. Adapted from Koenig, G. M. J.; Lin, I. H.; Abbott, N. L., PNAS 2010, 107, 3998-4003.
Figure 13.
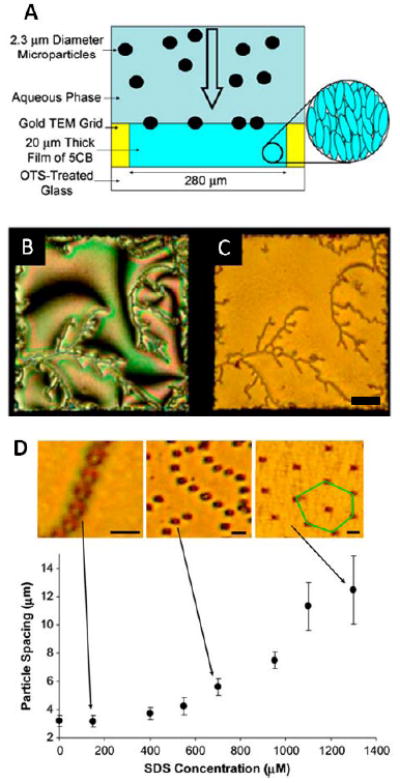
(A) Cartoon depicting the sedimentation microparticles onto an interface formed between nematic 5CB and an aqueous phase. (B,C) Interfacial assemblies of microparticles with areal densities of 4,500 microparticles/mm2 visualized using (B) polarized and (C) bright-field microscopy. (D) Centerto-center, nearest-neighbor spacing of microparticles within chains of microparticles formed at the LCaqueous interface, plotted as a function of the concentration of SDS in the aqueous phase. Images are bright-field micrographs of microparticles at the nematic 5CB-aqueous interface with aqueous phase SDS concentrations of 150, 700, and 1,300 μM. Scale bars, 50μm for C, 5μm for D. Adapted from Koenig, G. M. J.; Lin, I. H.; Abbott, N. L., PNAS 2010, 107, 3998-4003.
The above described change in the orientations of the dipolar topological defects surrounding the particles at the LC-aqueous interface is interesting in light of past studies of bulk LCs that have demonstrated that LCs can mediate long range interactions of colloidal particles through the nematic elasticity of the LC and the formation of topological defects in the LC.7, 10, 11 A novel aspect of the defects formed by the particles at the LC-aqueous interface, however, is that they can be driven through reversible changes via the adsorption and desorption of surfactants from the aqueous-LC interface. These transitions have been observed to give rise to reversible changes in the organization of the particles at the LC interface.13 Specifically, when the topological defect is located to the side of the particle, the horizontal alignment of the topological dipole leads to interparticle interactions that result in the chaining of the particles at the interface (Figure 13B and 13C). In contrast, when SDS is added to the system such that the LC-aqueous interface assumes a perpendicular orientation and the point defect rotates under the particle (Figure 13E), an array of parallel topological dipoles is created which leads to repulsive interparticle interactions. These repulsive interactions between microparticles result in formation of a hexagonal array of particles (Figure 13D). Interestingly, the ordering transition between the chains of particles and hexagonal array is not discontinuous, but intermediate states of the system comprised of chains of particles with increasing interparticle spacing are observed as a function of increasing surfactant concentration (Figure 13D). While the organization of the particles is not without defects, this simple example does demonstrate the possible use of LC-mediated interactions to create chemo-reversible assemblies of particles at LC-aqueous interfaces.13
Colloidal phenomena involving nanoscopic particles in LCs have also been the focus of recent studies by us and others.28, 75-77 Whereas much of the prior work involving particles in LCs has focused on understanding the ordering of LCs about micrometer-sized particles, relatively little is known about the defect structures and ordering of LCs in the vicinity of nanoparticles. Because the size of these particles is below the diffraction limit of light, characterization of the LC ordering by direct observation is not possible. As described below, however, methods based on measurements of plasmon resonances and diffusion coefficients have been used recently to infer the local ordering of LCs near nanoparticles.14, 76
Local ordering of LCs near metallic nanoparticles can be probed using localized surface plasmon resonance (LSPR) because LCs possess anisotropic dielectric properties (Figure 14D).75, 76 In one study, LSPR was exploited to investigate the influence of the surface chemistry of nanoparticles on surface-induced ordering of LCs, and to thereby provide insights into differences in local and far-field ordering of LCs near surfaces decorated with nanoparticles.75 Figure 14A-C shows the wavelength of light at which maximum absorbance was measured (due to LSPR) when surface-immobilized gold nanoparticles were placed into contact with nematic 5CB. Interestingly, when the samples were heated, it was observed that nanoparticles coated with SAMs formed from alkanethiols (either C10 or C16) caused an abrupt change in the wavelength corresponding to the LSPR peak at the bulk nematic to isotropic transition of the LC (Figure 14A and 14B). This result suggests that there is a strong coupling between the local ordering of the LC about the nanoparticles coated with C10 or C16 SAMs (as probed by the LSPR) and the ordering of the bulk LC. In contrast, for mixed SAMs formed from C10 and C16, no significant change in the LPSR peak position accompanied the bulk phase transition of the 5CB (Figure 14C). This indicates that the local order of LCs near nanoparticles functionalized with the mixed SAM does not change substantially when the bulk order of the LC changes. Overall, these results demonstrate that the local ordering of 5CB around gold nanoparticles is strongly dependent on the surface chemistry of the nanoparticles. More broadly, the results above indicate that the LSPR of nanoparticles offers approaches to the measurement of the local ordering of LCs near nanoparticles, a potentially useful capability given that the connection between the local and far-field ordering of LCs is poorly understood near many interfaces.3
Figure 14.
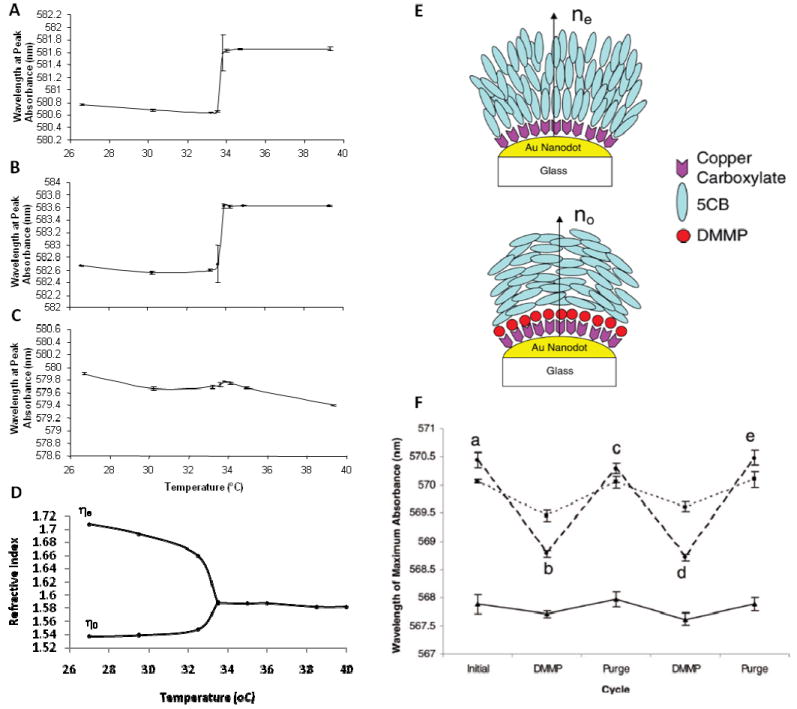
(A-C) Temperature dependence of the LSPR peak of gold nanoparticles functionalized with (A) decanethiol, (B) hexadecanethiol, (C) 8:2 mixture of decanethiol and hexadecanethiol. The measurements were performed with the surface-immobilized nanoparticles in contact with 5CB. Prior to chemical functionalization, the peak absorbance was measured in air to occur at 546.7 nm. (D) Ordinary (n0) and extraordinary (ne) refractive indices of 5CB as a function of temperature for light with a wavelength of 589 nm. (E) Schematic illustration of the local ordering of 5CB near the surface of copper carboxylate-functionalized gold nanoparticles before and after exposure to DMMP. (F) (--) LSPR responses following exposure of the film of 5CB to (a) air (b) 10 ppm DMMP, (c) re-exposure to air, (d) re-exposure to 10 ppm DMMP, and (e) re-exposure to air. (▪▪) LSPR response to DMMP with the bulk 5CB heated into the isotropic phase. (—) LSPR response using an isotropic oil rather than 5CB. Adapted from Koenig, G. M. J.; Meli, M. V.; Park, J. S.; de Pablo, J. J.; Abbott, N. L., Chem Mater 2007, 19, 1053-1061. Copyright (2007) American Chemical Society, and Koenig, G. M. J.; Gettlefinger, B. T.; de Pablo, J. J.; Abbott, N. L., Nanoletters 2008, 8, 2362-2368. Copyright (2008) American Chemical Society.
A second study has used surfaces decorated with gold nanoparticles that were functionalized with Cu2+ ions.76 As described in Figure 4, this system is an interesting one because coordination interactions between the Cu2+ and 5CB leads to local homeotropic ordering of the LC. Exposure of the interface to DMMP, however, leads to a competitive coordination interaction that disrupts the coordination of the nitrile group of 5CB with Cu2+ which, as shown in Figure 4, leads to a bulk ordering transition in the LC. Inspection of the LSPR response of the Cu2+-functionalized nanoparticles reveals that exposure to DMMP leads to a change in the LSPR resonance of the nanoparticles that is mediated by the reordering of the LC (Figure 14F). Although the shift of 1.7 nm is smaller than the calculated blue shift based on the maximum possible change in refractive index during reordering of the 5CB (Figure 14D), the change in the position of the LSPR maximum is substantially greater than that measured when an isotropic oil was used (0.2nm). These results suggest that cooperative ordering transitions involving nematic LCs can be used to amplify the changes in refractive index about nanoparticles and increase LPSR responses to binding events. 76
Another methodology that has been used to characterize the local ordering of LCs near nanoparticles has involved measurements of diffusion coefficients of single nanoparticles in LCs.14 The methodology is based on previous experimental studies of micrometer-sized particles in LCs as well as theoretical predictions that the diffusion coefficients of particles dispersed in LCs depend on the ordering of the LC near the particle.18, 78
As shown in the Supporting Information (Figure S2), the diffusion coefficients of gold nanoparticles (130nm diameter) dispersed in LCs can be determined using darkfield microscopy. The trajectories of nanoparticles can be determined using darkfield microscopy and then used to plot probability distribution of particle displacements. These distributions can be used to calculate the diffusion coefficients of the nanoparticles in the LCs. Table 1 shows diffusion coefficients measured for metallic nanoparticles functionalized with either decanethiol (which promotes planar anchoring of LCs on macroscopic surfaces) or a mixed SAM formed from 8:2 decanethiol: hexadecanethiol (which promotes homeotropic anchoring of the LC). Inspection of Table 1 reveals that the diffusion coefficients of the nanoparticles were measured to be 10 ± 1 μm2/s (independent of surface chemistry) when measured in isotropic solvents, in agreement with the diffusion coefficient calculated using the Stokes-Einstein equation (10.1 ± 1.0 × 10⁻² μm2/s). In nematic 5CB, however, the diffusion coefficient of the nanoparticles functionalized with decanethiol (planar anchoring) was measured to be 1.5 times higher than the diffusion coefficient of the nanoparticles functionalized to cause homeotropic anchoring. The difference in diffusion coefficients of the particles functionalized with decanethiol and the mixed SAM suggests that there is indeed a difference in the surface ordering around the nanoparticles. The observation of a larger diffusion coefficient for nanoparticles functionalized to cause homeotropic anchoring is consistent with predictions that Saturn ring defects form around nanoparticles with homeotropic anchoring and boojum defects form around nanoparticles with planar anchoring. As discussed in detail elsewhere, nanoparticles with boojum defects are expected to have a lower effective viscosity than nanoparticles with homeotropic anchoring because the presence of the boojum defects leads to regions of the LC near the nanoparticle surface that experiences the lowest of the Miesowicz viscosities (which is not the case for Saturn ring defects).14
Table 1.
Diffusion coefficients of nanoparticles functionalized with decanethiol and hexadecanethiol dissolved in isotropic and nematic 5CB. Adapted with permission from Koenig, G. M. J.; Ong, R.; Cortes, A. D.; Moreno-Razo, J. A.; de Pablo, J. J.; Abbott, N. L., NanoLetters 2009, 9, 2794-2801. Copyright (2009) American Chemical Society.
| Solvent | Nanoparticles functionalized with | Diffusion coefficient (10-2 μm2/s) |
|---|---|---|
| Isotropic oil | decanethiol | 10.2 ± 1.3 |
| 8:2 decanethiol: hexadecanethiol | 10.3 ± 1.0 | |
| Nematic 5CB | decanethiol | 6.58 ± 0.52 |
| 8:2 decanethiol: hexadecanethiol | 4.38 ± 0.53 | |
| Isotropic 5CB at 40°C | Decanethiol | 14.1 ± 2.3 |
| 8:2 decanethiol: hexadecanethiol | 10.7 ± 1.3 | |
| Water | Nanoparticles as purchased | 272 ± 16 |
Darkfield microscopy has also been used to measure reversible pair-wise interactions between gold nanoparticles dispersed in nematic LCs.12 As mentioned above, past studies of microparticles in nematic LC solvents have reported strong inter-particle interactions (on the order of 103kBT). These energies of interaction are too high to permit reversible associations of particles in bulk LCs. Furthermore, numerical simulations of nanoparticles predict that interactions between nanoparticles should be short ranged (< 150nm for 100-nm particles) yet remain very strong (102-103 kBT).79 The experimental results in Figure S3, in contrast, show that interactions between gold nanoparticles (diameter of 130nm) in LCs can be long ranged ( ~1 μm) and sufficiently weak to allow reversible interactions between the nanoparticles. Specifically, by using time-lapse dark-field microscopy and particle tracking, it was observed that a pair of nanoparticles (diameters 169 nm, chemically functionalized with mixed SAMs formed from a 8:2 mixture of decanethiol: hexadecanethiol) spontaneously and reversibly formed “dimers”. The potential of mean force (PMF) calculated from a probability distribution function of the distance between the two nanoparticles shows that the minimum PMF was ~3.4 kBT, several orders of magnitude less than the predicted value. Additional studies are required to reconcile the differences between the experimental observations and theoretical predictions.80
The examples described above involved particles dispersed at low concentrations in LCs. Recent experiments have also revealed that a variety of interesting and complex colloidal phenomena are encountered when concentrated colloidal dispersions are prepared in LCs. In particular, interparticle forces mediated by LCs have been reported to lead to the formation of gel-like materials.81-83 The precise mechanism of formation of the gel has not yet been determined, but it is hypothesized to involve the expulsion of colloidal particles from the nematic domains upon cooling from an isotropic phase to a nematic phase (Figure 15A). The mechanical properties of the gels depend on the type of LC used to form the gel as well as the concentration of the colloids dispersed in the LC. For example, Figure 15B compares the storage moduli of gels prepared from nematic 5CB and nematic E7. The storage modulus (G’) of 5CB exhibits a sharp increase at the nematic to isotropic transition. In contrast, the G’ of E7 does not increase sharply at the nematic to isotropic transition. This can be explained by the fact that E7 is composed of a mixture of mesogens (whereas 5CB is a single-component LC), thus the phase transition occurs over a range of temperatures.
Figure 15.
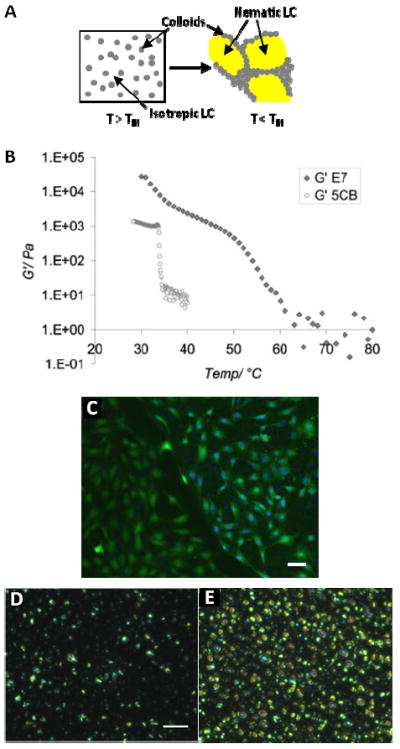
(A) Schematic illustration of the formation of colloidal networks upon cooling of mesogens below the nematic-to-isotropic transition temperature (TNI). (B) Storage moduli of the CLC composites made with 15 wt% polystyrene (PS) particles (1 μm diameter) suspended in E7 or 5CB. (C) Cells stained with calcein-AM and Hoescht stain, on CLC or on glass coverslip around CLC (scale bar = 50 μm). (D) CLC gel exposed to DMMP at 0 seconds, and (E) 80 seconds. (scale bar = 30μm). Adapted with permission from Agarwal, A.; Huang, E.; Palecek, S.; Abbott, N. L., Advanced Materials 2008, 20, 4804-4809. Copyright (2008) Wiley-InterScience, and Pal, S. K.; Agarwal, A.; Abbott, N. L., Small 2009, 5, 2589-2596. Copyright (2009) Wiley-InterScience.
The mechanical properties of LC-based gels provide the possibility of using them as mechanically tunable substrates for the culture of mammalian cells and for reporting the interactions of cells with substrates.84 For example, G’ measured for E7 gels is compatible with the culture of fibroblasts, which typically requires substrates with G’ > 2 kPa to attach and spread on surfaces. As shown in Figure 15C, fibroblasts indeed do grow and proliferate on E7 gels (they do not attach to E7 alone as it is too soft).81 In addition to the culture of cells, LC gels have been shown to undergo ordering transitions when supported on chemically functionalized surfaces and exposed to organophosphonates (as described in Figure 4) (Figure 15 D,E). Figure 15D shows the optical appearance of an LC gel exposed to DMMP at 0 seconds, and Figure 15E shows the optical appearance after 80 seconds.82 Overall, LC gels are a promising class of soft materials that have mechanical properties that make them biologically compatible and they also offer the basis of biologically and chemically responsive systems.
CONCLUSIONS
Fundamental research involving LCs, including the interfacial ordering of LCs, has undergone a renaissance over the past decade. Whereas a principal driver of research involving LCs from the 1970s to 2000 was the potential utility of LCs in optical displays (and related devices),2 following the maturation of LC display technology, scientists involved in LC research are now pursuing fundamental questions and applications that are far more diverse in motivation and potential impact. This article has focused on three areas of research that have been advanced by our own laboratory over the past 10 years.
The first of these areas is centered on surface-driven ordering transitions at chemically functionalized solid surfaces. While it is well established that the ordering of LCs at surfaces is exquisitely sensitive to the details of the structure of surfaces and resulting intermolecular interactions, studies of the ordering of LCs on chemically and biochemically functionalized surfaces have been broadly enabled over the past decade by advances in the fabrication of surfaces with precisely defined levels of molecular organization and topography. These materials have provided the necessary level of control over interfacial structure to enable studies of the ordering of LCs on complex interfaces.4, 23, 26, 38, 40 A key example is the formation of self-assembled monolayers on films of gold4, 19, 22-25, 30, 31, 36-38, 41, 85 and their patterning on micrometer-scales.4, 19, 22, 23, 36, 38, 41 As progress continues in these enabling areas of materials chemistry, additional opportunities will emerge to advance our understanding of how the structure of chemically complex interfaces impacts the ordering of LCs. Promising approaches that remain largely unexplored in the context of surface-induced ordering of LCs include the layer-by-layer deposition of polymers,86 surface-initiated polymerization 87 and various forms of nanolithography. While the examples presented in this paper illustrate some of the recent progress that has been made in studies of interfacial phenomena involving LCs, many unresolved fundamental issues remain to be addressed. In particular, an understanding of the intermolecular interactions that order LCs at biomolecular interfaces remains to be elucidated. For example, a series of observations establish that nematic LCs such as 5CB assume orientations that are parallel to many protein-functionalized interfaces.19, 22, 24, 25 The intermolecular interactions that are responsible for the ordering of LCs on these surfaces, however, are not known. Ongoing studies based on oligopeptides immobilized on surfaces seek to advance our understanding on this front.19 In the long term, this fundamental knowledge will enable the design of responsive LC-based material systems that exhibit high sensitivities and selectivities to targeted molecules and their assemblies.
The second broad area of research highlighted in this article involves the ordering of LCs at aqueous interfaces (LC-aqueous interfaces). LC-aqueous interfaces are noteworthy for several reasons. First, because the mobilities of molecules are far greater at LC-aqueous interfaces than solid surfaces, studies of LC-aqueous interfaces can be used to unmask the influence of LCs on the interfacial organization of adsorbates.63, 69 It has been revealed, for example, that the nematic elasticity of LCs can lead to changes in the phase behavior of lipid monolayers formed at these interfaces.63 This observation a significant one because it suggests that manipulation of the elastic energy stored in a LC (such as through application of an external field) might enable active control of the organization and/or phase behavior of molecules at interfaces. Here we note the biological precedent: Many of the functions of biological membranes are achieved by dynamic control over the spatial organization of proteins, and it is now appreciated that manipulation of the curvature and associated elastic energies of lipid bilayers is a key strategy to achieve this control.88 Aqueous interfaces of synthetic LCs provide the basis of experimental systems that can be used to explore the translation of these biological design principles to engineered systems. A second opportunity involves the reporting of biomolecular interactions through the triggering of ordering transitions in LCs at aqueous interfaces. Research in this area is nascent, and while several examples now exist, the design rules for the creation of such interfaces to report, for example, specific binding events involving biological molecules remain to be elucidated.55, 65 What is clear, however, from the early studies in this area is that LCs offer potentially important opportunities for the creation of biological sensors because LCs probe the structure of molecules present at interfaces.49, 65 This is illustrated by the observation that ordering transitions triggered by the lipids assembled at LC-aqueous interfaces are easily differentiated from ordering transitions triggered by proteins.89 Furthermore, it is now clear that various aggregated states of proteins at the LC-aqueous interface can be clearly differentiated by the ordering of the LC.49, 89 In contrast, many existing principles for biosensing rely on detection of the “optical mass” of molecules captured at an interface, and are thus insensitive to the structure of analytes.
The third area addressed by this article involves colloidal interactions mediated by LCs. Since the pioneering work of Weitz, Lubensky and Poulin in this area in the late 1990’s,7, 10 rapid progress has been made in understanding the ordering of LCs about micrometer-sized particles and the resulting interparticle interactions. For example, the symmetries of topological defects formed about particles in LCs can give rise to dipolar or quadrupolar interactions between particles and lead to the ordering of the particles.10, 11, 13, 15, 74, 90 More recent studies have moved to consider solid particles at LC-aqueous interfaces13 as well as to explore the ordering of LCs around nanoparticles.12, 14 In this latter area, promising approaches include the use of localized surface plasmon resonances to characterize the ordering of LCs (via the influence of ordering on the local dielectric properties)75, 76 as well as measurements of the mobilities of nanoparticles in LCs.12, 14 In particular, measurements of the mobilities of nanoparticles suggest that the apparent viscosities of the LCs are substantially different from those measured using micrometer-sized particles. These measurements hint that the ordering of LCs about the nanoparticles may be different from that about micrometer-sized particles. 12, 14 Likely related to this observation, measurements of the potential of mean force (PMF) of the interaction between two nanoparticles across a nematic LC indicate the presence of interactions that are much weaker than those predicted from simulations.12 Additional measurements using a range of sizes of particles are needed to understand the size-dependence of the ordering of LCs about nanoparticles and the associated interparticle interactions.80 We mention also the recent demonstration of the use of LCs to drive the reversible formation of self-assembled structures of colloidal particles at interfaces, and the use of this phenomenon to create chemo-responsive arrays of particles.13, 91 We end by noting that the recent development of a technique to produce bulk quantities of polymer-encapsulated, micrometer-sized LC droplets with controlled size and surface chemistry now provides experimentalists with the opportunity to investigate the relative contributions of surface energies, elastic energies, and defects energies that collectively dictate the ordering of LCs in droplets.56-58 The ability to design these relative contributions based only on the size of the droplet may provide access to responsive LC materials that are even more sensitive than those demonstrated to date at planar LC interfaces.
Supplementary Material
Acknowledgments
This work was supported by the NSF under awards DMR-0520527 (MRSEC), DMR 0079983, and DMR-0537588 (SRC), by the National Institutes of Health (CA108467 and CA105730). Y.B. acknowledges receipt of a Graduate Fellowship from the NSF. The authors thank Rebecca Carlton and Daniel Miller for their careful reading of our manuscript.
Footnotes
Supporting Information Available: Additional figures available (discussed in text). This information is available free of charge via the Internet at: http://pubs.acs.org/.
References
- 1.de Gennes PG, Prost J. The Physics of Liquid Crystals. Oxford University Press; London: 1994. [Google Scholar]
- 2.Collings PJ, Hird M. Introduction to Liquid Crystals. Taylor & Francis Ltd; 1997. [Google Scholar]
- 3.Jerome B. Rep Prog Phys. 1991;54:391–451. [Google Scholar]
- 4.Gupta VK, Abbott NL. Physical Review E. 1996;54:4540–4543. [Google Scholar]
- 5.Lockwood NA, Gupta JK, Abbott NL. Surface Science Reports. 2008;63:255–293. [Google Scholar]
- 6.Lavrentovich OD. Liq Cryst. 1998;24 [Google Scholar]
- 7.Poulin P, Weitz DA. Phys Rev E. 1998;57 [Google Scholar]
- 8.Kim EB, Guzman O, Grollau S, Abbott NL, de Pablo JJ. Journal of Chemical Physics. 2004;121:1949–1961. doi: 10.1063/1.1761054. [DOI] [PubMed] [Google Scholar]
- 9.Guzman O, Kim EB, Grollau S, Abbott NL, de Pablo JJ. Physical Review Letters. 2003;91 doi: 10.1103/PhysRevLett.91.235507. [DOI] [PubMed] [Google Scholar]
- 10.Poulin P, Stark H, Lubensky TC, Weitz DA. Science. 1997;275:1770–1773. doi: 10.1126/science.275.5307.1770. [DOI] [PubMed] [Google Scholar]
- 11.Skarabot M, Ravnik M, Zumer S, Tkalec U, Poberaj I, Babic D, Osterman N, Musevic I. Physical Review E. 2008;77:031705. doi: 10.1103/PhysRevE.77.031705. [DOI] [PubMed] [Google Scholar]
- 12.Koenig GMJ, de Pablo JJ, Abbott NL. Langmuir. 2009;25:13318–13321. doi: 10.1021/la903464t. [DOI] [PubMed] [Google Scholar]
- 13.Koenig GMJ, Lin IH, Abbott NL. PNAS. 2010;107:3998–4003. doi: 10.1073/pnas.0910931107. [DOI] [PMC free article] [PubMed] [Google Scholar]
- 14.Koenig GMJ, Ong R, Cortes AD, Moreno-Razo JA, de Pablo JJ, Abbott NL. NanoLetters. 2009;9:2794–2801. doi: 10.1021/nl901498d. [DOI] [PubMed] [Google Scholar]
- 15.Musevic I, Skarabot M, Tkalec U, Ravnik M, Zumer S. Science. 2006;313 doi: 10.1126/science.1129660. [DOI] [PubMed] [Google Scholar]
- 16.Gu Y, Abbott NL. Phys Rev Lett. 2000;85 doi: 10.1103/PhysRevLett.85.4719. [DOI] [PubMed] [Google Scholar]
- 17.Stark H. Physics Reports. 2001;351:387–474. [Google Scholar]
- 18.Loudet JC, Hanussee P, Poulin P. Science. 2004;306 doi: 10.1126/science.1102864. [DOI] [PubMed] [Google Scholar]
- 19.Clare BH, Guzman O, de Pablo JJ, Abbott NL. Langmuir. 2006;22:7776–7782. doi: 10.1021/la0604578. [DOI] [PubMed] [Google Scholar]
- 20.Cadwell KD, Alf ME, Abbott NL. J Phys Chem B. 2006;110:26081–26088. doi: 10.1021/jp063211k. [DOI] [PubMed] [Google Scholar]
- 21.Cadwell KD, Lockwood NA, Nellis BA, Alf ME, Willis CR, Abbott NL. Sensors and Actuators B. 2007;128:91–98. [Google Scholar]
- 22.Clare BH, Abbott NL. Langmuir. 2005;21:6451–6461. doi: 10.1021/la050336s. [DOI] [PubMed] [Google Scholar]
- 23.Clare BH, Guzman O, de Pablo JJ, Abbott NL. Langmuir. 2006;22:4654–4659. doi: 10.1021/la0535126. [DOI] [PubMed] [Google Scholar]
- 24.Lowe AM, Bertics PJ, Abbott NL. Analytical Chemistry. 2008;80:2637–2645. doi: 10.1021/ac800097c. [DOI] [PMC free article] [PubMed] [Google Scholar]
- 25.Lowe AM, Ozer BH, Bai Y, Bertics PJ, Abbott NL. Applied Materials and Interfaces. 2010;2:722–731. doi: 10.1021/am900753v. [DOI] [PMC free article] [PubMed] [Google Scholar]
- 26.Skaife JJ, Abbott NL. Chem Mater. 1999;11:612–623. [Google Scholar]
- 27.Yang KL, Cadwell KD, Abbott NL. J Phys Chem B. 2004;108:20180–20186. [Google Scholar]
- 28.Qi H, Hegmann T. ACS Applied Materials & Interfaces. 2009;1:1731–1738. doi: 10.1021/am9002815. [DOI] [PubMed] [Google Scholar]
- 29.Hoogboom J, Garcia PML, Otten MBJ, Elemans J, Sly J, Lazarenko SV, Rasing T, Rowan AE, Nolte RJM. JACS. 2005;127:11047–11052. doi: 10.1021/ja051865l. [DOI] [PubMed] [Google Scholar]
- 30.Shah RR, Abbott NL. Science. 2001;293:1296–1299. doi: 10.1126/science.1062293. [DOI] [PubMed] [Google Scholar]
- 31.Shah RR, Abbott NL. J Phys Chem B. 2001;105:4936–4950. [Google Scholar]
- 32.Bi XY, Yang KL. Journal of Physical Chemistry C. 2008;112:1748–1750. [Google Scholar]
- 33.Drawhorn RA, Abbott NL. Journal of Physical Chemistry. 1995;99:16511–16515. [Google Scholar]
- 34.Shah RR, Abbott NL. JACS. 1999;121:11300–11310. [Google Scholar]
- 35.Evans SD, Allinson H, Boden N, Flynn TM, Henderson JR. Journal of Physical Chemistry B. 1997;101:2143–2148. [Google Scholar]
- 36.Govindaraju T, Bertics PJ, Raines RT, Abbott NL. JACS. 2007;129:11223–11231. doi: 10.1021/ja073203x. [DOI] [PubMed] [Google Scholar]
- 37.Prime KL, Whitesides GM. Science. 1991;252:1164–1167. doi: 10.1126/science.252.5009.1164. [DOI] [PubMed] [Google Scholar]
- 38.Follonier S, Miller WJW, Abbott NL, Knoesen A. Langmuir. 2003;19:10501–10509. [Google Scholar]
- 39.Berreman DW. Mol Cryst Liq Cryst. 1973;23:215–231. [Google Scholar]
- 40.Luk Y-Y, Yang K-L, Cadwell K, Abbott NL. Surface Science. 2004;570:43–56. [Google Scholar]
- 41.Gupta VK, Abbott NL. Science. 1997;276:1533–1536. [Google Scholar]
- 42.Huang JY, Superfine R, Shen YR. Physical Review A. 1990;42:3660. doi: 10.1103/physreva.42.3660. [DOI] [PubMed] [Google Scholar]
- 43.Fonseca JG, Galerne Y. Applied Physics Letters. 2001;79:2910–2912. [Google Scholar]
- 44.Faetti S, Marianelli P. Phys Rev E Stat Nonlin Soft Matter Phys. 2005;72:051708. doi: 10.1103/PhysRevE.72.051708. [DOI] [PubMed] [Google Scholar]
- 45.Xue CY, Yang KL. Langmuir. 2008;24:563–567. doi: 10.1021/la7026626. [DOI] [PubMed] [Google Scholar]
- 46.Gupta VK, Skaife JJ, Dubrovsky TB, Abbott NL. Science. 1998;279:2077–2080. doi: 10.1126/science.279.5359.2077. [DOI] [PubMed] [Google Scholar]
- 47.Lowe AM, Ozer BH, Wiepz GJ, Bertics PJ, Abbott NL. Lab on a Chip. 2008;8:1357–1364. doi: 10.1039/b801935e. [DOI] [PMC free article] [PubMed] [Google Scholar]
- 48.Hunter JT, Pal SK, Abbott NL. ACS Applied Materials & Interfaces. 2010;2:1857–1865. [Google Scholar]
- 49.Brake JM, Daschner MK, Luk YY, Abbott NL. Science. 2003;302:2094–2097. doi: 10.1126/science.1091749. [DOI] [PubMed] [Google Scholar]
- 50.Lockwood NA, Abbott NL. Current Opinion in Colloid & Interface Science. 2005;10:111–120. [Google Scholar]
- 51.Lee DY, Seo JM, Khan W, Kornfield JA, Kurji Z, Park SY. Soft Matter. 6:1964–1970. [Google Scholar]
- 52.Lockwood NA, de Pablo JJ, Abbott NL. Langmuir. 2005;2005:6805–6814. doi: 10.1021/la050231p. [DOI] [PubMed] [Google Scholar]
- 53.Brake JM, Abbott NL. Langmuir. 2002;18:6101–6109. [Google Scholar]
- 54.Brake JM, Mezera AD, Abbott NL. Langmuir. 2003;19:8629–8637. [Google Scholar]
- 55.Price AD, Schwartz DK. JACS. 2008;130:8188–8194. doi: 10.1021/ja0774055. [DOI] [PubMed] [Google Scholar]
- 56.Gupta JK, Zimmerman JS, de Pablo JJ, Caruso F, Abbott NL. Langmuir. 2009;25:9016–9024. doi: 10.1021/la900786b. [DOI] [PubMed] [Google Scholar]
- 57.Sivakumar S, Gupta JK, Abbott NL, Caruso F. Chemistry of Materials. 2008;20:2063–2065. [Google Scholar]
- 58.Gupta JK, Sivakumar S, Caruso F, Abbott NL. Angew Chem Int Ed. 2009;48:1652–1655. doi: 10.1002/anie.200804500. [DOI] [PubMed] [Google Scholar]
- 59.Mullin CS, Guyotsionnest P, Shen YR. Phys Rev A. 1989;39:3745–3747. doi: 10.1103/physreva.39.3745. [DOI] [PubMed] [Google Scholar]
- 60.Lai SL, Hartono D, Yang KL. Applied Physics Letters. 2009;95 [Google Scholar]
- 61.Fletcher PDI, Kang NG, Paunov VN. Chemphyschem. 2009;10:3046–3053. doi: 10.1002/cphc.200900405. [DOI] [PubMed] [Google Scholar]
- 62.Kühnau U, Petrov AG, Klose G, Schmiedel H. Physical Review E. 1999;59:578. [Google Scholar]
- 63.Gupta JK, Meli MV, Teren S, Abbott NL. Physical Review Letters. 2008;100:048301. doi: 10.1103/PhysRevLett.100.048301. [DOI] [PubMed] [Google Scholar]
- 64.Brake JM, Mezera AD, Abbott NL. Langmuir. 2003;19:6436–6442. [Google Scholar]
- 65.Brake JM, Abbott NL. Langmuir. 2007;23:8497–8507. doi: 10.1021/la0634286. [DOI] [PubMed] [Google Scholar]
- 66.Dahmen-Levison U, Brezesinski G, Möhwald H. Thin Solid Films. 1998:327–329. 616–620. [Google Scholar]
- 67.Gast AP, Robertson CR, Wang S-W, Yatcilla MT. Biomolecular Engineering. 1999;16:21–27. doi: 10.1016/s1050-3862(99)00045-5. [DOI] [PubMed] [Google Scholar]
- 68.Hartono D, Bi X, Yang KL, Yung L-YL. Advanced Functional Materials. 2008;18:2938–2945. [Google Scholar]
- 69.Gupta JK, Abbott NL. Langmuir. 2009;25:2026–2033. doi: 10.1021/la803475c. [DOI] [PMC free article] [PubMed] [Google Scholar]
- 70.Drzaic PS. Liquid Crystal Dispersions. World Scientific Publishing Company; Singapore: 1995. [Google Scholar]
- 71.Kinsinger MI, Buck ME, Abbott NL, Lynn DM. Langmuir. 26:10234–10242. doi: 10.1021/la100376u. [DOI] [PMC free article] [PubMed] [Google Scholar]
- 72.Fernandez-Nieves A, Link DR, Marquez M, Weitz DA. Physics Review Letters. 2007;98:087801. doi: 10.1103/PhysRevLett.98.087801. [DOI] [PubMed] [Google Scholar]
- 73.Tjipto E, Cadwell KD, Quinn JF, Johnston APR, Abbott NL, Caruso F. Nano Letters. 2006;6:2243–2248. doi: 10.1021/nl061604p. [DOI] [PubMed] [Google Scholar]
- 74.Lin IH, Koenig GM, de Pablo JJ, Abbott NL. The Journal of Physical Chemistry B. 2008;112:16552–16558. doi: 10.1021/jp807286s. [DOI] [PubMed] [Google Scholar]
- 75.Koenig GMJ, Meli MV, Park JS, de Pablo JJ, Abbott NL. Chem Mater. 2007;19:1053–1061. [Google Scholar]
- 76.Koenig GMJ, Gettlefinger BT, de Pablo JJ, Abbott NL. Nanoletters. 2008;8:2362–2368. doi: 10.1021/nl801180c. [DOI] [PubMed] [Google Scholar]
- 77.Hung FR, Gettelfinger BT, Koenig GM, Abbott NL, de Pablo JJ. Journal of Chemical Physics. 2007;127 doi: 10.1063/1.2770724. [DOI] [PubMed] [Google Scholar]
- 78.Ruhwandl RW, Terentjev EM. Phys Rev E. 1996;54 doi: 10.1103/physreve.54.5204. [DOI] [PubMed] [Google Scholar]
- 79.Grollau S, Kim EB, Guzman O, Abbott NL, de Pablo JJ. Journal of Chemical Physics. 2003;119:2444–2455. [Google Scholar]
- 80.Skarabot M, Musevic I. Soft Matter. 2010 doi: 10.1039/c7sm00136c. [DOI] [PubMed] [Google Scholar]
- 81.Agarwal A, Huang E, Palecek S, Abbott NL. Advanced Materials. 2008;20:4804–4809. [Google Scholar]
- 82.Pal SK, Agarwal A, Abbott NL. Small. 2009;5:2589–2596. doi: 10.1002/smll.200900961. [DOI] [PubMed] [Google Scholar]
- 83.Terentjev EM, Warner M, Bladon P. Journal De Physique II. 1994;4:667–676. [Google Scholar]
- 84.Lockwood NA, Mohr JC, Ji L, Murphy CJ, Palecek SR, de Pablo JJ, Abbott NL. Advanced Functional Materials. 2006;16:618–624. [Google Scholar]
- 85.Pale-Grosdemange C, Simon ES, Prime KL, Whitesides GM. JACS. 1991;113:12–20. [Google Scholar]
- 86.Decher G. Science. 1997;277:1232–1237. [Google Scholar]
- 87.Hawker CJ, Bosman AW, Harth E. Chemical Reviews. 2001;101:3661–3688. doi: 10.1021/cr990119u. [DOI] [PubMed] [Google Scholar]
- 88.Huang KC, Mukhopadhyay R, Wingreen NS. PLoS Comput Biol. 2006;2:e151. doi: 10.1371/journal.pcbi.0020151. [DOI] [PMC free article] [PubMed] [Google Scholar]
- 89.De Tercero MD, Abbott NL. Chemical Engineering Communications. 2009;196:234–251. doi: 10.1080/00986440802290060. [DOI] [PMC free article] [PubMed] [Google Scholar]
- 90.Hung FR. Physical Review E. 2009;79 doi: 10.1103/PhysRevE.79.021705. [DOI] [PubMed] [Google Scholar]
- 91.Lin IH, Meli MV, Abbott NL. Journal of Colloid and Interface Science. 2009;336:90–99. doi: 10.1016/j.jcis.2009.03.068. [DOI] [PMC free article] [PubMed] [Google Scholar]
Associated Data
This section collects any data citations, data availability statements, or supplementary materials included in this article.