

Abstract
Over the last decade, translational science has come into the focus of academic medicine, and significant intellectual and financial efforts have been made to initiate a multitude of bench-to-bedside projects. The quest for suitable biomarkers that will significantly change clinical practice has become one of the biggest challenges in translational medicine. Quantitative measurement of proteins is a critical step in biomarker discovery. Assessing a large number of potential protein biomarkers in a statistically significant number of samples and controls still constitutes a major technical hurdle. Multiplexed analysis offers significant advantages regarding time, reagent cost, sample requirements and the amount of data that can be generated. The two contemporary approaches in multiplexed and quantitative biomarker validation, antibody-based immunoassays and MS-based multiple (or selected) reaction monitoring, are based on different assay principles and instrument requirements. Both approaches have their own advantages and disadvantages and therefore have complementary roles in the multi-staged biomarker verification and validation process. In this review, we discuss quantitative immunoassay and multiple reaction monitoring/selected reaction monitoring assay principles and development. We also discuss choosing an appropriate platform, judging the performance of assays, obtaining reliable, quantitative results for translational research and clinical applications in the biomarker field.
Keywords: Biomarker, Immunoassay, Multiple reaction monitoring, Multiplex assay, Quantitation
1. Clinical perspective
The goal of clinical proteomics is often to identify circulating biomarkers for diagnosis, prognosis, risk stratification, and treatment monitoring [1–4]. Rapid advances in MS, bioinformatics tools, and related proteomic (protein and peptide-separation and isolation) technologies have made it possible to identify hundreds to thousands of proteins from a single sample, albeit with sufficient sample amounts and often using more than one protein/peptide separation method. Currently, there are two general approaches to biomarker discovery: broad-based laboratory screens and hypothesis-driven, candidate or targeted protein screens [5, 6]. A subsequent validation phase is needed to select the bona fide disease-specific markers from a larger pool of candidates. In many biomarker screens, a large number of candidate markers are not verified and/or validated in independent cohorts [7, 8].
These have led to an ever increasing demand of analytical tools that enable faster translation of results into clinical practice. The “omics” technologies have played a special role in these developments since hopes have been that high-throughput technologies will facilitate translation. Thus, the reliable and absolute quantification of a large number of biomarker candidates present a major bottleneck [9]. Currently, there are two approaches for absolute quantification: antibody-based and MS-based assays. Although immunoassay based quantitation is widely employed, alternative methods such as MS-based absolute quantitation by multiple reaction monitoring (MRM), or selective reaction monitoring (SRM) are only now gaining ground. Quantitative immuno- and MS-based assays share common criteria that must be met; however, due to the nature of the different technologies there are certain caveats and challenges to both methods. These challenges will be addressed in this article.
2. Introduction
A challenge for biomarker verification/validation is cohort selection and the development of suitable platforms for verification/validation which must be both quantitative and have relatively high throughput as cohort sizes increase [10]. Traditionally, antibody-based immunoassays were used for biomarker verification/validation [11]. A singleplex immunoassay quantifies one analyte per assay and n analytes would require n independent assays. In comparison to the ELISA for a single analyte, multiplex assays offer the possibility of obtaining more reliable quantitative information in a highly parallel analysis [12, 13]. Reagent costs are substantially reduced, and many candidates can be evaluated simultaneously without depleting valuable patient specimens. In addition, quantitative multiplexed assays offer the possibility to identify combinations of biomarkers with higher disease specificity than any single established biomarker alone [14–17]. As mentioned, antibody-based assay [18] and the emerging MS technology of MRM/SRM [19, 20] can be used in the multiplexed format. Although the technology and instruments are completely different, the same bioanlytical method development and validation principles (such as FDA guideline) [21] should be applied. Figure 1 shows the principles for the antibody-based immunoassay and MS-based MRM.
Figure 1.
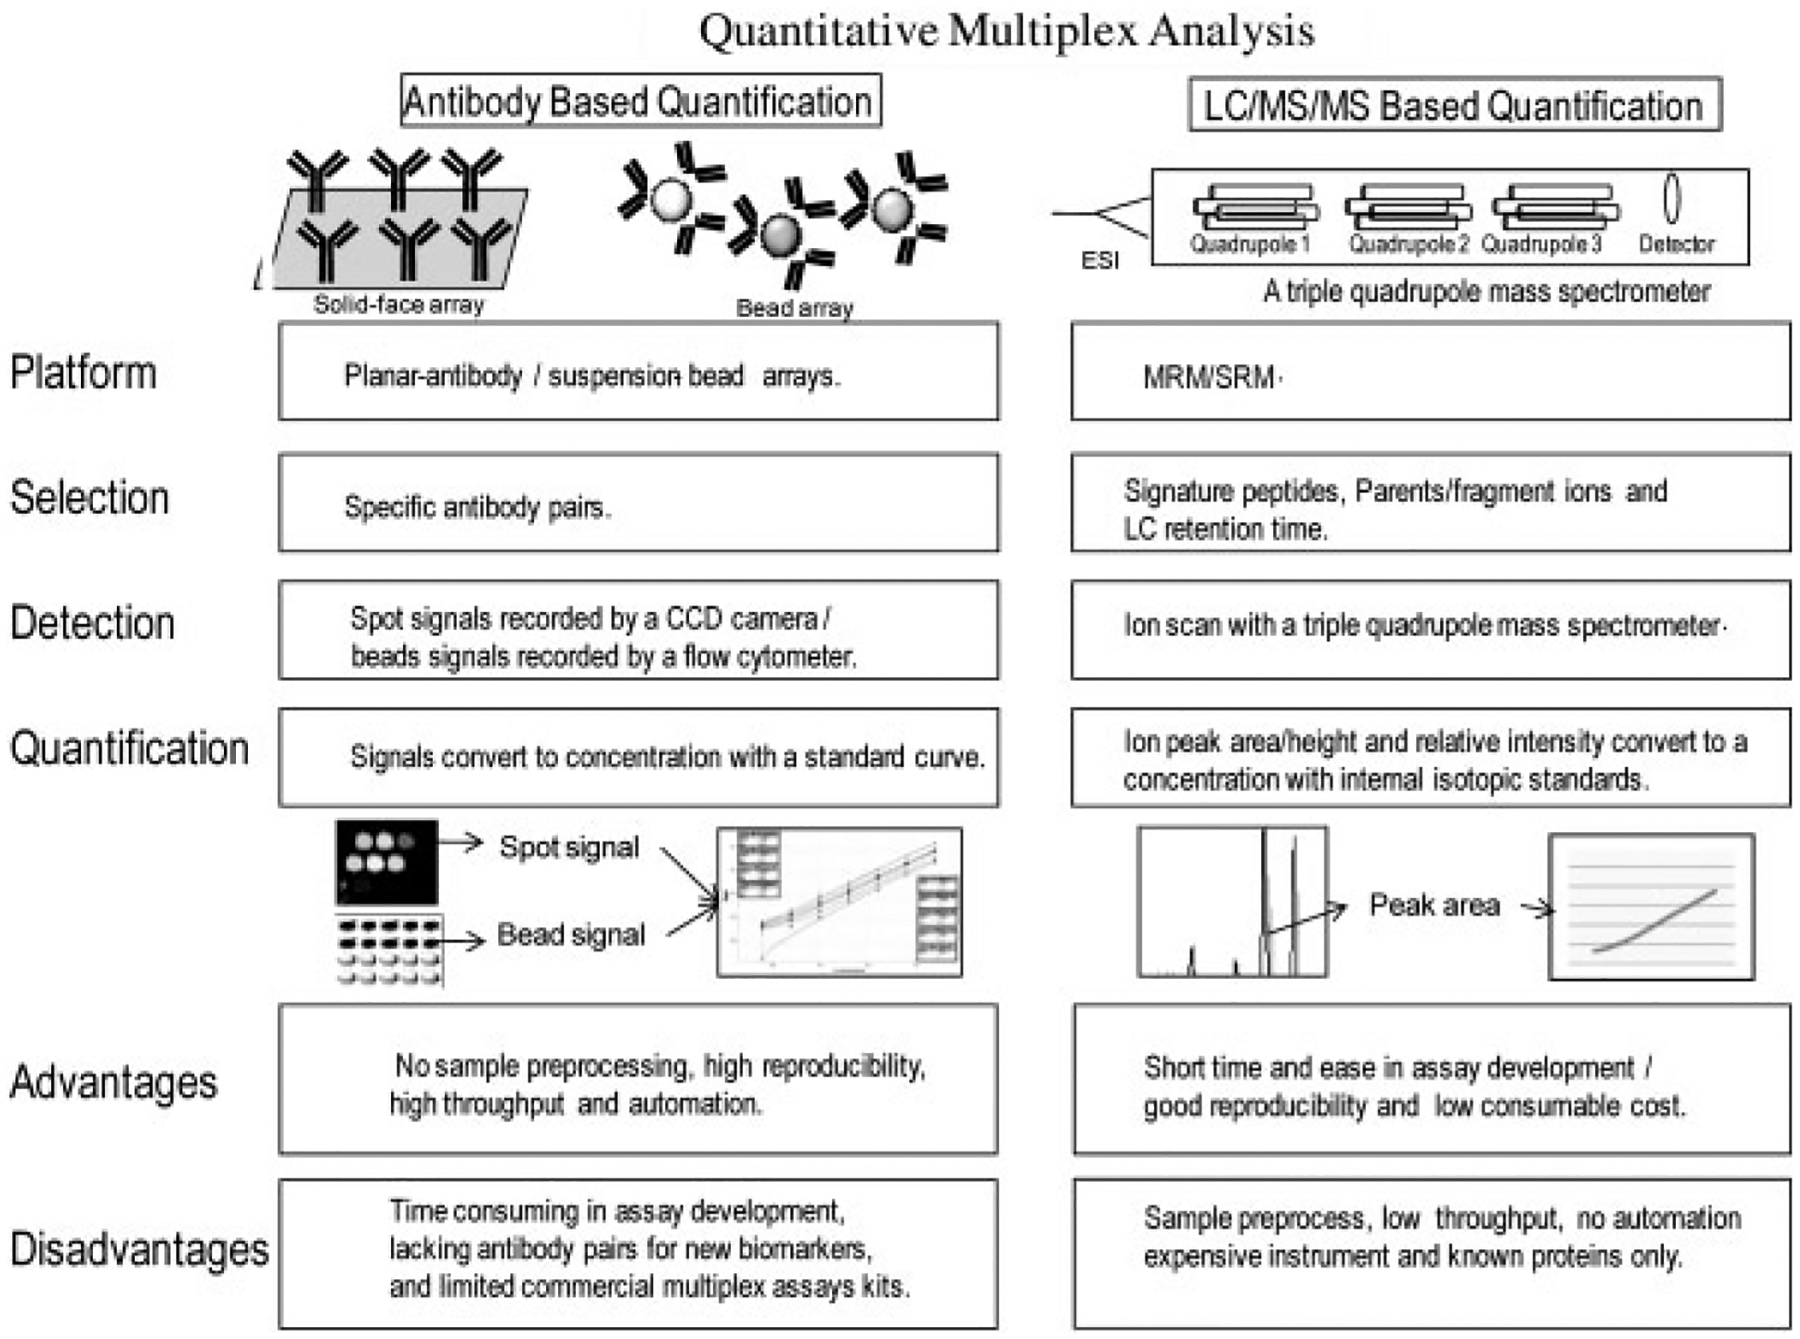
A schematic of comparison of two quantitative multiplex analysis approaches: antibody-based immunoassay and MS-based MRM. Advantages and disadvantages for both approaches are summarized and compared.
Antibody-based multiplexed assay (and commercial instruments and kits) have a relatively long history with over 15 years of development and optimization. However, most commercial multiplex assays are developed for research laboratories and nonclinical tests; only a limited number of multiplex assays are approved by FDA for clinical testing, e.g. the Triage Cardio ProfilER (www.Biosite.com) and Plexus EBV Multi-Analyte Diagnostics (Focus diagnostics/Quest diagnostics) [22]. The other platforms for commercial multiplex diagnostic tests include Luminex (www.luminex.com), Triage system (www.Biosite.com), Evidence (www.Randox.com), Vidas (www.biomerieux-diagnostics.com), Planner arrays (www.VBC-genomics), Whatman (www.whatman.com) and bead array (www.bioarrays.com) [23]. These quantitative multiplex immunoassays couple the basic principle of antigen-antibody interactions to a wide variety of detection methods giving quantitative readouts [24, 25]. Multiplex immunoassays can have reasonable sensitivity, reproducibility, a wide assay dynamic range (pg/mL to ng/mL), high throughput and robustness [26, 27]. The application of multiplex immunoassays to candidate biomarker verification is limited by the availability of good antibody pairs for each biomarker candidate, low cross reactivity, and the time and resources needed to develop multiplex assays [28].
Alternatively, an antibody-free technology for multiplex and quantitative analysis of biomarker candidates is MRM. MRM has been applied to pharmacokinetics, forensic science and toxicology for many years and is a well established research tool in pharmaceuticals. Today, clinical MRM assays are limited to small molecules such as metabolites [29, 30]. However, the accumulated, rich knowledge of MS-based quantitative analysis can be easily transferable to protein analysis as long as the instrumentation is adaptable for a clinical laboratory setting and the assays measure the analyte in question in an accurate, reproducible manner. One main advantage of MS-based analysis is that the technology could eliminate certain analytic interferences, such as nonspecific antibody binding in immunoassays and matrix effect of biofluids. This review will focus on basic assay principles and the development of multiplex assays used by translational and clinical scientists working on biomarker research.
3. Cohort, sample collection, analyte stability and controls
Cohort design is an important part of biomarker verification or validation. Considering the biological variation present within the human population, appropriate controls should be carefully selected for a well designed validation cohort. In addition, the sample type must be selected and a stringent collection protocol established prior to any validation study. Sample collection and processing must be compatible with the clinical setting, e.g. blood and other body fluids are often easier to obtain than tissue biopsies. Analytes need to be stable within the procurement and processing conditions.
The importance of pre-analytical factors that affect assay results should be stressed, and several recommendations have already been published [31]. There are analytical limitations due to choice of sample matrix and pre-analytical processing. Although many assays perform well with different blood collection tubes, one must take great care to choose the right one since the same assay in different matrices may yield different results. For example, measuring TGFβ levels in serum is possible but will not reflect the true circulating TGFβ levels due to ex vivo platelet activation [32]. Therefore, our lab as have others has invested time researching the effects of collection, processing, and handling conditions on the serum proteome. We found that most proteins retained their integrity when the clotting time was varied from 1 to 6 h, but a subset of sensitive proteins was degraded (Fig. 2).
Figure 2.

Blood from a healthy individual was collected with BD Vacutainer* plastic red top tubes and sat at room temperature for either 1 h or 3 h (clotting time). After centrifugation, serum was collected, aliquoted and stored at −80°C. Equal amounts of delipidated HSA/IgG-deleted serum proteins (150 μg) were loaded onto 18 cm IEF first-dimension gels, pH 4–7 IPG strip. The second-dimension SDS-PAGE was carried out with 10% polyacrymide Bis-Tris neutral gels. Following the second-dimension separation, gels were visualized by silver staining. Boxes (which appear to the right) show an expanded view of the indicated region on each gel.
Analytes must be stable during storage and throughout the multiplex assay process for reliable quantification [33]. The stability of an analyte depends on the sample matrix (plasma, serum, urine, etc.); biochemical properties of the analyte; collection method and sample handling prior to freezing; storage container; storage conditions (e.g. temperature); and the assay procedure (e.g. duration and temperature) [34]. Freeze/thaw stability can be assessed by analyzing two concentrations (low and high) of a sample in triplicate before and after three or more freeze/thaw cycles [35]. Storage stability can be assessed by analyzing two concentrations of a sample (low and high) in triplicate stored under the same condition (same tube and same freezer) to check for stability between the date of the first sample collection and the date of last sample analysis. Storage stability is difficult to assess as samples used for biomarker validation often come from pre-existing collections that have already been frozen. In-process sample stability can be assessed by QC samples (quality control) with known amount concentration of analytes that are assayed under the exact sample and assay processing conditions (sometimes samples have to be stored temporarily at room temperature or at 4°C due to the clinical sample collection or long assay protocols). If a reduction of signal is observed due to the degradation, protease inhibitors may be needed to prevent protein degradation.
4. Assay platform I: Antibody-based multiplex immmunoassays
The basic principle of immunoassay is an antibody sandwich assay: an analyte-specific antibody(ies) (either a monoclonal or anti-peptide polyclonal) captures analyte from the sample, and then a biotinylated secondary antibody binds to the captured analyte. A streptavidin conjugated enzyme binds to the secondary antibody, and a signal (color or light reaction) is produced when substrate is added. The light absorbance or intensity of this reaction product is detected [36]. The biotin-streptavidin type of enzyme-substrate reaction is the classical ELISA detection method although other detection technologies have been applied to immunoassays [37]. For example, the detection antibody (second antibody) can be labeled directly with a colorimetric, chemiluminescent, fluorescent, scanometric (metal nano-particles), or Raman tags (carbon nanotubes/surface-enhanced Raman scattering). Indirect detection methods can also be employed including the use of a conjugated anti-species third antibody [13, 27, 38–41]. Recent advances in nano-material have further revolutionized the conventional antibody array and antigen detection method by using label free optical signals (e.g. surface plasmon resonance imaging) or electrical signals (silicon nanowire-based system) [42, 43]. Regardless of the method of signal amplification, signals generated from samples should be within the linear range of the standard curve, and the amount of signal should be proportional to the quantity of secondary antibody bound. Absolute quantitative information is then extrapolated from a standard curve [11].
There are many choices of platform selection for immuno-based assays, but the most popular formats use either microbeads (in solution format) or a microspot array (in planar format) [44]. In addition to some commercial platforms (examples are listed in Table 1), newer multiplexed platforms are being commercialized which can be customized adding versatility. For example, Zeptosens (Bioanlytical Solution) is an ultrasensitive planar array with both forward phase array (antibody array up to 15 analytes) and reverse phase array (> 1000 tissue protein array). We have investigated the performance of various commercial multiplex immunoassay platforms. We found that optimal assay performance depends on proprietary information about the antibody pair, the composition of diluents, and the software [45]. Therefore, there is not a single assay platform suitable for all analytes. The selection of a platform or kit should depend on assay sensitivity, the relevant biological concentration to be measured, the number of samples needed to be tested, the stringency needed for test performance characteristics and budget. In addition to saving precious clinical sample volume, the nature of parallel analysis in multiplex assays offers additional advantages: (i) reduced sample freeze/thaw cycles; (ii) reduced demands on aliquoting and storage space; (iii) reduced demands on time, reagents and analytic error; and (iv) increased disease specificity if panels or pathways (with multiple proteins) are involved in particular diseases.
Table 1.
The characteristics of some commercial multiplex immunoassay platforms
| Characteristics | Planar microspot array | Suspension bead array | |||
|---|---|---|---|---|---|
| Platform | MesoScale discovery (MULTI-ARRAY/MULTI-SPOT) | Searchlight | FastQuant® (FAST Quant System) | Luminex | Cytometric Bead Array (CBA) |
| Capture antibody binding surface | Carbon (96/384 well microplate) | Plastic (96/384 well microplate) | Nitrocellulose (glass slide) | Fluorescently tagged beads (5mM) | Fluorescently labeled beads (and/or with two different sizes 4–5 mM) |
| Detection system | Electrochemilu-minescence (SULFO-TAG™ - detector) | Biotinylated detector (with streptavidin HRP conjugate or fluorescent DyLight 800 Fluor conjugate) | Biotinylated detector with fluorescent detection (with streptavidin-Cy5) | Biotinylated detector with fluorescent detection (streptavidin-Phycoerythrin conjugate) | Phycoerythrin conjugated detectors |
| Analytes/plex | Up to 10 | Up to 24 | Up to 10 | Up to 100 | Up to 100 |
| Image system | CCD camera based | CCD camera based | CCD camera based | Luminex xMAP based system | Flow cytometer with dual laser |
| Customized array | Yes | Yes | Yes | Yes | Yes |
| Kits for designing and building your own assay | Yes | No | No | Yes | Yes |
| Reagent company | MesoScale Discovery | Aushon Biosystem | Waterman Schleicher & Schuell BioScience | Luminex Corp and its partners (many others) | BD Becton, Dickinson and others |
| Commercial instrument | MesoScale Discovery | Aushon Biosystem | Waterman Schleicher & Schuell BioScience | Luminex (xMAP) and its partners | BD Becton, Dickinson and company |
5. Assay platform II: MS-based MRM analysis
SRM (also referred to as single reaction monitoring) analysis utilizes a triple quadrupole type of instrument to select and analyze a specific analyte (such as a peptide or a small molecule). In SRM analysis, the specificity depends on multiple mass analyzers (mass filters): the first quadrupole is to select the desired parent ion; the third quadrupole is to monitor the (one or more) fragment ion(s). The fragment ion(s) is generated through collisional induced dissociation in the second quadrupole. Therefore, SRM is a highly specific detection/monitoring method with low background interference. When multiple parent ions are monitored in a single MS run, this type of analysis is known as MRM. Using MRM analysis, multiple proteins and multiple regions (signature peptides) of a protein can be monitored in single MS run.
MRM is rapidly evolving as an alternative to multiplex immunoassays and is reproducible [46]. MRM eliminates the need for developing immunoassays for an analyte while providing absolute quantification for the specific protein(s) within complex protein mixtures such as serum or plasma [47–49]. Prior to MRM analysis, proteins present in biofluids (such as plasma or urine) are initially cleaved usually with an enzyme (typically trypsin) although chemical methods can also be used to generate a complex peptide mixture. The peptide mixture is often extracted with a solid phase (such as C18 chromatography) to remove any interference (such as salt) prior to applying to a LC system coupled to a mass spectrometer. In a recent report highlighting the utility of MRM, 53 plasma proteins were simultaneously monitored and quantified [47]. A Human Proteome Detection and Quantitation project has been proposed with the goal of developing quantitative MRM assays for proteins from each of the 20 000 human genes [50].
Table 2 compares antibody-based and MS-based methods for quantitative multiplex assays. Typically, a MRM analysis can detect and quantify high amol to fmol peptide concentrations; this converts at the protein level to a sensitivity of about 0.1–1 μg of protein/mL plasma/serum. This level of detection in the complex unfractionated plasma lies in the mid-abundance range [47]. To detect lower abundant proteins in a complex mixture there are two methods of protein-specific enrichment: protein enrichment by antibody capturing [51] or peptide enrichment after tryptic digestion with anti-peptide antibodies [52]. The peptide enrichment is also called SISCAPA (stable isotope standards and capture by anti-peptide antibody). Potentially, a multiplex of 10–100 analytes with concentrations of > 100 ng/mL or above can be measured in a single analytic MS run for plasma/serum. However, this becomes more complicated if enrichment is required. In a recent report, a combination of immunocapture and pre-fractionation prior to MRM was used to achieve sensitivity in the high pg/mL range [53]. Alternatively, fractionation based on chemical properties (e.g. SXC) or depletion of high abundant proteins can also be alternatively used.
Table 2.
The characteristics of quantitative multiplex assays
| Characteristics | Antibody-based | Mass spectrometry-based MRM |
|---|---|---|
| Principle | Antibody–antigen interaction | Signature protein/peptide ions scan |
| Required reagents/information | Specific antibody pairs | Protein sequences and signature peptide/fragment ions |
| Quantification basis | Detector response signals | The peak area of an ion scan |
| Instrument | CCD camera, flowcytometer and others | LC/MS/MS mass spectrometer (such as a triple quadrupole instrument) |
| Multiplexicity | 1–100 | 1–100 or higher |
| Clinical diagnostic test | Yes | Not yet |
| Sample enrichment | No | Yes (for low concentration analytes) |
| Sensitivity | > sub pg/mL–pg/mL | > 100 ng/mL (direct measurement) > high pg/mL–ng/mL (combine with antibody capture, depletion and/or prefractionation) |
| Reproducibility | Excellent | Good |
| Assay development | Time and resource demanding. | In-silico design and relative short time frame |
| Consumable | High demand | No or low demand |
| Robustness | Yes | Not Yet |
| Throughput | High | Low |
| Matrix effect | Yes | No |
| Sample manipulation | No | Yes |
| Automation | Yes | Not yet |
| History | > 15 years | > 5 years |
Even with this early work, MRM remains a largely untested technology both within the research and the clinical arena. Its adaptation to quantitative biomarker verification and validation will depend upon future developments that address the issues of throughput, automation and regulatory clearance [54]. Protein quantification by MRM most likely will be adapted to the clinical chemistry laboratory in the future, especially given that MS-based metabolites quantitation is already being used in the clinical chemistry laboratory. However, this will be driven by the development of MRM assays that address specific clinical needs which are not or cannot be addressed using an immunoassay. Thus, we do not expect MRM analysis to replace immunoassay; but rather, supplement immunoassays as the two technologies are complementary. For example, MRM analysis to assess proteins that are isoform or PTM-specific disease markers may be advantageous over immunoassays. With MRM, using isoform specific Q1/Q3, one group quantified members of terpene synthase family [55]. Another group used a combination of lectin and SISCAPA enrichment and quantified an aberrant glycoform of tissue inhibitor of metalloproteinase 1 at approximately 0.8 ng/mL in serum [56].
6. Assay performance characteristics for multiplex immunoassays and MRM
Assay performance involves two aspects: the ability of the assay to detect analytes in the sample and the technical performance of the platform. For immunoassays, factors that can influence the assay detection are antibody pairs, binding between antibody and capture surface (of beads or wells of microplate/glass slides), orientation of capture antibody on the binding surface, signal amplification, and range of signal linearity detection. In comparison to singleplex ELISA, there are more issues with respect to the cross-reactivity since multiple pairs of capture/detectors are mixed in a single reaction tube. Assay performance can be evaluated along several dimensions (Table 3). There are additional sources of variation: (i) biologic variation, e.g. time-dependent or individual differences; (ii) pre-analytical error, e.g. sample degradation or matrix heterogeneity; (iii) analytical error, as discussed in the following sections; and (iv) post-analytic error, e.g. data transcription errors. Each of these parameters can be analyzed using data from control experiments [57]. Usually, each assay platform has its own software, and results can be exported in various formats. The exported results generally include fluorescence signals, mean signals, signal CV, the concentration of standards, and the calculated (or observed) concentration [58].
Table 3.
Assay performance characteristics
| Reliability (Precision) |
|---|
| Validity |
| Accuracy |
| Specificity |
| Sensitivity |
| Lower limit of quantification |
| Lower limit of detection |
| Linearity |
| Range |
In general, there are two approaches in quantification of target proteins and their representative peptides in biological fluids using MRM: (i) absolute quantification with stable isotope labeled peptides as internal standards, and (ii) relative quantification with signal intensities of specific transitions (also known as label free quantification) [59]. In the first approach, the peptides are synthesized and labeled with a heavy isotope that will shift the mass of the peptide higher than the endogenous peptide, and a known quantity of this labeled peptide is spiked into the samples. After signal intensities of specific MRM transitions of both labeled peptides and matched endogenous peptides obtained, the quantification is achieved by comparing the relative intensity of samples with that of spiked isotopically labeled standard peptide. For label-free quantification, the quantification is based on relative intensities of specific MRM transitions. In all assays, each peptide and each analyte must perform in a reproducible and accurate manner.
6.1. Reliability (precision)
For end users, the bottom line is whether a particular kit and platform can provide reliable, reproducible, and quantitative results. Reliability, also termed precision, consistency or repeatability, is of paramount importance for any analytic method [60]. In a high-quality immunoassay, results from the analysis of a standard sample should not vary between different wells on the same plate, between different plates, or between assays conducted at different times or by different people. The CV (SD/mean) provides a measure of precision. A CV of 15% is considered acceptable [21, 60]. If a large set of samples is assayed over several days, inter-plate, intra-plate, inter-day and intra-day CVs should be evaluated and recorded to ensure the reliability of the assay. The inter-assay precision is also known as assay repeatability. It is typical to prepare and freeze multiple aliquots of one or more positive quality control samples and assay an aliquot of the positive control with each set of unknown samples. With this procedure, QC samples with an identical freeze/thaw cycle can be used to calculate the CV over time. Similarly, CV for inter-run of MRM should be establish as < 15% as acceptable for a pre-clinical study [21].
6.2. Specificity
Specificity refers to the ability of an assay to measure only the intended analytes in the presence of all assay components. In a singleplex immunoassay, the specificity is determined based on the lack of response using a “blank” matrix that includes all components but the analyte. It should be noted that cross-reactivity sometimes comes from the shared epitopes or similarity in protein conformation in antibody-based assay. In a multiplex immunoassay, additional tests are required to assess any possible cross-reactivity between each antibody and all other analytes and antibodies [61–63]. If the cross-reactivity is observed, the source of the reactivity (even if it is an antibody) must be replaced [64].
For MRM analysis, the specificity of the assay depends on ensuring that the peptide and the selected transitions are truly unique. To increase selectivity, often two or more peptides per protein are analyzed with two or more unique transitions per peptide [49]. Therefore, one needs to balance the time necessary for building and characterizing the multiplex with its benefits.
6.3. Accuracy
Accuracy refers to the closeness of test results from an assay to the true concentration of the analyte in the sample [65, 66]. Both systematic bias and random errors affect accuracy. Factors that contribute to systematic bias include sample matrix, the choice of analyte proteins as standards, the algorithm used to calculate the calibration curve, suboptimal reagents, poorly calibrated pipettes, liquid handling system, chromatography column/system and fluctuations in the assay environment, e.g. temperature and humidity. Random errors occurring during the assay procedure will affect both precision and accuracy. Accuracy can be assessed from repeated analysis of samples with analytes of known concentration in the same matrix as the unknown samples. According to the FDA, the measured value should be within 85–115% of the true value on average and within 80–120% of the true value at two extremes of high or low concentrations. Recovery or spike-recovery should use the same source of calibrator standard. Not all calibrator proteins sold by commercial sources meet all standards. In some cases, such as with cytokines, there are no universal standards that define how to quantify protein concentration [67–69].
For MRM, an advantage of absolute quantification is the precision due to minimization of effects of matrix, peptide sequence, variation from run to run and ionization efficiency. The disadvantage is cost. For label-free quantification, the advantage is eliminating the cost of synthesizing labeled peptide; the disadvantages are that matrix, ionization and other factors are not controlled, and normalization needs to be built into the analysis.
6.4. Recovery – spike/recovery
Recovery refers to the effect of the sample matrix on the detector response and is measured by comparing signals from the same concentration of analytes in a defined mixture of purified proteins with a biologic sample of complex composition. The recovery should be assessed over the dynamic range of the assay to define accuracy. For immunoassay, biological specimens with a known concentration of analytes are difficult to obtain. As an alternative, one can “spike” or add known concentrations of analytes to a biological sample with a low concentration of endogenous analytes and then calculate spiked recovery by subtracting a background reading from a neat sample with only endogenous analytes [70]. The ideal diluent for spike/recovery experiments is the same matrix as the sample. Sometimes, endogenous analyte levels in the sample matrix (serum, plasma or other body fluid) pose a problem, or it is difficult to obtain a large quantity to be used as diluents. In most cases, manufacturers provide diluents for samples, and they can be used for spike/recovery type of experiments. Spike/recovery data should be available from the manufacturer of a commercial assay, but spike/recovery experiments are worth repeating by the end user to assure accuracy for any new assay and sample type. The recovery is indicative of the presence or absence of interference in the sample. The serially diluted, spiked samples should be tested for linearity. As with determining accuracy of an assay, a CV of ± 15% over a range of dilutions is acceptable performance.
For MRM, recovery through each step will need to be closely monitored. This can be done by spiking in standards at the beginning of the analysis by using either chemically labeled peptides or proteins.
6.5. The limits of quantification
The sensitivity of an assay is described by its lower limit of detection (LLOD) and lower limit of quantification (LLOQ). LLOD, also referred to as the minimum detectable dose, is the lowest concentration of analyte in a biological sample that an assay can reliably differentiate from background. LLOQ is the lowest amount of an analyte that can be quantified reproducibly with acceptable precision and accuracy. In 2001, the FDA provided a specific definition for LLOQ in the publication “Guidance for Industry, Bioanalytic Method Validation” [21]. At the LLOQ an analyte can be reproducibly measured with a CV of < 20% and accuracy of 80–120% (according FDA guideline for pharmacology/toxicology study and preclinical studies).
The upper limit of quantification (ULOQ) is the maximum analyte concentration of a sample that can be quantified with acceptable precision and accuracy. Highly concentrated samples can be diluted before analysis, so the ULOQ does usually not limit the ultimate results of an analysis. All platforms should allow for easy access to raw and analyzed data, straightforward export to commonly used software, and it should allow for easy summarization of those parameters that determine accuracy and reliability of the assay such as CVs and recovery. Figure 3 demonstrates the importance of LLOQ/ULOQ and spike recovery in obtaining reliable quantitative results in a multiplex immunoassay.
Figure 3.

A standard curve of IL-6 was generated with a luminex bead array plateform (Bio-Plex human 9-Plex kit, GM-CSF, IFN-g, IL-1β, IL-2, IL-6, IL-8, IL-10, IL-12p70, TNF-α from Bio-Rad). The standard 9 cytokine mixture was obtained from Bio-Rad and a 9-point standard curve was established through a 1:4 serial dilution with the diluent supplied. The actual and expected concentrations of IL-6 were calculated, and then % recovery (observed concentration/expected concentration × 100) was calculated. The Quantifiable range is defined by a concentration range where CV was < 15% and % recovery was < 100 ± 20% from standard calibrators. It should be noted that LLOQ and LOD are not overlapping. LLOQ was defined by % recovery.
6.6. Diluents and sample buffer
Diluent refers to the solution which is used for serial dilution of the protein standard to establish a calibration curve, as well as the dilution of samples with concentrations above the ULOQ. The composition of the diluent is an important but often overlooked factor that can affect reliability and accuracy [71, 72]. The ideal diluent should resemble the sample matrix yet not affect the detector response. Diluents are optimized to maximize specific binding and detection, minimize nonspecific binding and interference, and mimic the sample matrix for the dilution of calibrators and samples. In addition, serum and plasma contain high levels of protein, including complement factors and immunoglobulin, which can affect quantitation. Recipes for diluents are most often proprietary information. A well-developed and validated commercial platform often has different diluents for different sample types and analytes. Alternatively, an in-house diluent can be used, provided its performance has been tested. Large differences in signals were observed when we compared 1% BSA as diluent and cytokine diluents supplied by the vendor (Fig. 4). Lower signals are observed using serum diluent due to interference from serum matrix, but may more accurately reflect the actual result.
Figure 4.

Sample matrix affects assay performance. Standard curves of fourfold serial dilutions of purified human glial fibrillary acidic protein in 1% BSA in PBS (▲) or serum cytokine assay diluent (●) from MesoScale Discovery were analyzed using a MesoScale Discovery platform. Plates coated with monoclonal capture antibody (SMI-26, Covance, Denver, PA, USA) at 100 ng per well in PBS. Polyclonal anti-GFAP (Dako, Carpinteria, CA, USA) was used for GFAP detection.
Among the many advantages of MRM is that there is no need to find the perfect recipe for sample and standard diluents because the sample matrix has minimal effects on quantitation due to fractionation prior to MS [73].
6.7. Calibration – standard curve
A calibration curve plots the relationship between the assay signal (detector response) and the concentration of standard analytes [74]. Eight serial dilution points (including the blank) are used to calibrate most plate-based commercially available multiplex immunoassays. The data are usually fit with an equation using a four-parameter log-log transformation algorithm. For each assay, it is important to check the fit of the curve by back-fitting the signals of the standards as unknowns. A recovery of 80–120% is acceptable. If the recovery is out of this range, inaccuracies can be expected when the sample concentrations are calculated. Inaccuracies are typically most significant at the extreme (lower and upper) ends of the calibration curve. Prior to committing to a particular multiplex assay for a large project, one must have a clearly defined LLOQ and ULOQ and know the range of reliable quantification range for the assay of choice. Defining one’s own LLOQ and ULOQ values is the first step in getting accurate and reliable quantitative results [65, 75, 76]. Each multiplex assay platform has its own definition of LLOD, and many have not implemented the FDA definitions of LLOQ and ULOQ. Several platforms allow users to define the LLOQ according to their own requirements. Many platforms require users to remove or flag values which are not reliably quantified due to low precision and accuracy. It is important for users to know that the calculated concentrations are based upon mathematic interpolation and often include scientifically unacceptable results. One must be careful to differentiate between the LLOD and LLOQ. For some low concentration analytes, small changes in the LLOQ may have significant effects on the amount of data that cannot be reliably quantitated. If a large set of samples are assayed over multiple days, it is important for users to track individual plate LLOQ over the entire assay period. Then, a single LLOQ is defined. One strategy is to choose the highest LLOQ value over entire project to ensure reliability. Values below this LLOQ are flagged or removed from subsequent analysis. It is important to remember that the ULOQ, LLOQ and LOD should be determined in the same multiplex fashion as the samples will be analyzed.
For MRM analysis, due to the potential matrix interference, it is important to use same sample matrix (e.g. plasma or urine digested with trypsin) in establishing LOQ and LOD with labeled peptides [77, 78].
Since most researchers will perform their experiments over a period of time using multiple runs, a system has to be implemented that can determine if results from different runs are comparable. Therefore, minimizing day to day variation of the assay and sample becomes important. A low-cost and effective method is to store a large amount of the matrix of choice, into single use aliquots which can serve as an internal standard throughout many experiments. This adequately determines inter-assay variability and verifies results from several independent runs.
7. Approaches to assay development
7.1. Immunoassay development
In general, assay development is quite cost and labor intensive and should only be considered if there is a real need. We consider immunoassay development in two situations: (i) there is no ELISA kit or compatible antibody pair available for the analyte in question or (ii) we expect to assay > 500 samples over a longer period of time and there is a need for a more standardized platform. Whereas assay development from scratch can be difficult, converting an existing ELISA assays into a multiplex is quite feasible, although considerable time is still required.
Successful assay development depends largely on the quality of the available antibodies. If possible, antibodies that have already been tested in different orientations as capture and/or detection antibodies by the vendor should be preferred. As an example, we describe assay development with MSD platform (96 wells):
Capture antibodies are mounted on a blank plate and different concentrations of capture and detection antibodies are tested. Blocking reagents should be tested as well.
Different diluents are tested to optimize the assay for relevant sample matrices, e.g. human plasma.
The assay characteristics in Table 3 are assessed. Specifically, known amounts of the analytes are spiked-in and assayed to ensure reliable quantitation across samples.
For multiplexing, the capture antibodies tested in singleplex are bound to chemical linkers through amine reactive N-hydroxysucciminide esters. These linkers bind to their counterpart on a specific spot on a 96-well plate. Each different capture antibody is bound to a different, individual spot and therefore creates a first multiplex assay.
The multiplex assay now must be tested again for all assay characteristics listed in Table 3, specifically for specificity and spike-recovery.
Spike-recovery should be evaluated over the anticipated concentration range using a serial dilution of known concentration control protein with the diluents of choice and performed in parallel.
Of course, combining analytes places limitations on relative abundance (all should be within 2 logs), and analytes must be compatible with the same pre-analytical treatment, (e.g. dilution or storage steps). If the multiplex works well, one can either run all assays using this technology or, in order to achieve industry-grade quality and open up the possibility for high-throughput analysis, work with the platform manufacturer to develop commercially produced assays, e.g. multiplex plates that are robotically printed. This will further reduce variability between different runs since the assay development is similar to that of a commercially available assay. Once a test is established, 80–120 samples per day can be analyzed by a single person using a semi-automated environment (plate-washer, electronic multichannel pipette, etc.) with higher numbers of samples as more automated processes are used, approaching volumes of samples tested in the clinical laboratory setting.
7.2. MRM assay development
MS peak based quantification is a long established technology in pharmaceutical industries for measuring small molecular dugs and metabolites. In last 2 years, LC-MS has been optimized for the measurement of larger molecules, including peptides. The biggest advantage of MS-based peptide quantification is the robustness (with relative short time frame and ease) in multiplex assay development. In addition, MRM can also quantify specific PTMs or isoforms [49], which are very difficult to do in antibody-based quantification methodology. As well, the digested proteins/peptides are separated by reverse phase chromatography under the denaturing condition, and matrix effect is minimized.
For immunoassays, the sensitivity depends on antibody pair binding, signal amplification, and detection methodology. For MS-based quantitation, the peptide sequence, sample process and analysis method directly affect the sensitivity. In addition, in immunoassay, the cross-reactivity is a big issue and it is a time-consuming process in testing/eliminating cross-reactivity for multiplex immunoassay development. A major advantage of multiplex MRM based quantification over multiplex immunoassays is the relatively short time frame, low cost and ease in developing the multiplex MRM assay. The analytes can be multiplexed together due to their signature peptide ion (Q1), different retention time of each unique peptide and unique transitions (Q3). The key, however, is that sufficient MS data is obtained to ensure the correct peptide is being quantified and that each peptide is unique for a protein.
The successful multiplex MRM development relies on following factors (Fig. 5):
Selection of representative peptides based on targeted protein amino acid sequence. The selected peptides can include a PTM or isoform specific sequence and also be unique for the targeted proteins.
Selection of representative peptides (MS) and their transitions based on observability and intensity in a LC-MS run with a triple quadrupole MS.
Optimization/validation and multiplexing transitions of representative peptides. Parameters to be optimized include detection of the parent peptide and its fragments ions, the ion scan intensity and m/z ratios, the associated collision energy, and the chromatographic elution time.
Quantification of representative peptides of targeted proteins. The quantitation can be achieved by “label free” (relative quantitation based on signal intensity) and “isotope labeled” (absolute quantitation based on stable isotope labeled peptides standards). Sample normalization is necessary to obtain reliable results.
Figure 5.

The schematic illustrates the major steps in MRM assay development with a Sciex Q 4000 TRAP™ linear ion trap mass spectrometer. The first step is to design signature peptides (precursor ion for Q1) for proteins of interest. The peptide sequence can be selected through a LC-MS/MS experiment or through in silico design. The second step is to test the predefined transitions (Q1/Q3 pairs) and retention times, and peptide parent ion’s identity is confirmed by a full-scan precursor ion MS/MS. If an absolute quantitation is needed, the isotopically labeled signature peptide should be synthesized and used as internal standard. The third step is to optimize and multiplex the desired MRM assay. The fourth step is to quantitate the peak area of selected fragment ion and establish LOQ and LOD.
The quantity of sample required for MRM, sample recovery during pre-process steps, assay sensitivity and dynamic range, and reproducibility need to be determined. The inter- and intra-CV% of LC-MS MRM runs should be assessed. Similarly, the same FDA guidance should be followed [21].
8. Concluding remarks
Before embarking on the expensive and laborious task of developing multiplexing biomarker assays, one should critically evaluate candidate markers and make sure that an acceptable quantitative assay of the analyte in question is not currently available commercially. Multiplexing should be necessary to answer an important question. “Profiling” is not a good reason to start developing a new assay. One should take advantage of the scientific support from the companies that offer assay development but at the same time keep in mind that one must independently judge if the expected results justify the cost and labor of assay development. In conclusion, multiplex assays are a great tool in translational research but only if driven by a real clinical need for targeted biomarker discovery and verification/validation.
Acknowledgments
Jennifer Van Eyk’s work is supported by the National Heart Lung Blood Institute Proteomic Initiative (contract N01-HV-28,120), the SCCOR program (Specialized Centers of Clinically Oriented Research, grant 1 P50 HL 084,946-01), the Clinical Translational Science Award (#1U54RR023561-01A1) and by the Daniel P. Amos Foundation. Florian Schoenhoff is supported by the Novartis Research Foundation, the Swiss National Science Foundation (#PBSKP3-124604) and the intramural research grant program from the Department of Cardiovascular Surgery, University of Berne. William Savage acknowledges support from the Johns Hopkins Clinical Hematology Development Program 5K12HL087169-04, the NHLBI Proteomics and Genomics Hands-on Workshop 5T15HL086386-04, and the American Society of Hematology Clinical Research Training Institute. Jennifer Van Eyk, Qin Fu, Florian Schoenhoff and Pingbo Zhang are supported by the National Institutes of Health’s Challenge Grants in Health and Science Research as part of the AARA (#1 RC1 HL100021-01).
Abbreviations:
- MRM
multiple reaction monitoring
- LLOD
lower LOD
- LLOQ
lower LOQ
- SRM
selected reaction monitoring
- ULOQ
upper LOQ
Footnotes
The authors have declared no conflict of interests.
References
- [1].Schoenhoff FS, Fu Q, Van Eyk JE, Cardiovascular proteomics: implications for clinical applications. Clin. Lab. Med 2009, 29, 87–99. [DOI] [PMC free article] [PubMed] [Google Scholar]
- [2].Barrett JC, Bennett LM, Fleming LK, Linehan WM et al. , Linking laboratory and clinical research: the development of molecularly targeted therapeutics inside the national cancer institute center for cancer research. Clin. Adv. Hematol. Oncol 2003, 1, 302–306. [PubMed] [Google Scholar]
- [3].Pollock BG, Biomarkers: from bedside to bench and back again. Am. J. Geriatr. Psychiatry 2002, 10, 644–645. [PubMed] [Google Scholar]
- [4].Moore RG, Maclaughlan S, Bast RC Jr Current state of biomarker development for clinical application in epithelial ovarian cancer. Gynecol. Oncol 2009. [DOI] [PMC free article] [PubMed] [Google Scholar]
- [5].Anderson L, Candidate-based proteomics in the search for biomarkers of cardiovascular disease. J. Physiol 2005, 563, 23–60. [DOI] [PMC free article] [PubMed] [Google Scholar]
- [6].Fu Q, Van Eyk JE, Proteomics and heart disease: identifying biomarkers of clinical utility. Expert Rev. Proteomics 2006, 3, 237–249. [DOI] [PubMed] [Google Scholar]
- [7].Gerszten RE, Accurso F, Bernard GR, Caprioli RM et al. , Challenges in translating plasma proteomics from bench to bedside: update from the NHLBI Clinical Proteomics Programs. Am. J. Physiol. Lung Cell. Mol. Physiol 2008, 295, L16–22. [DOI] [PMC free article] [PubMed] [Google Scholar]
- [8].Apweiler R, Aslanidis C, Deufel T, Gerstner A et al. , Approaching clinical proteomics: current state and future fields of application in fluid proteomics. Clin. Chem. Lab. Med 2009, 47, 724–744. [DOI] [PubMed] [Google Scholar]
- [9].Rifai N, Gerszten RE, Biomarker discovery and validation. Clin. Chem 2006, 52, 1635–1637. [DOI] [PubMed] [Google Scholar]
- [10].Zolg JW, Langen H, How industry is approaching the search for new diagnostic markers and biomarkers. Mol. Cell. Proteomics 2004, 3, 345–354. [DOI] [PubMed] [Google Scholar]
- [11].Price C, Newman D, Principles and Practices of Immunoassays. Stockton Press, New York: 1997. [Google Scholar]
- [12].Kingsmore SF, Multiplexed protein measurement: technologies and applications of protein and antibody arrays. Nat. Rev. Drug Discov 2006, 5, 310–320. [DOI] [PMC free article] [PubMed] [Google Scholar]
- [13].Schweitzer B, Roberts S, Grimwade B, Shao W et al. , Multiplexed protein profiling on microarrays by rolling-circle amplification. Nat. Biotechnol 2002, 20, 359–365. [DOI] [PMC free article] [PubMed] [Google Scholar]
- [14].Kingsmore SF, Kennedy N, Halliday HL, Van Velkinburgh JC et al. , Identification of diagnostic biomarkers for infection in premature neonates. Mol. Cell. Proteomics 2008, 7, 1863–1875. [DOI] [PMC free article] [PubMed] [Google Scholar]
- [15].Fritzler MJ, Advances and applications of multiplexed diagnostic technologies in autoimmune diseases. Lupus 2006, 15, 422–427. [DOI] [PubMed] [Google Scholar]
- [16].Hadd AG, Brown JT, Andruss BF, Ye F, WalkerPeach CR, Adoption of array technologies into the clinical laboratory. Expert Rev. Mol. Diagn 2005, 5, 409–420. [DOI] [PubMed] [Google Scholar]
- [17].Utz PJ, Multiplexed assays for identification of biomarkers and surrogate markers in systemic lupus erythematosus. Lupus 2004, 13, 304–311. [DOI] [PubMed] [Google Scholar]
- [18].Barry R, Soloviev M, Quantitative protein profiling using antibody arrays. Proteomics 2004, 4, 3717–3726. [DOI] [PubMed] [Google Scholar]
- [19].Paoletti AC, Washburn MP, Quantitation in proteomic experiments utilizing mass spectrometry. Biotechnol. Genet. Eng. Rev 2006, 22, 1–19. [DOI] [PubMed] [Google Scholar]
- [20].Schiess R, Wollscheid B, Aebersold R, Targeted proteomic strategy for clinical biomarker discovery. Mol. Oncol 2009, 3, 33–44. [DOI] [PMC free article] [PubMed] [Google Scholar]
- [21].US Department of Health and Human Services Food and Drug Administration Center for Drug Evaluation and Research (CDER) Center for Veterinary Medicine (CVM), Guidance for Industry Bioanalytical Method Validation, 2001.
- [22].Apple FS, Jaffe AS, Bedside multimarker testing for risk stratification in chest pain units: The chest pain evaluation by creatine kinase-MB, myoglobin, and troponin I (CHECKMATE) study. Circulation 2001, 104, E125–E126. [PubMed] [Google Scholar]
- [23].Hartmann M, Roeraade J, Stoll D, Templin MF, Joos TO, Protein microarrays for diagnostic assays. Anal. Bioanal. Chem 2009, 393, 1407–1416. [DOI] [PubMed] [Google Scholar]
- [24].Zangar RC, Daly DS, White AM, ELISA microarray technology as a high-throughput system for cancer biomarker validation. Expert Rev. Proteomics 2006, 3, 37–44. [DOI] [PubMed] [Google Scholar]
- [25].Ling MM, Ricks C, Lea P, Multiplexing molecular diagnostics and immunoassays using emerging microarray technologies. Expert Rev. Mol. Diagn 2007, 7, 87–98. [DOI] [PubMed] [Google Scholar]
- [26].Ellington AA, Kullo IJ, Bailey KR, Klee GG, Measurement and quality control issues in multiplex protein assays: a case study. Clin. Chem 2009, 55, 1092–1099. [DOI] [PMC free article] [PubMed] [Google Scholar]
- [27].Nielsen UB, Geierstanger BH, Multiplexed sandwich assays in microarray format. J. Immunol. Methods 2004, 290, 107–120. [DOI] [PubMed] [Google Scholar]
- [28].Dupuy AM, Lehmann S, Cristol JP, Protein biochip systems for the clinical laboratory. Clin. Chem. Lab. Med 2005, 43, 1291–1302. [DOI] [PubMed] [Google Scholar]
- [29].Bakhtiar R, Majumdar TK, Tracking problems and possible solutions in the quantitative determination of small molecule drugs and metabolites in biological fluids using liquid chromatography-mass spectrometry. J. Pharmacol. Toxicol. Methods 2007, 55, 262–278. [DOI] [PubMed] [Google Scholar]
- [30].Feng WY, Mass spectrometry in drug discovery: a current review. Curr. Drug Discov. Technol 2004, 1, 295–312. [DOI] [PubMed] [Google Scholar]
- [31].Rai AJ, Gelfand CA, Haywood BC, Warunek DJ et al. , HUPO Plasma Proteome Project specimen collection and handling: towards the standardization of parameters for plasma proteome samples. Proteomics 2005, 5, 3262–3277. [DOI] [PubMed] [Google Scholar]
- [32].Roussy Y, Bertrand Duchesne MP, Gagnon G, Activation of human platelet-rich plasmas: effect on growth factors release, cell division and in vivo bone formation. Clin. Oral Implants Res 2007, 18, 639–648. [DOI] [PubMed] [Google Scholar]
- [33].Peakman TC, Elliott P, The UK Biobank sample handling and storage validation studies. Int. J. Epidemiol 2008, 37, i2–6. [DOI] [PubMed] [Google Scholar]
- [34].Elliott P, Peakman TC, UK Biobank, The UK Biobank sample handling and storage protocol for the collection, processing and archiving of human blood and urine. Int. J. Epidemiol 2008, 37, 234–244. [DOI] [PubMed] [Google Scholar]
- [35].Hartweg J, Gunter M, Perera R, Farmer A et al. , Stability of soluble adhesion molecules, selectins, and C-reactive protein at various temperatures: implications for epidemiological and large-scale clinical studies. Clin. Chem 2007, 53, 1858–1860. [DOI] [PubMed] [Google Scholar]
- [36].Diamandis EP, Christopoulos TK, The biotin-(strept)avidin system: principles and applications in biotechnology. Clin. Chem 1991, 37, 625–636. [PubMed] [Google Scholar]
- [37].Giljohann DA, Mirkin CA, Drivers of biodiagnostic development. Nature 2009, 462, 461–464. [DOI] [PMC free article] [PubMed] [Google Scholar]
- [38].Krishhan VV, Khan IH, Luciw PA, Multiplexed microbead immunoassays by flow cytometry for molecular profiling: Basic concepts and proteomics applications. Crit. Rev. Biotechnol 2009, 29, 29–43. [DOI] [PubMed] [Google Scholar]
- [39].Kersten B, Wanker EE, Hoheisel JD, Angenendt P, Multiplex approaches in protein microarray technology. Expert Rev. Proteomics 2005, 2, 499–510. [DOI] [PubMed] [Google Scholar]
- [40].Kim D, Daniel WL, Mirkin CA, Microarray-based multiplexed scanometric immunoassay for protein cancer markers using gold nanoparticle probes. Anal. Chem 2009, 81, 9183–9187. [DOI] [PMC free article] [PubMed] [Google Scholar]
- [41].Chen Z, Tabakman SM, Goodwin AP, Kattah MG et al. , Protein microarrays with carbon nanotubes as multicolor Raman labels. Nat. Biotechnol 2008, 26, 1285–1292. [DOI] [PubMed] [Google Scholar]
- [42].Lee HJ, Nedelkov D, Corn RM, Surface plasmon resonance imaging measurements of antibody arrays for the multiplexed detection of low molecular weight protein biomarkers. Anal. Chem 2006, 78, 6504–6510. [DOI] [PubMed] [Google Scholar]
- [43].Patolsky F, Zheng G, Lieber CM, Fabrication of silicon nanowire devices for ultrasensitive, label-free, real-time detection of biological and chemical species. Nat. Protoc 2006, 1, 1711–1724. [DOI] [PubMed] [Google Scholar]
- [44].Oliver KG, Kettman JR, Fulton RJ, Multiplexed analysis of human cytokines by use of the FlowMetrix system. Clin. Chem 1998, 44, 2057–2060. [PubMed] [Google Scholar]
- [45].Fu Q, Zhu J, Van Eyk J, Comparison of multiplex immunoassay platforms. Clin. Chem 2009, In press. [DOI] [PMC free article] [PubMed] [Google Scholar]
- [46].Addona TA, Abbatiello SE, Schilling B, Skates SJ et al. , Multi-site assessment of the precision and reproducibility of multiple reaction monitoring-based measurements of proteins in plasma. Nat. Biotechnol 2009, 27, 633–641. [DOI] [PMC free article] [PubMed] [Google Scholar]
- [47].Anderson L, Hunter CL, Quantitative mass spectrometric multiple reaction monitoring assays for major plasma proteins. Mol. Cell. Proteomics 2006, 5, 573–588. [DOI] [PubMed] [Google Scholar]
- [48].Kitteringham NR, Jenkins RE, Lane CS, Elliott VL, Park BK, Multiple reaction monitoring for quantitative biomarker analysis in proteomics and metabolomics. J. Chromatogr. B Analyt. Technol. Biomed. Life. Sci 2009, 877, 1229–1239. [DOI] [PubMed] [Google Scholar]
- [49].Lange V, Picotti P, Domon B, Aebersold R, Selected reaction monitoring for quantitative proteomics: a tutorial. Mol. Syst. Biol 2008, 4, 222. [DOI] [PMC free article] [PubMed] [Google Scholar]
- [50].Anderson NL, Anderson NG, Pearson TW, Borchers CH et al. , A human proteome detection and quantitation project. Mol. Cell. Proteomics 2009, 8, 883–886. [DOI] [PMC free article] [PubMed] [Google Scholar]
- [51].Kuzyk MA, Smith D, Yang J, Cross TJ et al. , Multiple reaction monitoring-based, multiplexed, absolute quantitation of 45 proteins in human plasma. Mol. Cell. Proteomics 2009, 8, 1860–1877. [DOI] [PMC free article] [PubMed] [Google Scholar]
- [52].Anderson NL, Anderson NG, Haines LR, Hardie DB et al. , Mass spectrometric quantitation of peptides and proteins using Stable Isotope Standards and Capture by Anti-Peptide Antibodies (SISCAPA). J. Proteome Res 2004, 3, 235–244. [DOI] [PubMed] [Google Scholar]
- [53].Kuhn E, Addona T, Keshishian H, Burgess M et al. , Developing multiplexed assays for troponin I and interleukin-33 in plasma by peptide immunoaffinity enrichment and targeted mass spectrometry. Clin. Chem 2009, 55, 1108–1117. [DOI] [PMC free article] [PubMed] [Google Scholar]
- [54].Diamandis EP, Hanash S, Lopez M, Carr S, Petricoin EF 3rd., Protein quantification by mass spectrometry: is it ready for prime time? Clin. Chem 2009, 55, 1427–1430. [DOI] [PubMed] [Google Scholar]
- [55].Zulak KG, Lippert DN, Kuzyk MA, Domanski D et al. , Targeted proteomics using selected reaction monitoring reveals the induction of specific terpene synthases in a multi-level study of methyl jasmonate-treated Norway spruce (Picea abies). Plant J. 2009, 60, 1015–1030. [DOI] [PubMed] [Google Scholar]
- [56].Ahn YH, Lee JY, Lee JY, Kim YS et al. , Quantitative analysis of an aberrant glycoform of TIMP1 from colon cancer serum by L-PHA-enrichment and SISCAPA with MRM mass spectrometry. J. Proteome Res 2009, 8, 4216–4224. [DOI] [PubMed] [Google Scholar]
- [57].DeKeyser FG, Pugh LC, Assessment of the reliability and validity of biochemical measures. Nurs. Res 1990, 39, 314–317. [PubMed] [Google Scholar]
- [58].Findlay JW, Smith WC, Lee JW, Nordblom GD et al. , Validation of immunoassays for bioanalysis: a pharmaceutical industry perspective. J. Pharm. Biomed. Anal 2000, 21, 1249–1273. [DOI] [PubMed] [Google Scholar]
- [59].Yocum AK, Chinnaiyan AM, Current affairs in quantitative targeted proteomics: multiple reaction monitoring-mass spectrometry. Brief Funct. Genomic Proteomic 2009, 8, 145–157. [DOI] [PMC free article] [PubMed] [Google Scholar]
- [60].Braggio S, Barnaby RJ, Grossi P, Cugola M, A strategy for validation of bioanalytical methods. J. Pharm. Biomed. Anal 1996, 14, 375–388. [DOI] [PubMed] [Google Scholar]
- [61].Perlee L, Christiansen J, Dondero R, Grimwade B et al. , Development and standardization of multiplexed antibody microarrays for use in quantitative proteomics. Proteome Sci. 2004, 2, 9. [DOI] [PMC free article] [PubMed] [Google Scholar]
- [62].Gonzalez RM, Seurynck-Servoss SL, Crowley SA, Brown M et al. , Development and validation of sandwich ELISA microarrays with minimal assay interference. J. Proteome Res 2008, 7, 2406–2414. [DOI] [PubMed] [Google Scholar]
- [63].Marchese RD, Puchalski D, Miller P, Antonello J et al. , Optimization and validation of a multiplex, electrochemiluminescence-based detection assay for the quantitation of immunoglobulin G serotype-specific anti-pneumococcal antibodies in human serum. Clin. Vaccine Immunol 2009, 16, 387–396. [DOI] [PMC free article] [PubMed] [Google Scholar]
- [64].Schwenk JM, Lindberg J, Sundberg M, Uhlen M, Nilsson P, Determination of binding specificities in highly multiplexed bead-based assays for antibody proteomics. Mol. Cell. Proteomics 2007, 6, 125–132. [DOI] [PubMed] [Google Scholar]
- [65].Shah VP, Midha KK, Findlay JW, Hill HM et al. , Bioanalytical method validation--a revisit with a decade of progress. Pharm. Res 2000, 17, 1551–1557. [DOI] [PubMed] [Google Scholar]
- [66].Karnes HT, Shiu G, Shah VP, Validation of bioanalytical methods. Pharm. Res 1991, 8, 421–426. [DOI] [PubMed] [Google Scholar]
- [67].Tsang ML, Weatherbee JA, Cytokine assays and their limitations. Aliment. Pharmacol. Ther 1996, 10, 55–61; discussion 62. [DOI] [PubMed] [Google Scholar]
- [68].Wadhwa M, Thorpe R, Standardization and calibration of cytokine immunoassays: meeting report and recommendations. Cytokine 1997, 9, 791–793. [DOI] [PubMed] [Google Scholar]
- [69].de Kossodo S, Houba V, Grau GE, Assaying tumor necrosis factor concentrations in human serum. A WHO International Collaborative study. J. Immunol. Methods 1995, 182, 107–114. [DOI] [PubMed] [Google Scholar]
- [70].Dadgar D, Burnett PE, Choc MG, Gallicano K, Hooper JW, Application issues in bioanalytical method validation, sample analysis and data reporting. J. Pharm. Biomed. Anal 1995, 13, 89–97. [DOI] [PubMed] [Google Scholar]
- [71].Pfleger C, Schloot N, ter Veld F, Effect of serum content and diluent selection on assay sensitivity and signal intensity in multiplex bead-based immunoassays. J. Immunol. Methods 2008, 329, 214–218. [DOI] [PubMed] [Google Scholar]
- [72].de Jager W, Bourcier K, Rijkers GT, Prakken BJ, Seyfert-Margolis V, Prerequisites for cytokine measurements in clinical trials with multiplex immunoassays. BMC Immunol. 2009, 10, 52. [DOI] [PMC free article] [PubMed] [Google Scholar]
- [73].Kim K, Kim Y, Preparing multiple-reaction monitoring for quantitative clinical proteomics. Expert Rev. Proteomics 2009, 6, 225–229. [DOI] [PubMed] [Google Scholar]
- [74].Rodbard D, Frazier GR, Statistical analysis of radioligand assay data. Methods Enzymol. 1975, 37 (Pt B), 3–22. [DOI] [PubMed] [Google Scholar]
- [75].Dudley RA, Edwards P, Ekins RP, Finney DJ et al. , Guidelines for immunoassay data processing. Clin. Chem 1985, 31, 1264–1271. [PubMed] [Google Scholar]
- [76].Fortin T, Salvador A, Charrier JP, Lenz C et al. , Multiple reaction monitoring cubed for protein quantification at the low nanogram/milliliter level in nondepleted human serum. Anal. Chem 2009, 81, 9343–9352. [DOI] [PubMed] [Google Scholar]
- [77].Carr SA, Anderson L, Protein quantitation through targeted mass spectrometry: the way out of biomarker purgatory?. Clin. Chem 2008, 54, 1749–1752. [DOI] [PMC free article] [PubMed] [Google Scholar]
- [78].Fortin T, Salvador A, Charrier JP, Lenz C et al. , Clinical quantitation of prostate-specific antigen biomarker in the low nanogram/milliliter range by conventional bore liquid chromatography-tandem mass spectrometry (multiple reaction monitoring) coupling and correlation with ELISA tests. Mol. Cell. Proteomics 2009, 8, 1006–1015. [DOI] [PMC free article] [PubMed] [Google Scholar]