Abstract
The p53 tumor suppressor protein is one of the key checkpoints in cellular response to a variety of stress mechanisms, including exposure to various toxic metal complexes. Previous studies have demonstrated that arsenic and chromium complexes are able to activate p53, but there is a dearth of data investigating whether uranium complexes exhibit similar effects. The use of depleted uranium (DU) has increased in recent years, raising concern about DU’s potential carcinogenic effects. Previous studies have shown that uranyl acetate and uranyl nitrate are capable of inducing DNA strand breaks and potentially of inducing oxidative stress through free radical generation, two potential mechanisms for activation of p53. Based on these studies, we hypothesized that either uranyl acetate or uranyl nitrate could act as an activator of p53. We tested this hypothesis using a combination of cytotoxicity assays, p53 activity assays, western blotting and flow cytometry. All of our results demonstrate that there is not a p53-mediated response to either uranyl acetate or uranyl nitrate, demonstrating that any cellular response to uranium exposure likely occurs in a p53-independent fashion under the conditions studied.
Keywords: p53, depleted uranium, cell cycle, radiation
1. Introduction
Uranium is a potentially carcinogenic metal of growing importance, especially with the increased use of depleted uranium in munitions and armor plating by the military. Uranium is particularly interesting since it exhibits both heavy metal and radioactive properties, primarily through alpha particle decay [1]. There are three primary isotopes of uranium: 238U (99.3%), 235U (0.7%), and 234U (0.005%) [2] and several relevant oxidation states, II, III, IV, V, and VI, though the primary form of uranium in solution is the uranyl ion (UO22+). Depleted uranium (DU) is the byproduct of uranium enrichment, containing 0.3–0.4% U235 and 60% of the radioactivity of natural uranium. [3, 4]. The high density (19.1 g/cm3) and pyrophoric properties of depleted uranium make it desirable as fuel for nuclear reactors and as raw material for making both ammunition and tank armor for the military [5, 6].
There is growing concern over possible health effects associated with DU exposure. Previous studies have shown that a soluble form of DU, uranyl acetate, can induce DNA strand breaks in the presence of ascorbate [4] and that exposure to DU can induce oxidative DNA damage [5]. It has been hypothesized that the mechanism of hexavalent uranium toxicity may be similar to the mechanism of Cr(VI) toxicity due to similarities between the chemistry of uranium and chromium [4]. Previous work has shown that hexavalent chromium, Cr(VI) forms Cr(V) species upon reacting with reduced glutathione (GSH) producing hydroxyl radicals through a Fenton type reaction, causing DNA damage. Similar mechanisms of oxidative DNA damage are known for Fe(II) complexes and have been proposed for uranyl complexes [4, 7].
One of the critical checkpoints in resisting oxidative DNA damage and maintaining genomic integrity and stability is the p53 tumor suppressor protein [8, 9]. Activation of p53 occurs in response to a variety of stress signals including UV, nitric oxide, hypoxia, and spindle damage [10, 11]. Importantly, exposure to metal complexes has also been shown to activate p53-mediated responses. Both sodium arsenate and arsenic trioxide induce increased cellular p53 levels [12], while human lung fibroblasts exhibit 4- to 6-fold increases in p53 following treatment with hexavalent chromium [13]. Sodium dichromate exposure induces posttranslational phosphorylation of Ser15 and acetylation of Lys382 in p53, known signals of p53 activation. Manganese (II) chloride and cadmium sulfate initiate p53-mediated apoptotic pathways [14] and inhibit DNA synthesis in a ATM-independent manner [15], while vanadate induces cell growth arrest through a p53-mediated pathway [16]. While there is reasonable evidence to suggest a p53-mediated response to metal exposure, there remains a limited understanding of the molecular mechanism of this response. Developing an increased understanding of the role of p53 in response to metal exposure is important, especially with the increase of potential methods of exposure to metal complexes in today’s environment.
The potential of uranyl complexes to induce both free radical formation and DNA damage led us to hypothesize that exposure to soluble uranium complexes might induce activation of p53. Because UO22+ species is the predominant bioavailable form of uranium in aqueous solutions [17], cells were treated with either uranyl acetate and uranyl nitrate in these studies. Neither uranyl complex was shown to induce cell cycle arrest or increased apoptosis, signals of active p53, under conditions previously shown to induce DNA damage [18]. It was further demonstrated through western blotting that levels of total p53 and active p53 do not increase following uranyl acetate treatment. Using a luciferase activity assay, we show that the level of active p53 does not increase in the presence of either uranyl acetate or uranyl nitrate. Finally, the absence of p53 was not shown to not alter uranyl acetate toxicity. Taken together, these results strongly support the hypothesis that exposure to either uranyl acetate or uranyl nitrate does not activate a p53-mediated pathway, suggesting that any cellular response to uranium exposure occurs via a p53-independent mechanism.
2. Materials and methods
2.1. Reagents
DU as uranyl acetate (UA) was obtained from Electron Microscopy Sciences (Hatfield, PA) and used as received. A U234/U238activity ratio of 0.14 was determined by ICP-MS. DU as uranyl nitrate (UN) was obtained from J.T. Baker (Phillipsburg, NJ) and used as received. A U234/U238activity ratio of 0.51 was determined by ICP-MS. Boric acid and sodium chromate was purchased from Sigma (St. Louis, MO). 30 % Hydrogen peroxide was purchased from Sigma (St. Louis, MO). Trypsin was purchased from HyClone (Logan, UT). Luciferase assay reagents were purchased from Promega (Madison, WI).
2.2. Cell culture
The A1-5 rat embryo fibroblast cell line and its stable p53 luciferase reporter plasmid transfectant (A1-5+luciferase), were cultured in DMEM medium containing 10% bovine growth serum (BGS) and 1% penicillin-streptomycin in a 37° C incubator containing 5% CO2. p53-deficient human colon tissue cells (Hct116 (p53 −/−)) derived from human colon tissue cells (Hct116 (p53 +/+)) were cultured in McCoy’s 5A medium containing 10% bovine growth serum (BGS) and 1% penicillin-streptomycin in a 37° C incubator containing 5% CO2.
2.3. Western Blotting
Hct116 (p53 +/+) cells (60% confluence) were treated with 50, 100, 150, 200, 250 µM uranyl acetate or uranyl nitrate respectively. After incubation at 37°C for 24 h, cells were collected and total cell extracts were made and analyzed for total p53 and phospho-P53 level by western blot using anti-p53 (DO-1) (Santa Cruz Biotechnology, Santa Cruz, CA) and anti-phospho P53 (Ser-15) (Cell Signaling, Danvers, MA). Western blot analysis was performed according to standard procedures using PVDF membranes (Millipore, Bedford, MA). Signals were detected by the chemiluminescence method using Super Signal West Pico chemiluminescent substrate (Pierce, Rockford, IL).
2.4. Flow Cytometry
After treatment with 50, 100, 150, 200, 250 µM uranyl acetate or uranyl nitrate for 48 h, or 20, 40, 80, 120, 160 µM sodium chromate for 24 h, Hct116 +/+ cells were harvested by trypsinizing, washed, and incubated overnight with 95% ethanol. Cells were pelleted and resuspended in phosphate buffered saline (PBS), treated with RNase A, and stained with propidium iodide (Sigma-Aldrich, St. Louis, MO). Flow cytometric analysis was performed using a FACScan flow cytometer (BD Biosciences, San Jose, CA) and 4500 cells were measured for each sample.
2.5. Uranium uptake determination
Hct116 (p53 +/+) cells were grown to 89–90% confluency and 1 × 10⁶ cells were seeded into 100 mm petri dishes. Following overnight incubation, cells were treated with 100 or 250 µM UA for 48 h. Control samples for extracellular binding were prepared by treating cells for 1 min with either 100 or 250 µM UA. Following incubation, cells were washed 5 times with 5 mLs of 1X PBS and each wash was saved for analysis. Cells were collected after washing and lysed using a combination of pipetting and vortexing for 3 min. Samples were prepared for ICP-MS analysis by adding 5 mL of concentrated nitric acid to each sample and incubating the samples overnight at 80 °C. Samples were analyzed using a Thermo X Series II ICP-MS.
2.5. Luciferase Assay
A1-5+luciferase cell lines were grown to 80–90% confluency and 1 × 10⁶ cells were seeded into 100 mm petri dishes. Cells were treated with 50, 100, 150, 200 and 250 µM uanyl acetate, uranyl nitrate or sodium chromate for 48 h. Following treatment, cells were prepared following the Luciferase Assay System protocol (Promega, Madison, WI) and luciferase levels were measured using a Synergy™ 4 multi-detection microplate reader (Biotek®, Winooski, Vermont).
2.6. Clonogenics Assay
A1-5, Hct116 (p53 +/+), and Hct116 (p53 −/−) cell lines were grown to 80–90% confluency and 1 × 10⁶ cells were seeded into 100 mm petri dishes. Following overnight incubation, cells were treated with 50, 100, 150, 200 and 250 µM boric acid, uanyl acetate, uranyl nitrate or sodium chromate for 48 h, or 50, 100, 150, 200 and 250 µM hydrogen peroxide for 4 h. Following treatment, equivalent numbers of cells were plated in quadruplicate in 60 mm petri dishes and incubated for 7 days. After 7 days, plates were stained using a crystal violet solution (80% methanol, 10% H2O, 2.5 g crystal violet, 10% formaldehyde), colonies were counted and the percent cell survival of each dose was analyzed and recorded.
2.7. Statistical Analysis
Statistical analysis was evaluated using analysis of variance (ANOVA) tests. Luciferase and acute toxicity data were analyzed using single factor ANOVA. Differences were considered statistically significant at the level p < 0.05. For bivariant regression analysis, comparing two lines, analysis of variance was analyzed along with Student’s t-test, again using the 0.05 level of significance.
3. Results
3.1 Uranyl acetate and uranyl nitrate do not elicit cell cycle-based responses
Previous work has shown that uranyl complexes induce DNA damage [4, 18], but little is known about the cellular response to uranyl complex exposure. Two potential cellular responses are p53 mediated cell-cycle arrest due to DNA damage and increased apoptosis. We tested the ability of both uranyl acetate and uranyl nitrate to induce cell-cycle arrest by measuring the amount of S-phase DNA. Hct116 (p53 +/+) and Hct116 (p53 −/−) cells were treated with increasing concentrations of either uranyl acetate or uranyl nitrate and DNA content was measured by flow cytometry. As shown in Figure 1, the percentage of cells in S phase (~3.5% in Hct116 (p53 +/+) cells and ~7% in Hct116 (p53 −/−) cells) does not change with treatment of either uranyl acetate or uranyl nitrate. In contrast, there is a 4-fold increase in the percentage of S phase DNA following treatment with sodium chromate (a known activator of p53 [13, 19], consistent with cell cycle arrest.
Figure 1. Exposure to uranium does not cause cell cycle arrest regardless of p53 status.
Hct116 (p53 +/+) (A) or Hct116 (p53 −/−) (B) cells were grown to 85% confluence and then exposed to either uranium acetate (UA) or uranium nitrate (UN). The cells were incubated with the uranium compounds for 24 h before harvesting and analyzing by flow cytometry. The graph depicts the fraction of cells in G1 at each of the concentrations and each point represents the average of 4500 events.
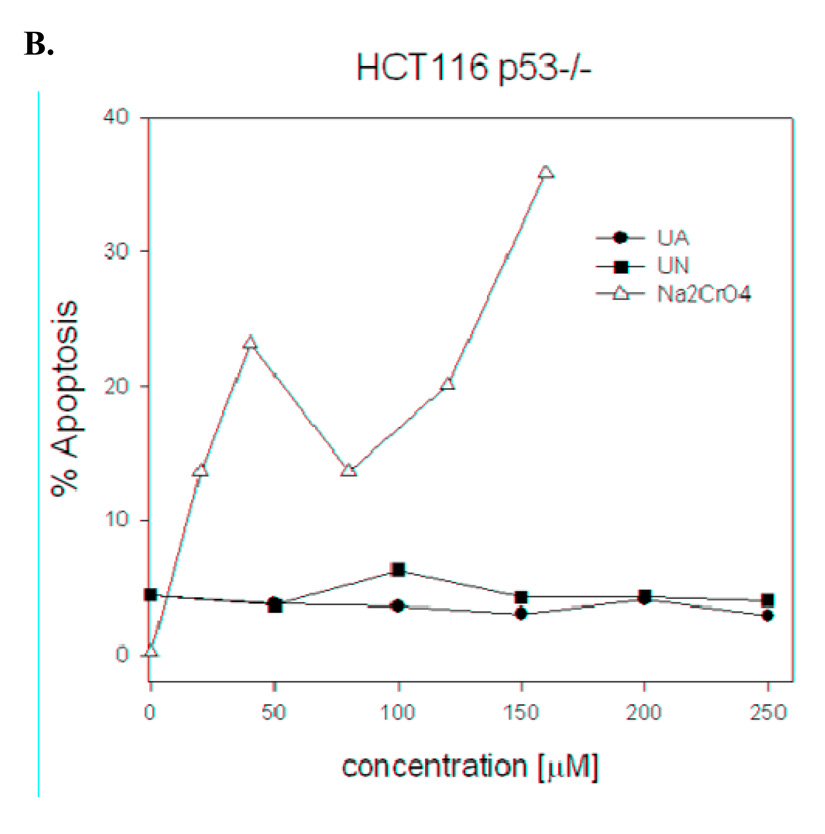
Another potential p53 mediated response is increased apoptosis. Hct116 (p53 +/+) and Hct116 (p53 −/−) cells were treated with uranyl complexes as before and the percentage of cells undergoing apoptosis was measured by flow cytometry. Figure 2 demonstrates that uranyl complex treatment of either Hct116 (p53 +/+) or Hct116 (p53 −/−) cells does not result in increased apoptosis. In contrast, treatment with the known p53 activator sodium chromate results in a 4- to 6-fold increase in apoptosis, consistent with activation of a p53-mediated response. Based on these results, we conclude that neither uranyl acetate nor uranyl nitrate induce cell cycle arrest at the concentrations we tested.
Figure 2. Exposure to uranium does not cause apoptosis regardless of p53 status.
Hct116 (p53 +/+) (A) or Hct116 (p53 −/−) (B) cells were grown to 85% confluence and then exposed to either uranium acetate (UA) or uranium nitrate (UN). The cells were incubated with the uranium compounds for 24 h before harvesting and analyzing by flow cytometry. The graph depicts the fraction of viable cells and each point represents the average of 4500 events.
3.2 Cells treated with uranyl acetate demonstrate uptake of the uranyl complex
One possible interpretation of our results is that we do not observe an upregulation of p53 because the uranyl acetate or uranyl nitrate is not able to enter the cell. While the observed activation by sodium chromate would suggest that uranyl acetate is able to enter the cell as well, we measured uranium uptake after a 48 h treatment with ICP-MS to verify this. Hct116 (p53 +/+) cells were treated with a final concentration of 100 µM and 250 µM uranyl acetate for 48 h. Following treatment, cells were washed 5 times with PBS to remove any uranyl acetate bound to the surface of the cells and each wash was collected for analysis. In addition, an equivalent number of cells were treated with both 100 µM and 250 µM for 1 min as a control for binding of uranyl acetate to the surface of the cell. Each sample was lysed and the 238U content was measured by ICP-MS.
The results of this experiment clearly demonstrate uptake of 238U into the Hct116 cells (Figure 3). Trace amounts of 238U are seen in the wash solutions, suggesting that some 238U may be bound to the surface of the cells. This is supported but the low amounts of 238U measured in the 0 h time point. While the 100 µM sample exhibit slightly higher non-specific binding than the 250 µM sample, this different is not statistically significant. This is not surprising since uranyl acetate binds proteins non-specifically. However, the amount of 238U detected in the 0 h samples is minimal compared to the measured 238U in both the samples of cells treated for 48 h (2100 ppb for 100 µM and 6400 ppb for 250 µM). This study is not able to distinguish between possible mechanisms to determine if uptake is specific or nonspecific but it does demonstrate that uranyl ions enter the cell and therefore the lack of a p53-mediated response is not due to the inability of uranyl acetate to enter the cell.
Figure 3. Hct116 p53(+/+) cells exhibit uptake of uranyl acetate.
Hct116 (p53 +/+) cells were treated with uranyl acetate (UA) at the concentrations indicated for 48 h. Equivalent cell numbers were collected, lysed and treated with nitric acid to release internalized uranium. Cells treated for 48 h with uranyl acetate exhibit significant uptake of uranium relative to control samples.
3.3 p53 levels do not increase with treatment of uranyl acetate and uranyl nitrate
The previously discussed cell cycle experiments demonstrated that uranyl complexes do not influence the cell cycle. However, it is possible that a p53-mediated response might occur without measurable cell-cycle effects. To eliminate this possibility, western blotting was performed on cells exposed for 24 h to either uranyl acetate or uranyl nitrate to measure total p53 levels. We also used an anti-p53 antibody specific for phosphorylation of Ser-15, a marker for p53 activation to compare total p53 levels to activated p53 levels. As shown in Figure 4, the level of total p53 and of Ser-15 phosphorylation does not change as compared to pre-treatment following treatment with either uranyl acetate or uranyl nitrate. However, cells exposed to ionizing radiation showed significant Ser-15 phosphorylation as predicted. These results support our model that uranyl complexes do not activate p53.
Figure 4. Western blotting exhibits no activation of p53.
Hct116 (p53 +/+) cells were treated with uranyl acetate (UA) or uranyl nitrate (UN) at the concentrations indicated for 24 h. Total cell extracts were prepared and tested for total p53 (upper blot) and for phospho-P53 levels (lower blot). Extracts prepared from A1-5 cells that were exposed to 5Gy ionizing radiation are included as a positive control (IR, far right lane).
3.4 p53-mediated luciferase expression does not increase following uranyl acetate or uranyl nitrate exposure
To further demonstrate that p53 is not activated by uranyl acetate or uranyl nitrate, we utilized a luciferase-expression assay to measure p53 activity directly. For this assay, we used a rat embryo fibroblast cell line containing a temperature sensitive mouse p53 gene (A1-5) that was stably transfected with the firefly luciferase gene under control of a consensus p53 promoter (A1-5 luc). We also transiently transfected the Hct116 +/+ cell line with a dual luciferase reporter system, which also contained the firefly luciferase gene under control of the p53 promoter.
Cells were treated with either uranyl acetate or uranyl nitrate for 48 h and luciferase production was measured. As can be seen in Figure 5, neither uranyl acetate or uranyl nitrate demonstrated a statistically significant increase in luciferase production. In contrast, luciferase production was shown to increase with increasing concentrations of sodium chromate, a known activator of p53, in a statistically significant manner. These results further support the conclusion that p53 is not activated by uranyl complexes.
Figure 5. Uranyl nitrate and uranyl acetate do not induce p53 activity.
A1-5 cells expressing bacterial luciferase under control of a p53 promoter were treated with uranyl acetate (UA), uranyl nitrate (UN) and sodium chromate (SC). Sodium chromate exposure induced increased p53 activity, as shown by the increased luciferase signal, while no significant increase in p53 activity is seen following UA or UN exposure. (*) Normalized relative luminescence units/million cell signal were significantly different from 0 µM normalized relative luminescence units/million cells signal (p < 0.05). Data represents mean ± SEM for n = 3–7 experiments.
3.5 Toxicity of uranyl acetate and uranyl nitrate is not affected by expression of p53
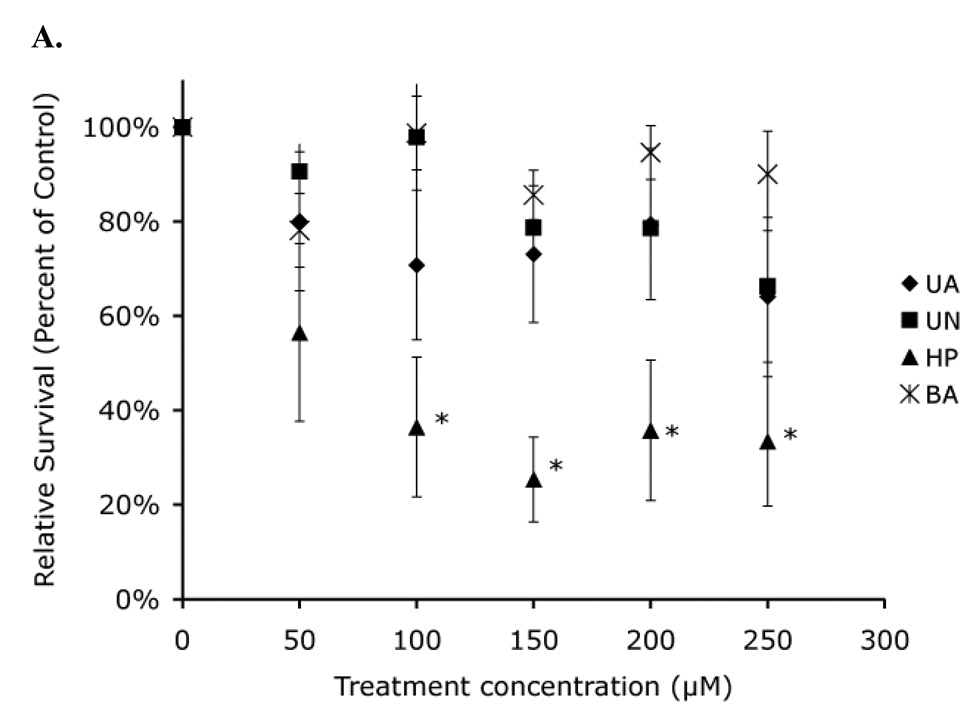
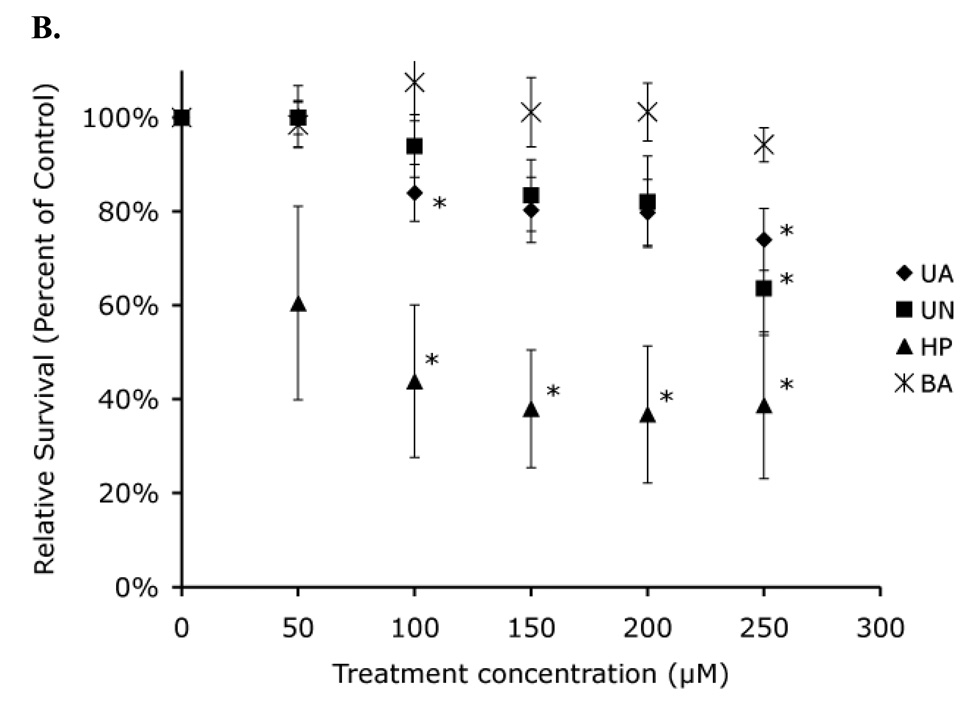
As a final test to determine if uranyl complexes can induce p53 activation, we examined the toxicity of uranyl complexes in Hct116 (p53 +/+) cells and Hct116 (p53 −/−) cells. Previous studies have shown that exposure to metals inducing a p53-mediated response results in increased apoptosis in the presence of p53 [14]. Based on this observation, we hypothesized that Hct116 (p53 +/+) cells would exhibit increased uranyl toxicity compared to Hct116 (p53 −/−) cells if uranyl complexes induced a p53-mediated response. We investigated this possibility using a clonogenics toxicity assay. Hct116 (p53 +/+) and Hct116 (p53 −/−) cells were treated with increasing concentrations of both uranyl acetate and uranyl nitrate for 48 h. Treated cells were counted immediately after treatment as a measure of acute toxicity and colony-forming ability was determined as a measure of genotoxicity. Boric acid was chosen as a negative control as it has been shown to not induce any p53 mediated effects [14], while hydrogen peroxide was used as a positive control. Hydrogen peroxide is a well-known activator of p53 through the generation of oxidative stress and has been shown to be both genotoxic and mutagenic, making it a suitable control for p53-mediated effects.
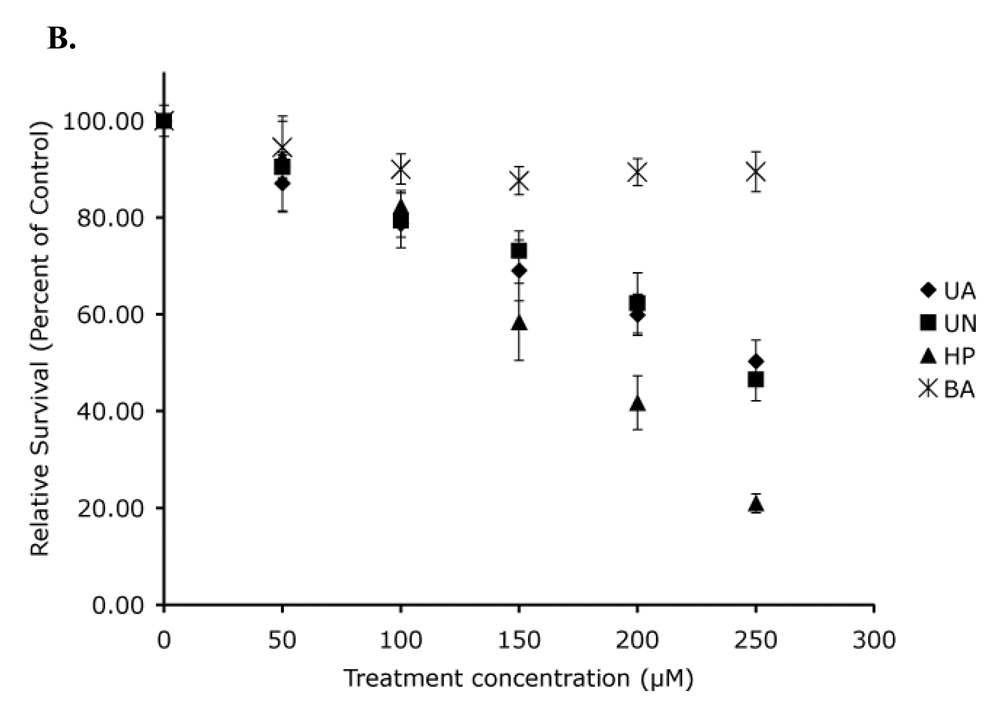
A 48 h treatment of both Hct116 (p53 +/+) and Hct116 (p53 −/−) cells resulted in a 65% acute toxicity at the highest concentration of both uranyl acetate and uranyl nitrate tested (Figure 6). In contrast, a similar length treatment with similar concentrations of hydrogen peroxide resulted in complete toxicity. We therefore were only able to test hydrogen peroxide for 4 h, indicating that the overall acute toxicity of uranyl acetate and uranyl nitrate is much lower than hydrogen peroxide. Consistent with our other results, Hct116 (p53 +/+) and Hct116 (p53 −/−) cells showed equivalent levels of acute toxicity, suggesting that p53 might not play a role in the cellular response to either uranyl acetate or uranyl nitrate.
Figure 6. Acute toxicity demonstrates no significant difference in toxicity in the absence of p53.
Hct116 (p53 +/+) cells (A) and Hct116 (p53 −/−) cells (B) were treated with uranyl acetate (UA), uranyl nitrate (UN), along with hydrogen peroxide (HP), and boric acid (BA) as positive and negative controls respectively. (*) Percent survival values were significantly different from survival of cells treated with BA (p < 0.05). Data represents mean ± SEM for n = 4–5 experiments.
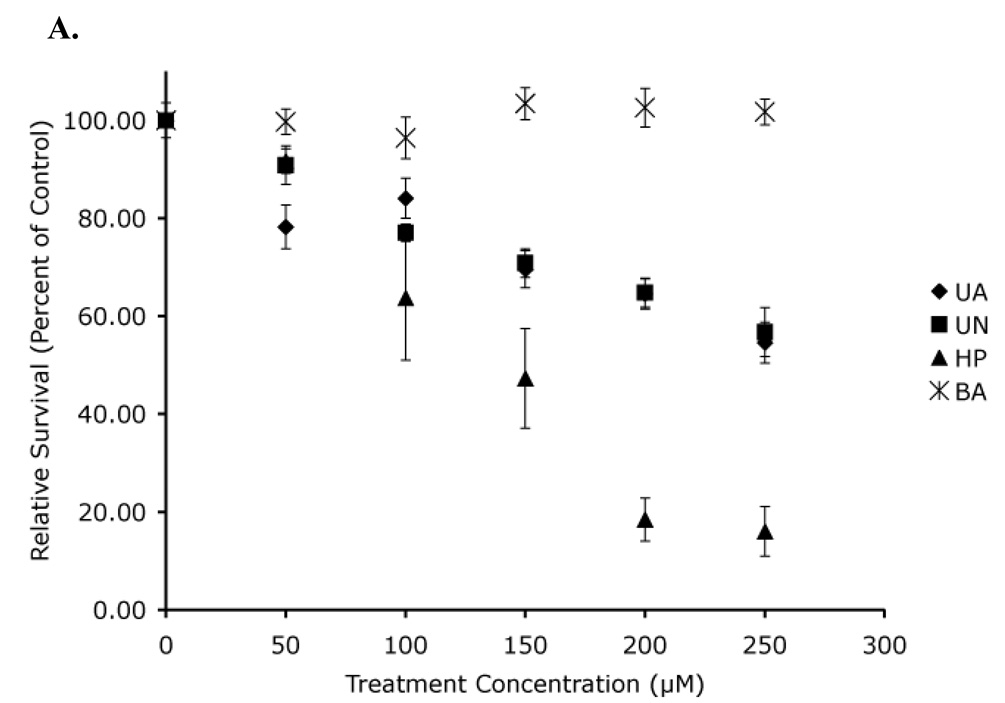
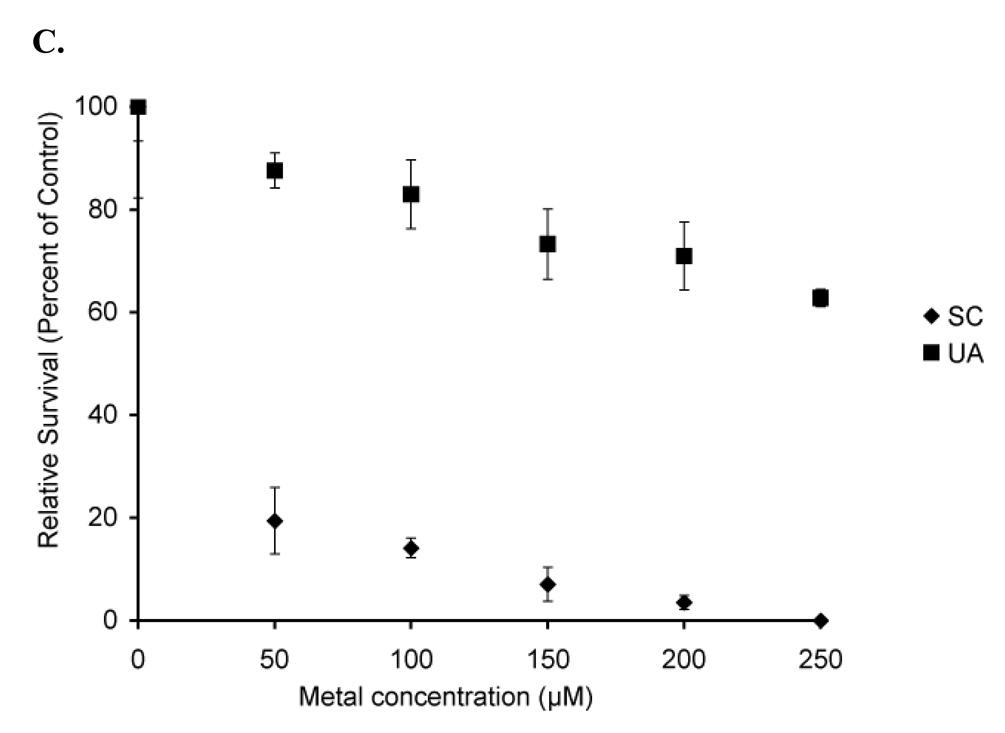
The lack of any p53-mediated difference in acute toxicity is not too surprising since acute toxicity does not necessarily correlate with genotoxicity. We therefore determined the colony forming ability of equivalent numbers of cells following treatment with either uranyl acetate or uranyl nitrate. Both uranyl acetate and uranyl nitrate induced a 50% loss in viability at the highest tested concentration in both the Hct116 ((p53 +/+), Figure 7A) and Hct116 ((p53 −/−), Figure 7B) cells. We also tested the toxicity of sodium chromate using the A1-5 cell line. As shown in Figure 7C, this complex exhibited significantly more toxicity than the uranyl complexes. Statistical analysis of both the Hct116 (p53 +/+) and Hct116 (p53 −/−) cells showed statistically significant dose-dependent responses to both uranyl acetate and uranyl nitrate (p < 0.05). This was not too surprising since both uranyl acetate and uranyl nitrate are known to be genotoxic. However, it was surprising that there was not a difference between the p53 +/+ and p53 −/− cell lines. Statistical analysis was done using a bivariate regression analysis comparing the toxicity of either uranyl acetate or uranyl nitrate in Hct116 (p53 +/+) cell line to the toxicity of either uranyl acetate or uranyl nitrate in the Hct116 (p53 −/−) cell line. This analysis showed that there is not a statistically relevant difference between the slopes of the Hct116 (p53 +/+) cell lines and Hct116 (p53 −/−) cell lines (p = 0.370 for uranyl acetate treated cells, p = 0.730 for uranyl nitrate treated cells). This demonstrates that while uranyl acetate and uranyl nitrate are toxic, the cellular response to either complex does not appear to be p53-mediated. This experiment has been repeated with varying incubation times (4–8 h) with identical results (data not shown). Interestingly, Hct116 (p53 +/+) and Hct116 (p53 −/−) cells did not show the expected statistical difference following hydrogen peroxide treatment (p = 0.245), suggesting that there might be a p53-mediated response that the clonogenics assay is not sensitive enough to detect. We therefore cannot completely eliminate the possibility that the toxicity we observed may elicit a p53-mediated response, though we think this is highly unlikely based on our other results.
Figure 7. Clonogenics demonstrates no significant difference in toxicity in the absence of p53.
Hct116 (p53 +/+) cells (A) and Hct116 (p53 −/−) cells (B) were treated with uranyl acetate (UA), uranyl nitrate (UN), along with hydrogen peroxide (HP), and boric acid (BA) as positive and negative controls respectively. While both uranyl acetate and uranyl nitrate were toxic to Hct116 cells, there is no statistical difference between toxicity in cells expressing p53 and cells not expressing p53. A1-5 cells (C) treated with sodium chromate show significant toxicity relative to uranyl acetate. Data represents mean ± SEM for n = 3–5 experiments.
4. Discussion
Uranium is an interesting compound because is exhibits both heavy metal and radiological characteristics. While interest in uranium waned after the cold war, there has been a renewed interest in understanding the heath effects of uranium corresponding to the recent increase in military use of depleted uranium. The use of depleted uranium has been controversial because of potential long-term health effects due to depleted uranium exposure. Cell culture and rodent studies have demonstrated the potential of chronic depleted uranium exposure to cause leukemia, neoplastic transformation of lung epithelial cells and DNA methylation [20–22]. However, epidemiology data has not been able to conclusively demonstrate any specific effects due to depleted uranium exposure [23].
The predominant form of military depleted uranium exposure is in the form of particulate depleted uranium, which has been shown in other studies to be cytotoxic [6]. However, the focus of this study is on soluble forms of depleted uranium, which is the predominant form of uranium contamination in drinking water. This is a major concern in the areas surrounding uranium mines. Previous studies have demonstrated both the cytotoxicity and DNA damage-inducing potential of uranyl acetate [4, 18] but the cellular response to uranyl ion exposure is largely unknown.
A key cellular response to DNA damage is the upregulation of p53, a tumor suppressor protein that regulates both DNA-repair and apoptosis pathways in the cells. Heavy metals such as arsenic and chromium have been shown to induce p53-mediated responses [12, 13, 19, 24, 25], as has ionizing radiation [26–29]. Because of the potential of uranyl complexes to induce DNA damage either as a heavy metal or as a radionucleotide, we proposed that a cellular response to uranyl complex exposure would be upregulation of p53. Contrary to our hypothesis, we were not able to detect any p53-mediated responses following exposure to either uranyl acetate or uranyl nitrate. While we acknowledge that there is a possibility p53 might play a role in the cellular response to uranyl complex exposure, any p53-mediated response to the conditions that we tested is extremely weak.
One possible explanation for the lack of a p53 response could be the uranyl complex concentrations tested in this experiment. Previous in vitro studies have used concentrations up to 1 mM uranyl acetate, though plasmid relaxation (a sign of DNA single strand breaks) can be observed at 100 µM [4]. Observable increases in both mutation rates and DNA damage were been observed in vivo between 100 and 300 µM uranyl acetate [18], which we used as the basis for the concentration range chosen for our study. Based on this previous study, it is unlikely that the lack of observable p53 activity is due to insufficient concentrations of uranyl acetate or uranyl nitrate.
Another consideration is speciation of the uranyl complex. UO22+ was introduced in the form of either uranyl acetate or uranyl nitrate. However, the CO2 rich environment used for cell culture could result in formation of uranyl carbonate species, which are more stable than uranyl acetate or uranyl nitrate species. Formation of uranyl carbonate species reduces the bioavailability of UO2+2 [17], which could potentially account for the lack of a p53-mediated response. However, since the majority of cell culture studies are conducted in a 5% CO2 atmosphere and uranyl acetate has been shown to be both toxic (this study) and mutagenic under these conditions [18], it is highly unlikely that the lack of observable p53 activity in our studies is due to uranyl carbonate formation.
Therefore, what is the source of the UO2+ toxicity? Our results demonstrate that toxicity is independent of p53 function. However, it is possible that UO2+ is binding directly to p53 and inhibiting function. Both Ni+2 and Co+2 inhibit p53 activity in vitro, though this appears to be through indirect binding rather than substitution of the bound Zn2+ required for function [30]. Since UO2+ is known to bind non-specifically to proteins, it is possible that UO2+ acts like Ni+2 and Co+2 and is binding to p53, inactivating it. However, this would only explain the lack of measurable p53 activity and does not explain the lack of p53 upregulation. The most likely possibility is that the DNA damage from UO2+ exposure does not trigger p53-mediated repair pathways, though more detailed studies will be necessary to determine the specific pathways that UO2+ does activate.
One challenge in studying the physiological effects of uranium is distinguishing between heavy metal and radiological effects. The lack of a p53-mediated response may provide insight into the nature of uranyl complex toxicity. A variety of metal complexes (such as arsenic, chromium, and manganese) activate p53 [25, 31–35], though these metals do not exhibit radiological effects. One interpretation of the toxicity of uranyl acetate and uranyl nitrate without p53 activation is that the measured toxicity is due to the alpha particle emissions from the uranyl complexes and not due to uranium’s heavy metal properties. However, previous work has shown that uranyl acetate acts more like a heavy metal when inducing DNA damage [18, 36] and not all heavy metals activate p53. Nickel is a genotoxic agent that has been shown to induce both cell-cycle arrest and apoptosis in a p53-independent manner [37, 38], suggesting that a lack of a response is not sufficient to distinguish between potential radiological and heavy metal effects and more work will be necessary to determine the true nature of uranyl complex toxicity.
The difference in ability of different metals to activate p53 is interesting and not easily explained with current data. Different metal complexes are known to induce different cellular effects. Arsenic has been proposed to inhibit DNA repair mechanisms by suppressing p53 induction, resulting in increased carcinogenesis [25]. In contrast, Cr(VI) decreases p53 degradation, increasing the levels of active p53, likely through the production of reactive oxygen species [35, 39, 40]. Nickel has been shown to both inhibit p53 activity as well as induce G2/M cell cycle arrest [30, 38]. The specific physiological effects of most metal complexes are still under investigation and until these mechanisms are clarified, it will be difficult to interpret the different effects each complex exerts of p53. However, it is becoming apparent that differences in p53 function are likely due to differences in the physiological effects in the cell rather than direct effects on p53.
In summary, the principal finding of our studies is that although UO2+ may be toxic, it does not activate the p53 tumor suppressor under the conditions we tested. Previous work examining the mechanism of uranyl acetate toxicity has shown that uranyl acetate is capable of producing DNA strand breaks under the conditions that we used in our experiments, a potential mechanism for p53 upregulation [4]. It was therefore reasonable to hypothesize that uranyl complexes might induce p53 activation. We were unable to demonstrate p53 activation following exposure to either uranyl acetate or uranyl nitrate, suggesting that any DNA damage induced by UO2+ does not involve a p53-mediated repair pathway. These results are consistent with recent results involving nickel exposure [37, 38], which also does not result in p53 upregulation. These studies demonstrate that there are still significant gaps in our understanding of physiological effects of metal exposure, specifically the effects of depleted uranium. With the increased use of DU by the military, developing this improved understanding is of increasing importance.
Acknowledgements
The authors would like to thank Diane Stearns and Virginia Coryell for their thoughtful discussion and assistance in preparing this manuscript. Funding for this study was provided by NIH 5U54CA096320-05.
Abbreviations
- ANOVA
Analysis of variance
- BGS
Bovine growth serum
- DMEM
Dulbecco’s Modified Eagle Medium
- DU
Depleted uranium
- GSH
reduced glutathione
- ICP-MS
Inductively Coupled Plasma – Mass Spectrometry
- IR
Ionizing radiation
- PBS
Phosphate Buffered Saline
- SEM
Standard Error of the Mean
- UA
Uranyl acetate
- UN
Uranyl nitrate
Footnotes
Publisher's Disclaimer: This is a PDF file of an unedited manuscript that has been accepted for publication. As a service to our customers we are providing this early version of the manuscript. The manuscript will undergo copyediting, typesetting, and review of the resulting proof before it is published in its final citable form. Please note that during the production process errors may be discovered which could affect the content, and all legal disclaimers that apply to the journal pertain.
References
- 1.La Touche YD, Willis DL, Dawydiak OI. Health. Phys. 1987;53:147–162. doi: 10.1097/00004032-198708000-00005. [DOI] [PubMed] [Google Scholar]
- 2.Domingo JL. Reprod. Toxicol. 2001;15:603–609. doi: 10.1016/s0890-6238(01)00181-2. [DOI] [PubMed] [Google Scholar]
- 3.Craft E, Abu-Qare A, Flaherty M, Garofolo M, Rincavage H, Abou-Donia M. J Toxicol. Environ. Health. B Crit. Rev. 2004;7:297–317. doi: 10.1080/10937400490452714. [DOI] [PubMed] [Google Scholar]
- 4.Yazzie M, Gamble SL, Civitello ER, Stearns DM. Chem. Res. Toxicol. 2003;16:524–530. doi: 10.1021/tx025685q. [DOI] [PubMed] [Google Scholar]
- 5.Miller AC, Stewart M, Brooks K, Shi L, Page N. J. Inorg. Biochem. 2002;91:246–252. doi: 10.1016/s0162-0134(02)00391-4. [DOI] [PubMed] [Google Scholar]
- 6.Wise SS, Thompson WD, Aboueissa AM, Mason MD, Wise JP., Sr Chem. Res. Toxicol. 2007;20:815–820. doi: 10.1021/tx700026r. [DOI] [PubMed] [Google Scholar]
- 7.Valko M, Morris H, Cronin MT. Curr. Med. Chem. 2005;12:1161–1208. doi: 10.2174/0929867053764635. [DOI] [PubMed] [Google Scholar]
- 8.Lane DP. Nature. 1992;358:15–16. doi: 10.1038/358015a0. [DOI] [PubMed] [Google Scholar]
- 9.Macleod K. Curr. Opin. Genet. Dev. 2000;10:81–93. doi: 10.1016/s0959-437x(99)00041-6. [DOI] [PubMed] [Google Scholar]
- 10.Prives C, Hall PA. J. Pathol. 1999;187:112–126. doi: 10.1002/(SICI)1096-9896(199901)187:1<112::AID-PATH250>3.0.CO;2-3. [DOI] [PubMed] [Google Scholar]
- 11.Vousden KH, Lu X. Nat. Rev. Cancer. 2002;2:594–604. doi: 10.1038/nrc864. [DOI] [PubMed] [Google Scholar]
- 12.Filippova M, Duerksen-Hughes PJ. Chem. Res. Toxicol. 2003;16:423–431. doi: 10.1021/tx025606a. [DOI] [PubMed] [Google Scholar]
- 13.Carlisle DL, Pritchard DE, Singh J, Owens BM, Blankenship LJ, Orenstein JM, Patierno SR. Toxicol. Sci. 2000;55:60–68. doi: 10.1093/toxsci/55.1.60. [DOI] [PubMed] [Google Scholar]
- 14.van Vliet E, Eskes C, Stingele S, Gartlon J, Price A, Farina M, Ponti J, Hartung T, Sabbioni E, Coecke S. Toxicol. In Vitro. 2007;21:698–705. doi: 10.1016/j.tiv.2006.12.004. [DOI] [PubMed] [Google Scholar]
- 15.Cao F, Zhou T, Simpson D, Zhou Y, Boyer J, Chen B, Jin T, Cordeiro-Stone M, Kaufmann W. Toxicol. Appl. Pharmacol. 2007;218:174–185. doi: 10.1016/j.taap.2006.10.031. [DOI] [PMC free article] [PubMed] [Google Scholar]
- 16.Zhang Z, Huang C, Li J, Shi X. J. Inorg. Biochem. 2002;89:142–148. doi: 10.1016/s0162-0134(01)00409-3. [DOI] [PubMed] [Google Scholar]
- 17.Markich SJ. ScientificWorld Journal. 2002;2:707–729. [Google Scholar]
- 18.Stearns DM, Yazzie M, Bradley AS, Coryell VH, Shelley JT, Ashby A, Asplund CS, Lantz RC. Mutagenesis. 2005;20:417–423. doi: 10.1093/mutage/gei056. [DOI] [PubMed] [Google Scholar]
- 19.Bagchi D, Bagchi M, Stohs SJ. Mol. Cell. Biochem. 2001;222:149–158. [PubMed] [Google Scholar]
- 20.Miller AC, Bonait-Pellie C, Merlot RF, Michel J, Stewart M, Lison PD. Mol. Cell. Biochem. 2005;279:97–104. doi: 10.1007/s11010-005-8226-z. [DOI] [PubMed] [Google Scholar]
- 21.Miller AC, Stewart M, Rivas R. Biochimie. 2009;91:1328–1330. doi: 10.1016/j.biochi.2009.03.010. [DOI] [PubMed] [Google Scholar]
- 22.Xie H, LaCerte C, Thompson WD, Wise JP., Sr Chem. Res. Toxicol. 2010;23:373–378. doi: 10.1021/tx9003598. [DOI] [PubMed] [Google Scholar]
- 23.Miller AC, McClain D. Rev. Environ. Health. 2007;22:75–89. doi: 10.1515/reveh.2007.22.1.75. [DOI] [PubMed] [Google Scholar]
- 24.Huang C, Ma WY, Li J, Dong Z. Cancer Res. 1999;59:3053–3058. [PubMed] [Google Scholar]
- 25.Shen S, Lee J, Weinfeld M, Le XC. Mol. Carcinog. 2008;47:508–518. doi: 10.1002/mc.20406. [DOI] [PubMed] [Google Scholar]
- 26.de Toledo SM, Azzam EI, Dahlberg WK, Gooding TB, Little JB. Oncogene. 2000;19:6185–6193. doi: 10.1038/sj.onc.1204020. [DOI] [PubMed] [Google Scholar]
- 27.Jen KY, Cheung VG. Cancer Res. 2005;65:7666–7673. doi: 10.1158/0008-5472.CAN-05-1039. [DOI] [PubMed] [Google Scholar]
- 28.MacCallum DE, Hupp TR, Midgley CA, Stuart D, Campbell SJ, Harper A, Walsh FS, Wright EG, Balmain A, Lane DP, Hall PA. Oncogene. 1996;13:2575–2587. [PubMed] [Google Scholar]
- 29.Midgley CA, Owens B, Briscoe CV, Thomas DB, Lane DP, Hall PA. J. Cell. Sci. 1995;108(Pt 5):1843–1848. doi: 10.1242/jcs.108.5.1843. [DOI] [PubMed] [Google Scholar]
- 30.Palecek E, Brazdova M, Cernocka H, Vlk D, Brazda V, Vojtesek B. Oncogene. 1999;18:3617–3625. doi: 10.1038/sj.onc.1202710. [DOI] [PubMed] [Google Scholar]
- 31.Yedjou CG, Tchounwou PB. Mol. Cell. Biochem. 2009;331:207–214. doi: 10.1007/s11010-009-0160-z. [DOI] [PMC free article] [PubMed] [Google Scholar]
- 32.Hill R, Leidal AM, Madureira PA, Gillis LD, Waisman DM, Chiu A, Lee PW. DNA Repair (Amst) 2008;7:1484–1499. doi: 10.1016/j.dnarep.2008.05.007. [DOI] [PubMed] [Google Scholar]
- 33.Yang H, Sun Y, Zheng X. J. Biochem. Mol. Toxicol. 2007;21:94–100. doi: 10.1002/jbt.20172. [DOI] [PubMed] [Google Scholar]
- 34.Suzuki T, Tsukamoto I. Eur. J. Pharmacol. 2005;525:48–53. doi: 10.1016/j.ejphar.2005.09.061. [DOI] [PubMed] [Google Scholar]
- 35.Wang S, Shi X. Carcinogenesis. 2001;22:757–762. doi: 10.1093/carcin/22.5.757. [DOI] [PubMed] [Google Scholar]
- 36.Coryell VH, Stearns DM. Mol. Carcinog. 2006;45:60–72. doi: 10.1002/mc.20155. [DOI] [PubMed] [Google Scholar]
- 37.Cai K, Ren C, Yu Z. Toxicol. Ind. Health. 2010;26:249–256. doi: 10.1177/0748233710364962. [DOI] [PubMed] [Google Scholar]
- 38.Ding J, He G, Gong W, Wen W, Sun W, Ning B, Huang S, Wu K, Huang C, Wu M, Xie W, Wang H. Cancer Epidemiol. Biomarkers Prev. 2009;18:1720–1729. doi: 10.1158/1055-9965.EPI-09-0115. [DOI] [PMC free article] [PubMed] [Google Scholar]
- 39.Shi X, Castranova V, Halliwell B, Vallyathan V. J. Toxicol. Environ. Health. B Crit. Rev. 1998;1:181–197. doi: 10.1080/10937409809524551. [DOI] [PubMed] [Google Scholar]
- 40.Wang S, Leonard SS, Ye J, Ding M, Shi X. Am. J. Physiol. Cell Physiol. 2000;279:C868–C875. doi: 10.1152/ajpcell.2000.279.3.C868. [DOI] [PubMed] [Google Scholar]


