

Abstract
AIMS
6-mercaptopurine (6-MP) is used in the treatment of childhood acute lymphoblastic leukaemia (ALL). Its red blood cell (RBC) metabolite concentrations (6-thioguanine [6-TGN] and 6-methylmercaptopurine nucleotides [6-MMPN]) are related to drug response. We investigated the impact of non-genetic covariates and pharmacogenetic polymorphisms affecting thiopurine methyltransferase (TPMT) and inosine triphosphate pyrophosphatase (ITPA) on 6-MP metabolism and response.
METHODS
Sixty-six children with ALL treated according to EORTC 58951 protocol were included in this study. Six patients had a heterozygous genotype for the most common TPMT polymorphisms, nine for ITPA 94 C > A and 17 for ITPA IVS2+21 A > C. 6-MP metabolites concentrations were analyzed by mixed model analysis.
RESULTS
During maintenance, steady-state RBC 6-TGN concentrations were lower in patients aged 6 years or younger (493 pmol/8 × 108RBC) than in older children (600 pmol/8 × 108RBC). 6-MMPN concentrations were low in patients with TPMT variant/wild-type ITPA (1862 pmol/8 × 108RBC), intermediate in wild-type patients and high (16468 pmol/8 × 108RBC) in patients wild-type TPMT/variant ITPA. A 6-MMPN threshold of 5000 pmol/8 × 108RBC was associated with an increased risk of hepatotoxicity.
CONCLUSION
In this study, age and both TPMT and ITPA genotypes influenced 6-MP metabolism. High 6-MMPN was associated with hepatotoxicity. These pharmacological tools should be used to monitor ALL treatment in children.
Keywords: hepatotoxicity, leukaemia, mercaptopurine, metabolism, paediatrics, pharmacogenetics
WHAT IS ALREADY KNOWN ABOUT THIS SUBJECT
The pharmacogenetic polymorphisms of both TPMT and ITPA are associated with individual variability in 6-mercaptopurine (6-MP) intracellular metabolism.
The balance between red blood cell (RBC) 6-thioguanine nucleotide (6TGN) and 6-methylated metabolite (6-MMPN) concentrations has an important impact on efficacy in children treated for acute lymphoblastic leukemia.
Hepatotoxicity is a frequent complication of the association 6-MP and methotrexate during maintenance therapy.
WHAT THIS STUDY ADDS
RBC 6-TGN concentrations are dependant on TPMT genotype and age, while RBC 6-MMPN concentrations depend on TPMT and ITPA polymorphisms.
Children aged 6 years or less had lower RBC 6-TGN concentrations during maintenance therapy, demonstrating an age effect on 6-MP intracellular metabolism.
Hepatotoxicity is a frequent complication of the association of 6-MP and methotrexate. A 6-MMPN threshold of 5000 pmol/8 × 108 RBC was associated with an increased risk of hepatotoxicity.
Introduction
Acute lymphoblastic leukaemia (ALL) is the most common childhood malignancy representing approximately 30% of all childhood malignancies and 80% of paediatric leukaemias [1]. The prognosis of this disease has dramatically improved over the last 30 years, with a 5 year survival of 90%. [2]. A further increase in the survival rate will depend on a reduction in drug-related toxicity, resulting in less interruption of chemotherapy and fewer relapses of the disease [3, 4]. Therefore, there is a need to tailor treatment to the individual in order to limit drug-related toxicity and improve survival of high risk patients.
The success of treatment is attributed in part to the 18–24 months of adequate maintenance therapy necessary to prolong the remission obtained during the initial treatment phases. Mercaptopurine (6-MP) and methotrexate (MTX) are the cornerstones of ALL maintenance therapy [5]. Both drugs exert their antileukaemic effect by the inhibition of de novo purine synthesis (DNPS). At low doses the combination of these two drugs results in a synergistic antileukaemic action [6]. MTX inhibits dihydrofolate reductase which is essential for purine synthesis [7]. 6-MP is a prodrug metabolized by multiple enzymatic steps of the purine salvage pathway [8, 9]: the anabolic pathway through the hypoxanthine guanine phosphoribosyl transferase (HPRT) produces 6-thioinosine monophosphate, and then 6-thioguanine nucleotides (6-TGN). 6-TGN is incorporated in nucleic acids or with phosphate in 6-thioinosine triphosphate (TITP), a process than can be reversed by inosine triphosphate pyrophosphatase (ITPA). Catabolic pathways are through xanthine oxidase (XO) inactivating 6-MP to 6-thiouric acid and through thiopurine S-methyltransferase (TPMT) metabolizing 6-MP to 6-methylmercaptopurine (6-MMPN) which inhibit DNPS.
It is well established that the balance between 6-TGN and 6-MMPN is highly variable and primarily influenced by genetic polymorphisms of TPMT [10]. In patients receiving 6-MP, the inter-individual variability in red blood cell (RBC) concentrations of 6-TGN and 6- MMPN is known to influence efficacy and side effects, with a high risk of myelosuppression in homozygous TPMT-deficient patients [11, 12]. However, additional single nucleotide polymorphisms (SNPs) in genes encoding enzymes involved in 6-MP metabolism may also influence its efficacy and toxicity [13].
In this study, we measured RBC 6-TGN and 6-MMPN concentrations in ALL patients receiving 6-MP during maintenance therapy to explore 6-MP metabolic variability. We also evaluated the combined impact of patients' covariates, TPMT and ITPA pharmacogenetic polymorphisms and RBC 6-TGN and 6-MMPN concentrations on the occurrence of drug toxicity during the same period.
This study did not investigate correlations with drug doses or blood counts.
Methods
Patients and treatment
Sixty-six children with ALL, included in the European Organization for Research and Treatment of Cancer (EORTC) 58951 protocol, were enrolled in this study. The institutional review committee (CCPRB 95025, Bichat Claude Bernard Hospital, Paris, France) approved the study and informed consent from parents or guardians was collected for all children. According to the EORTC protocol, the patients were classified in risk groups depending on pre-therapeutic factors and response to the induction therapy (very low risk, average risk 1 (AR1), average risk 2 (AR2) and very high risk). Only patients in groups AR1 and AR2 were included in this study.
Maintenance therapy consisted of daily oral 6-MP (50 mg m−2) and weekly oral MTX (20 mg m−2) for 74 weeks. Medications were administered in the evening as recommended [14]. 6-MP doses were adjusted to maintain the white blood cell count between 2.0 and 3.0 × 10⁹ l−1. Triple intrathecal chemotherapy (MTX, aracytine and hydrocortisone) was given on maintenance day 22 and was repeated every 10 weeks for six times with a high-dose MTX course for AR2 patients. This study focused on the six cycles of 10 weeks because RBC 6-MP metabolite concentrations were monitored when patients were admitted to hospital before their triple intrathecal chemotherapy. Measurements were planned at 4 ± 1 weeks and 14, 24, 34, 44, 54 (±2) weeks of maintenance therapy but were only obtained when the patient had a medical visit to our hospital. Patients were included in the analysis if they had at least three determinations of RBC metabolite concentrations among these six potential measurements.
Interruptions of chemotherapy (number of weeks per cycle for each drug) and toxicity were reported at each cycle of treatment. The grading scale used for adverse event (AE) evaluation was assessed using the National Cancer Institute Common Terminology Criteria (NCI CTC) version 2 [15]. This classification displays grades 1 through 5 with unique clinical descriptions of severity for each AE based on this general guideline: Grade 1, mild AE; Grade 2, moderate AE; Grade 3, severe AE; Grade 4, life-threatening or disabling AE and grade 5, death related to AE. The different grades of hepatotoxic events are presented in Table 1.
Table 1.
Classification of hepatotoxicity according to NCI-CTC v2.0
| Common toxicity criteria (CTC) | |||||
|---|---|---|---|---|---|
| Grade | |||||
| Adverse Event | 0 | 1 | 2 | 3 | 4 |
| HEPATIC | |||||
| Alkaline phosphatase | WNL | >ULN – 2.5 × ULN | >2.5–5.0 × ULN | >5.0–20.0 × ULN | >20.0 × ULN |
| Bilirubin | WNL | >ULN – 1.5 × ULN | >1.5–3.0 × ULN | >3.0–10.0 × ULN | >10.0 × ULN |
| Bilirubin associated with graft vs. host disease (GVHD) for BMT studies, if specified in the protocol. | Normal | ≥2 – <3 mg/100 ml | ≥3 – <6 mg/100 ml | ≥6 – <15 mg/100 ml | ≥15 mg/100 ml |
| GGT (γ-glutamyl transpeptidase) | WNL | >ULN – 2.5 × ULN | >2.5–5.0 × ULN | >5.0–20.0 × ULN | >20.0 × ULN |
| Hepatic enlargement | absent | – | – | present | – |
| Note: Grade hepatic enlargement only for treatment related adverse event including eno-occlusive disease. | |||||
| Hypoalbuminaemia | WNL | <LLN – 3 g dl−1 | ≥2 –<3 g dl−1 | <2 g dl−1 | – |
| Liver dysfunction/failure (clinical) | Normal | – | – | Asterixis | Encephalopathy or coma |
| Portal vein flow | Normal | – | Decreased portal vein flow | Reversal/retrograde portal vein flow | – |
| SGOT (AST) (serum glutamic oxaloacetic transaminase) | WNL | >ULN – 2.5 × ULN | >2.5–5.0 × ULN | >5.0–20.0 × ULN | >20.0 × ULN |
| SGPT (ALT) (serum glutamic pyruvic transaminase) | WNL | >ULN – 2.5 × ULN | >2.5–5.0 × ULN | >5.0–20.0 × ULN | >20.0 × ULN |
| Hepatic – Other (Specify,_________) | None | Mild | Moderate | Severe | Life-threatening or disabling |
ULN upper limit of normal; WNL within normal limits.
Sample collection and measurement of RBC 6-MP metabolites
Blood samples were collected in 2 ml EDTA tubes. Samples were kept cold in the dark until centrifugation at 4°C (2000 g for 5 min) to separate plasma and buffy coat from RBC. RBC were washed once with 2 ml of saline and packed by centrifugation for 5 min at 2000 g. A 100 µl packed RBC sample was subsequently used to count RBC (Pentra 120 counter; Horiba) to express thiopurine metabolite concentrations in pmol/8 × 108 RBC. 6-TGN and 6-MMPN concentrations were measured in packed RBC by a previously described HPLC technique [16].
Genotyping procedures
One blood sample (2 ml on EDTA) was collected to determine TPMT and ITPA genotypes. Genomic deoxyribonucleic acid (DNA) was extracted from blood samples using the QIAamp DNA Blood Midi kit (Qiagen, Chatsworth, CA) according to the manufacturer's instructions. Total genomic DNA was quantified using a NanoDrop® ND-1000 spectrophotometer (Labtech, France) at 260 nm. ITPA polymorphisms (ITPA 94 C > A, rs41320251 and ITPA IVS2+21 A > C, rs7270101) and the three predominant TMPT polymorphisms (TPMT*2 rs1800462, TPMT*3B rs1800460 and TPMT*3C rs1142345) were determined using a real-time TaqMan allelic discrimination method (ABI Prism 7700 SDS; Applied Biosystems, Foster City, CA). Primers and probes were obtained from Applied Biosystems.
Statistical analysis
Statistical analysis was conducted using SPSS® 15.0 (Windows, SPSS Inc. 1989–2004, Chicago, Illinois, USA) and for genetic analysis using Thesias software (version 3.1). Six individual covariates were analyzed in this study: the risk group (AR1 or AR2), sex (boy or girl), age group (≤6 years or >6 years), TPMT genotype (wild-type or carrier of one of the three predominant TPMT variants: TPMT*3B; TPMT*3C; TPMT*2), the ITPA 94 C > A and ITPA IVS2+21A > C genotypes (wild-type or heterozygous). We selected the cut-off of 6 years as it has previously been used to study 6-MP in paediatric patients [17]. All covariates were tested two by two by Pearson Chi-square test to evaluate the repartition of one covariate among another covariate. Gaussian distribution of quantitative measures (total duration of 6-MP interruptions, individual 6-TGN and 6-MMPN concentrations and mean 6-TGN or 6-MMPN concentrations per patient) or ordinal parameters (total number of hepatotoxicities or infections) were tested by the Z-Kolmogorov-Smirnov test. Depending on distribution of data, t-test or Mann–Whitney test were used to highlight differences between two independent groups for quantitative measures and correlations using Pearson or Spearman rank test for ordinal parameters. Statistical analysis for the kinetics of 6-MP metabolite concentrations was conducted using linear mixed models (one for 6-TGN concentrations and one for 6-MMPN concentrations) with SAS® software allowed the evaluation of the effect of individual covariates and the treatment time (cycle 1, 2, 3, 4, 5 or 6) in the same analysis. Receiver operating characteristics (ROC) curve analysis was used to predict toxic risk. The threshold of significance was fixed at 0.05.
Results
Patients (Table 2)
Table 2.
Demographic and treatment patients' characteristics
| Number (%) | |
|---|---|
| Demographic characteristics | |
| Total | 66 |
| Boys | 45 (68%) |
| Risk group | |
| AR1 | 49 (74%) |
| AR2 | 17 (26%) |
| Age at maintenance therapy | |
| ≤6 years | 37 (56%) |
| >6 years | 29 (44%) |
| Genotypes, WT/ HT | |
| TPMT | 60 (90%)/6 (10%) |
| ITPA 94C > A | 56 (86%)/9 (14%) |
| ITPA IVS2 + 21A > C | 48 (74%)/17 (26%) |
| Treatment interruptions and toxicity | |
| Treatment interruptions | |
| 6-MP | 53 (75%) |
| MTX | 47 (83%) |
| Infections | |
| 0 | 16 (24%) |
| 1 to 3 episodes | 37 (56%) |
| 4 to 6 episodes | 13 (20%) |
| Hepatotoxicity | |
| 0 | 10 (15%) |
| 1 to 3 episodes | 22 (33%) |
| 4 to 6 episodes | 34 (52%) |
AR average risk, TMPT thiopurine S-methyltransferase, ITPA inosine triphosphate pyrophosphatase, WT wild-type, HT carrier of one variant allele, 6-MP 6-mercaptopurine, MTX methotrexate.
A total of 66 children, with ALL aged 6.8 ± 3.9 years (range 1.7 to 16.1 years) were included in this study. The majority were in the AR1 arm.
Individual TPMT and ITPA genotypes were determined for all patients except for one patient who had insufficient DNA for ITPA genotypes. No mutated homozygous genotype has been found for all the SNPs studied. For TPMT, six patients were heterozygous: four were TPMT*1/*2, one was TPMT*1/*3A and one was TPMT*1/*3C. For the different ITPA polymorphisms, mutated allelic frequencies were 0.07 and 0.13 for ITPA 94 C > A and ITPA IVS2+21 A > C, respectively, without linkage disequilibrium. Only one patient had one variant allele for both ITPA SNPs. Furthermore, 34/65 (52%) patients were wild-type homozygous for both TPMT and ITPA polymorphisms. One patient had one variant allele for both genes and the remaining were heterozygous either for TPMT polymorphism (n = 6/66) or for ITPA polymorphism (n = 25/65). Genetic allele frequencies for both polymorphisms were in accordance with frequencies reported in the ALL population and genotype distributions were in Hardy-Weinberg equilibrium [18].
Individual covariates were cross-tested two by two and no significant disequilibrium between groups was evidenced.
Interruptions of 6-MP and/or MTX treatments were reported throughout maintenance therapy for 64/66 patients (data were missing in two patients). Only seven (11%) patients completed treatment without any drug interruption, 16 (25%) patients had no 6-MP interruptions and 11 (17%) had no MTX interruptions. Mean duration of interruption per cycle was 1.6 ± 1.0 (0.4–6) weeks for 6-MP and 1.6 ± 0.9 (1–7) weeks for MTX and the total duration of interruption was 3.5 ± 2.9 (0.7–14) weeks for 6-MP and 4.5 ± 3.1 (1–16) weeks for MTX corresponding for both drugs at 2 ± 2 cycles affected. Impact of covariates was evaluated on the total duration of 6-MP treatment interruptions and a difference between TPMT groups was highlighted: patients heterozygous for TPMT had more treatment interruptions than wild-type patients (median total duration 4.0 vs. 1.5 weeks, r = 0.29, P = 0.024).
Drug toxicity was recorded at each cycle for all patients throughout maintenance therapy. Only one patient (1/66; 1.5%) reported no AEs, 19 (29%) had grade 1–2 AEs and the remaining 46 had grade 3–4 adverse effects. Occurrence of AEs (all types and grades included) were correlated with interruptions of treatment (as binary variable) for the first three treatment cycles (r = 0.31, 0.28 and 0.26, respectively, P < 0.05). The number and type of toxicities were similar between each treatment cycle and the most frequent AEs were hepatotoxicity and infection (45% and 27%, respectively). The number of these events per patient throughout treatment is presented in Table 2. Infections were primarily grade 1–2 (only 4% were grade 3–4) and the number of infections was significantly higher in younger patients (<6 years) (median and range 2 (0–6) vs. 1 (0–4), respectively, P = 0.003). In contrast, hepatotoxic episodes were predominantly grade 3–4 (42%). Interestingly, 34 patients (52%) patients presented with four to six hepatotoxic episodes including 16 patients who developed hepatotoxicity at each cycle. None of the individual (non-genetic and genetic) covariates had an impact on the total number of hepatotoxicities.
Effect of individual covariates on RBC 6-MP metabolite concentrations during 15 months of ALL maintenance therapy
During the six cycles of maintenance therapy, 327 RBC 6-MP metabolite concentrations were analyzed (at least three determinations per patient, with 30 (45%) patients having a maximum of six measurements). Results of mixed-models are presented in Table 3. RBC 6-TGN and 6-MMPN concentrations reached steady-state at 4 ± 1 weeks with no difference in 6-MP metabolite concentrations between the different sampling time points. Gender, risk group and ITPA IVS2+21 A > C polymorphism had no influence on 6-MP metabolites concentrations.
Table 3.
Mixed model analysis of patients' covariates and selected genetic polymorphisms on variability of 6-mercaptopurine metabolites concentrations in red blood cells
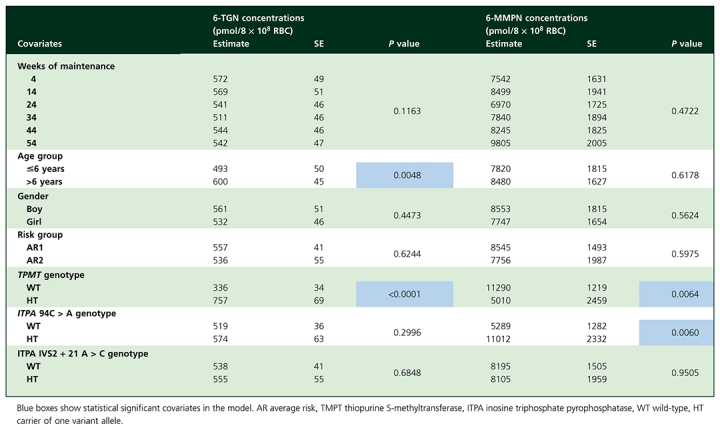 |
The 6-TGN mixed model revealed the impact of age and TPMT genotype on 6-TGN concentrations (Figure 1). Patients with a heterozygous TPMT genotype had 6-TGN concentrations 2.25 fold higher than wild-type patients. Furthermore, patients aged 6 years or younger had lower 6-TGN concentrations (82%) than patients older than 6 years. The combined effect of TPMT genotype and age could not be tested due to the small number of patients with a heterozygous TPMT and age >6 years (n = 3). The ITPA 94 C > A polymorphism had no influence on 6-TGN concentrations.
Figure 1.

A) RBC 6-TGN concentrations during maintenance therapy according to TPMT genotype. n number of patients without/with TPMT variant is indicated for each cycle. B) RBC 6-TGN concentrations during maintenance therapy according to patients' age. n number of patients below 6 years or over 6 years is indicated for each cycle.  represent median concentrations and bars include data between the 25th and 75th percentiles excluding the outliers. Grey lines are shifted slightly to the right compared with black lines so that error bars do not overlap. (A) Variant TPMT (n = 6) (
 ); Wild-type TPMT (n = 60) (
 ); (B) Age > 6 years (n = 29) (
 ); Age ≤ 6 years (n = 37) (
 )
)
Similarly, the 6-MMPN mixed model revealed the impact of TPMT and ITPA 94 C > A genotypes on 6-MMPN concentrations. Patients with a wild-type TPMT genotype had 2.25 fold higher 6-MMPN concentrations than patients carrying a variant genotype. Moreover, patients heterozygous for the ITPA 94 C > A polymorphism had 2.1 fold higher 6-MMPN concentrations than wild-type patients. The combined effect of TPMT and ITPA 94C > A polymorphisms (Figure 2) was analyzed on the mean 6-MMPN concentrations for each patient: the lowest 6-MMPN concentrations were observed in patients heterozygous for TPMT and wild-type for ITPA 94 C > A (mean 6-MMPN concentrations: 1862 pmol/8 × 108 RBC) compared with wild-type patients for both genes who had 4.5 fold higher concentrations (8344 pmol/8 × 108 RBC). The highest concentrations were reached for patients wild-type for TPMT and heterozygous for ITPA 94 C > A (16468 pmol/8 × 108 RBC). Age had no influence on 6-MMPN concentrations.
Figure 2.

A) RBC 6-MMPN concentrations during maintenance therapy according to TPMT genotype. n number of patients without/with TPMT variant is indicated for each cycle. B) RBC 6-MMPN concentrations during maintenance therapy according to ITPA genotype. n number of patients without/with ITPA variant is indicated for each cycle. Boxes represent median concentrations and bars include data between the 25th and 75th percentiles excluding the outliers. Grey lines are shifted slightly to the right compared with black lines so that error bars do not overlap. C) Mean RBC 6-MMPN concentrations during maintenance therapy according to the combined TPMT/ITPA C94A genotype. Boxes include data between the 25th and 75th percentiles, and bars represent the 5th and 95th percentiles. (A) Variant TPMT (n = 6) ( ); Wild-type TPMT (n = 60) (
 ); (B) Variant ITPA (n = 9) (
 ); Wild-type ITPA (n = 56) (
 )
)
RBC 6-mercaptopurine metabolite concentrations and hepatotoxicity episodes
The influence of 6-MP metabolite concentrations on the occurrence of hepatotoxicity during 15 months of ALL maintenance therapy was evaluated. No significant relationship was identified between 6-TGN concentrations and hepatotoxicity. However, patients with episodes of hepatotoxicity had higher 6-MMPN concentrations than patients without hepatotoxicity (Figure 3, Panel A). Furthermore, the mean 6-MMPN concentrations, for patients without hepatotoxicity (n = 10, 15%) was 3795 pmol/8 × 108 RBC, which was statistically different from 9807 pmol/8 × 108 RBC for patients with hepatotoxicity (n = 56, 85%) (Figure 3, Panel B).
Figure 3.

A) Boxes represent median level and the 25th and 75th percentiles, n number of patients without/with hepatotoxicity, P value of the statistical test are indicated for each cycle. B) Boxes represent median level and the 25th and 75th percentiles and bars include data between the 5th and 95th percentiles. This graph represents the dispersion of mean 6-MMPN concentrations in RBC for each patient depending on the occurrence of hepatotoxicities The black line indicates the threshold of RBC 6-MMPN concentrations at 5000 pmol/8 × 108 RBC. C) Specificity and sensibility curves of ROC analysis. Hepatotoxicity ( ); No hepatotoxicity (
 )
)
A predictive 6-MMPN concentration value of hepatotoxic risk was determined by ROC curve analysis. The area under the ROC curve was 0.82. The best sensitivity (80.4%) and specificity (80.0%) was defined for a 6-MMPN concentration threshold at 4884 pmol/8 × 108 RBC (Figure 3, Panel C): 2/10 non hepatotoxic patients had 6-MMPN concentrations >4884 pmol/8 × 108 RBC while 11/56 hepatotoxic patients had 6-MMPN concentrations <4884 pmol/8 × 108 RBC. Therefore, the positive and negative predictive values of this threshold were 95.7% and 42.1%, respectively. In addition, hepatotoxic patients having a mean 6-MMPN concentration below the threshold (‘false negative patients’) had 4.5 ± 4.4 weeks of total 6-MP interruption during maintenance therapy while those with hepatotoxicity and 6-MMPN concentrations above the threshold had 2.3 ± 2.4 weeks (P = 0.035).
Discussion
This study identified determinants of the high inter-individual variability of RBC 6-TGN and 6-MMPN metabolite concentrations during 6-MP and MTX maintenance therapy in childhood ALL. Our results show that in children 1) RBC 6-TGN concentrations are dependent on age and TPMT genotype, 2) RBC 6-MMPN concentrations are dependent on multilocus TPMT and ITPA 94 C > A genotypes and 3) high RBC 6-MMPN concentrations were associated with hepatotoxicity.
Individual TPMT genotype was determined in all patients as it is a major determinant of 6-MP intracellular equilibrium between pathways to 6-TGN and 6-MMPN. Therefore, the impact of individual covariates on 6-MP metabolite concentrations was adjusted for TPMT genotype and confirmed that inheritance of a variant allele explained part of the variability of RBC 6-MP metabolite concentrations. We also observed that patients carrying a heterozygous TPMT genotype had more interruptions of treatment with 6-MP than wild-type patients.
An age effect on RBC 6-TGN concentrations was demonstrated that has not previously been reported: 6-TGN concentrations at steady-state were lower in patients aged 6 years or less than in older patients, while treatment discontinuations were similar in both age groups. The reason for this age effect is unclear and probably not related to differences in TPMT activity, as it is reported not to be affected by age in children, from birth to adolescence [19]. One recent study in children with inflammatory bowel disease receiving 6-MP highlighted that patients 6 years and younger required higher doses to achieve clinical improvement [17]. The authors suggested that this might be related either to a reduced absorption or age-related differences in 6-MP metabolism associated with decreased formation of 6-TGN. Further investigations are warranted to determine if this difference in 6-MP metabolism between age groups is clinically relevant and if 6-MP dosage should be increased in younger children to obtain similar 6-TGN concentrations as in older patients. However the target concentration and therapeutic index for RBC 6-TGN during ALL maintenance therapy remains to be determined. The evaluation of efficacy might include measurements of 6-TGN incorporation into DNA [5, 20].
Furthermore, ITPA deficiency has been shown as a risk factor for 6-MP toxicity [21]. In our study, the ITPA 94 C > A genotype had an impact on RBC 6-MMPN concentrations. The variability of RBC 6-MMPN concentrations was explained by considering the multilocus TPMT and ITPA 94 C > A genotype: patients TPMT variant/ ITPA wild-type had the lowest 6-MMPN concentrations, patients wild-type for both polymorphisms had intermediate concentrations and those TPMT wild-type/ ITPA variant presented with the highest concentrations. The implication of ITPA polymorphism in the variability of RBC 6-MP metabolite concentrations was recently investigated, but only in small ALL groups. Hawwa et al. identified a potential impact of ITPA IVS2+21A > C on the mean RBC 6-TGN concentrations during the first 4 months of maintenance therapy but their population included only two heterozygous and one mutated homozygous compared with 17 wild-type patients. [22]. No impact of ITPA 94 C > A polymorphism was identified on 6-MP metabolites concentrations. Stocco and colleagues reported that patients carrying a multilocus TPMT variant/ITPA 94 C > A wild-type genotype had higher RBC 6-TGN concentrations compared with other groups but only four patients carried this genotype. [18] They also observed a significant combined effect of this multilocus TPMT and ITPA 94 C > A genotype on 6-MMPN concentrations. In the present study, we did not observe an impact of ITPA polymorphism on 6-TGN concentrations. This might be due to the lack of adjustment to TPMT genotype in Hawwa et al.'s study, which could have generated false positive results. However, our data support the involvement of ITPA 94 C > A polymorphism on 6-MMPN concentrations. It was reported that ITPA activity was nul in homozygous mutated patients and reduced to 25% of wild-type activity in heterozygous patients, a level of activity consistent with impaired assembly of a dimeric structure. The explanation of increased 6-MMPN concentrations is unclear, as it is only known that this reduced activity leads to the accumulation TITP, further methylated by TPMT and potentially leads to accumulation of 6-MMPN [23–25].
The monitoring of 6-MP metabolite concentrations is important not only to predict efficacy but also to improve tolerance. Hepatotoxicity and infection were the major adverse events accounting for 72% of all toxicities reported during maintenance therapy. In our population, age was the only covariate associated with the occurrence of infections, which were more frequent in younger patients. There was a strong association between 6-MMPN concentrations and the occurrence of hepatotoxicity. This relationship was already reported, as weighted means of aminotransferase concentrations were associated with RBC 6-MMPN concentrations in 43 children with ALL, while no association was detected with MTX plasma concentrations nor with intracellular MTX polyglutamates [26]. In the limited number of hepatotoxic patients presenting with 6-MMPN concentrations under the threshold, the role of co-administered drugs (such as MTX) or viral infections might explain the toxicity observed.
We determined that the 6-MMPN concentration threshold of 4884 pmol/8 × 108 RBC was predictive for hepatotoxic risk with a 95.7% positive predictive value. Hepatotoxicity occurring with 6-MMPN concentrations under the threshold may be explained by 6-MP dosage reductions or interruptions, as the total duration of 6-MP interruptions was higher in patients with low 6-MMPN concentrations than in patients with 6-MMPN concentrations above the threshold. Although it remains important to confirm our results, such threshold of 5000 pmol/8 × 108 RBC 6-MMPN will allow dosage adjustment to limit hepatotoxicity. A target threshold of 5700 pmol/8 × 108 RBC was identified in patients treated for inflammatory bowel disease. Even if ALL or inflammatory disease, in the context of treatment and co-medications are different, the two threshold values are close, making the data even more reliable. As MTX was reported to be more hepatotoxic than 6-MP, it is usually the first drug to be adjusted and even discontinued when a hepatotoxic event occurs. Thus, such a threshold will also avoid individual changes of MTX dosage, usually performed in such situations [27].
In conclusion, determination of TPMT genotype before treatment allows the identification of homozygote deficient patients at high risk of severe and life-threatening toxicity. In addition to white blood cell count, intracellular 6-MP metabolites will become useful markers to monitor 6-MP during ALL maintenance therapy [28]. Individual demographic and pharmacogenetic markers linked to pharmacokinetics will allow the individualization of drug administration and improve the outcome of paediatric patients with ALL. In the future, a multi gene-based approach might provide a more complete assessment of genetic differences implicated in the variability of treatment response and help to improve survival rates in children with ALL.
Acknowledgments
We thank the children and their parents for their participation in the present study and the medical and nursing staff who made this work possible. We all thank Stefan Suciu (EORTC) for constant support.
Competing Interests
There are no competing interests to declare.
REFERENCES
- 1.Rubnitz JE, Pui CH. Recent advances in the treatment and understanding of childhood acute lymphoblastic leukaemia. Cancer Treat Rev. 2003;29:31–44. doi: 10.1016/s0305-7372(02)00106-8. [DOI] [PubMed] [Google Scholar]
- 2.Pui CH, Pei D, Sandlund JT, Ribeiro RC, Rubnitz JE, Raimondi SC, Onciu M, Coustan-Smith E, Kun LE, Jeha S, Cheng C, Howard SC, Simmons V, Bayles A, Metzger ML, Boyett JM, Leung W, Handgretinger R, Downing JR, Evans WE, Relling MV. Treating childhood acute lymphoblastic leukemia without cranial irradiation. N Engl J Med. 2009;360:2730–41. doi: 10.1056/NEJMoa0900386. [DOI] [PMC free article] [PubMed] [Google Scholar]
- 3.Kishi S, Cheng C, French D, Pei D, Das S, Cook EH, Hijiya N, Rizzari C, Rosner GL, Frudakis T, Pui CH, Evans WE, Relling MV. Ancestry and pharmacogenetics of antileukemic drug toxicity. Blood. 2007;109:4151–7. doi: 10.1182/blood-2006-10-054528. [DOI] [PMC free article] [PubMed] [Google Scholar]
- 4.Rivera GK, Evans WE, Kalwinsky DK, Mirro J, Ochs J, Dow LW, Abromowitch M, Pui CH, Dahl GV, Look AT. Unexpectedly severe toxicity from intensive early treatment of childhood lymphoblastic leukemia. J Clin Oncol. 1985;3:201–6. doi: 10.1200/JCO.1985.3.2.201. [DOI] [PubMed] [Google Scholar]
- 5.Schmiegelow K, Schrøder H, Gustafsson G, Kristinsson J, Glomstein A, Salmi T, Wranne L. Risk of relapse in childhood acute lymphoblastic leukemia is related to RBC methotrexate and mercaptopurine metabolites during maintenance chemotherapy. Nordic Society for Pediatric Hematology and Oncology. J Clin Oncol. 1995;13:345–51. doi: 10.1200/JCO.1995.13.2.345. [DOI] [PubMed] [Google Scholar]
- 6.Dervieux T, Hancock M, Evans W, Pui CH, Relling MV. Effect of methotrexate polyglutamates on thioguanine nucleotide concentrations during continuation therapy of acute lymphoblastic leukemia with mercaptopurine. Leukemia. 2002;16:209–12. doi: 10.1038/sj.leu.2402373. [DOI] [PubMed] [Google Scholar]
- 7.Chabner BA, Allegra CJ, Curt GA, Clendeninn NJ, Baram J, Koizumi S, Drake JC, Jolivet J. Polyglutamation of methotrexate. Is methotrexate a prodrug? J Clin Invest. 1985;76:907–12. doi: 10.1172/JCI112088. [DOI] [PMC free article] [PubMed] [Google Scholar]
- 8.Bostrom B, Erdmann G. Cellular pharmacology of 6-mercaptopurine in acute lymphoblastic leukemia. Am J Pediatr Hematol Oncol. 1983;15:80–6. [PubMed] [Google Scholar]
- 9.Elion GB. The purine path to chemotherapy. Science. 1989;244:41–7. doi: 10.1126/science.2649979. [DOI] [PubMed] [Google Scholar]
- 10.Cheok MH, Evans WE. Acute lymphoblastic leukaemia: a model for the pharmacogenomics of cancer therapy. Nat Rev Cancer. 2006;6:117–29. doi: 10.1038/nrc1800. [DOI] [PubMed] [Google Scholar]
- 11.Colombel JF, Ferrari N, Debuysere H, Marteau P, Gendre JP, Bonaz B, Soulé JC, Modigliani R, Touze Y, Catala P, Libersa C, Broly F. Genotypic analysis of thiopurine S-methyltransferase in patients with Crohn's disease and severe myelosuppression during azathioprine therapy. Gastroenterology. 2000;118:1025–30. doi: 10.1016/s0016-5085(00)70354-4. [DOI] [PubMed] [Google Scholar]
- 12.McLeod HL, Krynetski EY, Relling MV, Evans WE. Genetic polymorphism of thiopurine methyltransferase and its clinical relevance for childhood acute lymphoblastic leukemia. Leukemia. 2000;14:567–72. doi: 10.1038/sj.leu.2401723. [DOI] [PubMed] [Google Scholar]
- 13.Sahasranaman S, Howard D, Roy S. Clinical pharmacology and pharmacogenetics of thiopurines. Eur J Clin Pharmacol. 2008;64:753–67. doi: 10.1007/s00228-008-0478-6. [DOI] [PubMed] [Google Scholar]
- 14.Schmiegelow K, Glomstein A, Kristinsson J, Salmi T, Schrøder H, Björk O. Impact of morning versus evening schedule for oral methotrexate and 6-mercaptopurine on relapse risk for children with acute lymphoblastic leukemia. Nordic Society for Pediatric Hematology and Oncology (NOPHO) J Pediatr Hematol Oncol. 1997;19:102–9. doi: 10.1097/00043426-199703000-00002. [DOI] [PubMed] [Google Scholar]
- 15.National Cancer Institute. Common Terminology Criteria for Adverse Events, version 2.0 (CTCAE) Published April 30, 1999. Available at: http://ctep.cancer.gov/protocoldevelopment/electronic_applications/docs/ctcv20_4-30-992.pdf.
- 16.Dervieux T, Meyer G, Barham R, Matsutani M, Barry M, Boulieu R, Neri B, Seidman E. Liquid chromatography-tandem mass spectrometry analysis of erythrocyte thiopurine nucleotides and effect of thiopurine methyltransferase gene variants on these metabolites in patients receiving azathioprine/6-mercaptopurine therapy. Clin Chem. 2005;51:2074–84. doi: 10.1373/clinchem.2005.050831. [DOI] [PubMed] [Google Scholar]
- 17.Grossman AB, Noble AJ, Mamula P, Baldassano RN. Increased dosing requirements for 6-mercaptopurine and azathioprine in inflammatory bowel disease patients six years and younger. Inflamm Bowel Dis. 2008;14:750–5. doi: 10.1002/ibd.20387. [DOI] [PubMed] [Google Scholar]
- 18.Stocco G, Crews KR, Evans WE. Genetic polymorphism of inosine-triphosphate-pyrophosphatase influences mercaptopurine metabolism and toxicity during treatment of acute lymphoblastic leukemia individualized for thiopurine-S-methyl-transferase status. Expert Opin Drug Saf. 2010;9:23–37. doi: 10.1517/14740330903426151. [DOI] [PubMed] [Google Scholar]
- 19.McLeod HL, Krynetski EY, Wilimas JA, Evans WE. Higher activity of polymorphic thiopurine S-methyltransferase in erythrocytes from neonates compared to adults. Pharmacogenetics. 1995;5:281–6. doi: 10.1097/00008571-199510000-00003. [DOI] [PubMed] [Google Scholar]
- 20.Hedeland RL, Hvidt K, Nersting J, Rosthøj S, Dalhoff K, Lausen B, Schmiegelow K. DNA incorporation of 6-thioguanine nucleotides during maintenance therapy of childhood acute lymphoblastic leukaemia and non-Hodgkin lymphoma. Cancer Chemother Pharmacol. 2009;66:485–91. doi: 10.1007/s00280-009-1184-5. [DOI] [PubMed] [Google Scholar]
- 21.Marinaki AM, Ansari A, Duley JA, Arenas M, Sumi S, Lewis CM, Shobowale-Bakre M, Fairbanks LD, Sanderson J. Adverse drug reactions to azathioprine therapy are associated with polymorphism in the gene encoding inosine triphosphate pyrophosphatase (ITPase) Pharmacogenetics. 2004;14:181–7. doi: 10.1097/00008571-200403000-00006. [DOI] [PubMed] [Google Scholar]
- 22.Hawwa AF, Collier PS, Millership JS, McCarthy A, Dempsey S, Cairns C, McElnay JC. Population pharmacokinetic and pharmacogenetic analysis of 6-mercaptopurine in paediatric patients with acute lymphoblastic leukaemia. Br J Clin Pharmacol. 2008;66:826–37. doi: 10.1111/j.1365-2125.2008.03281.x. [DOI] [PMC free article] [PubMed] [Google Scholar]
- 23.Arenas M, Duley J, Sumi S, Sanderson J, Marinaki A. The ITPA c.94C > A and g.IVS2 + 21A > C sequence variants contribute to missplicing of the ITPA gene. Biochim Biophys Acta. 2007;1772:96–102. doi: 10.1016/j.bbadis.2006.10.006. [DOI] [PubMed] [Google Scholar]
- 24.Krynetski EY, Krynetskaia NF, Yanishevski Y, Evans WE. Methylation of mercaptopurine, thioguanine, and their nucleotide metabolites by heterologously expressed human thiopurine S-methyltransferase. Mol Pharmacol. 1995;47:1141–7. [PubMed] [Google Scholar]
- 25.Sumi S, Marinaki AM, Arenas M, Fairbanks L, Shobowale-Bakre M, Rees DC, Rees DC, Thein SL, Ansari A, Sanderson J, De Abreu RA, Simmonds HA, Duley JA. Genetic basis of inosine triphosphate pyrophosphohydrolase deficiency. Hum Genet. 2002;111:360–7. doi: 10.1007/s00439-002-0798-z. [DOI] [PubMed] [Google Scholar]
- 26.Nygaard U, Toft N, Schmiegelow K. Methylated metabolites of 6-mercaptopurine are associated with hepatotoxicity. Clin Pharmacol Ther. 2004;75:274–81. doi: 10.1016/j.clpt.2003.12.001. [DOI] [PubMed] [Google Scholar]
- 27.Farrow AC, Buchanan GR, Zwiener RJ, Bowman WP, Winick NJ. Serum aminotransferase elevation during and following treatment of childhood acute lymphoblastic leukemia. J Clin Oncol. 1997;15:1560–6. doi: 10.1200/JCO.1997.15.4.1560. [DOI] [PubMed] [Google Scholar]
- 28.Hawwa AF, Millership JS, Collier PS, Vandenbroeck K, McCarthy A, Dempsey S, Collins J, Rodgers C, McElnay JC. Pharmacogenomic studies of the anticancer and immunosuppressive thiopurines mercaptopurine and azathioprine. Br J Clin Pharmacol. 2008;66:517–28. doi: 10.1111/j.1365-2125.2008.03248.x. [DOI] [PMC free article] [PubMed] [Google Scholar]