

Abstract
Alzheimer's disease (AD), one of the most dreaded neurodegenerative disorders, is characterized by cortical and cerebrovascular amyloid β peptide (Aβ) deposits, neurofibrillary tangles, chronic inflammation, and neuronal loss. Increased bone fracture rates and reduced bone density are commonly observed in patients with AD, suggesting one or more common denominators between both disorders. However, very few studies are available that have addressed this issue. Here, we present evidence for a function of amyloid precursor protein (APP) and Aβ in regulating osteoclast (OC) differentiation in vitro and in vivo. Tg2576 mice, which express the Swedish mutation of APP (APPswe) under the control of a prion promoter,1,2 exhibit biphasic effects on OC activation, with an increase of OCs in younger mice (< 4 months old), but a decrease in older Tg2576 mice (> 4 months old). The increase of OCs in young Tg2576 mice appears to be mediated by Aβ oligomers and receptor for advanced glycation end products (RAGE) expression in bone marrow macrophages (BMMs). However, the decrease of OC formation and activity in older Tg2576 mice may be due to the increase of soluble rage (sRAGE) in aged Tg2576 mice, an inhibitor of RANKL‐induced osteoclastogenesis. These results suggest an unexpected function of APPswe/Aβ, reveal a mechanism underlying altered bone remodeling in AD patients, and implicate APP/Aβ and RAGE as common denominators for both AD and osteoporosis. © 2011 American Society for Bone and Mineral Research.
Introduction
Alzheimer's Disease (AD) affects 10% of all people over 65 years of age. Its pathology is characterized by cortical and cerebrovascular amyloid β peptide (Aβ) deposits, neurofibrillary tangles, chronic inflammation, and neuronal loss.3 Although not described as one of the major complications of AD, increased bone fracture rates are frequently observed in patients with AD,4, 5 suggesting a link between both disorders. However, very few studies in the literature have addressed this problem.
Amyloid precursor protein (APP) is a widely expressed single transmembrane protein. Its physiological role remains unclear; however, its contribution to the pathogenesis of AD has been extensively studied. Mutations in the APP gene are found in early‐onset AD. Many risk factors or genes associated with late‐onset AD appear to affect APP protein trafficking and/or Aβ production.6 Overexpression of the human mutant form of APP in mice has provided powerful tools for pathological studies in which age‐dependent onset of plaque formation and age‐dependent impairments of certain forms of memory formation have been demonstrated.7, 8 Aβ, a 40‐ to 42‐amino acid peptide derived from APP cleavage by β‐ and γ‐secretases, appears to contribute to the neurodegenerative process and plaque formation in AD.9, 10 Multiple forms of Aβ have been reported, and prefibrillar and/or soluble oligomers of Aβ have been recognized as early and key intermediates in AD‐related synaptic dysfunction.6, 11, 12 Whereas APP and Aβ function in the brain are well studied, their functions in non‐neurons in both nonpathological and pathological conditions remain largely unclear.
The receptor for advanced glycation end products (RAGE), acting as an Aβ binding partner, is implicated in the pathogenesis of AD.13, 14 The full length of RAGE comprises a variable (V) and two constant extracellular immunoglobin (Ig)‐like domains, a transmembrane region, and a short cytoplasmic tail. The V domain is believed to be involved in ligand binding.15, 16, 17 RAGE is expressed as multiple isoforms, including full‐length RAGE and esRAGE, a secreted isoform without transmembrane domain and intracellular tail.18 Rage not only binds to Aβ but also interacts with diabetes‐associated advanced glycation end products (AGE),19 proinflammatory‐associated Mac‐1/β2 integrin,20 the S100 family,21 and the high mobility group box 1(HMGB1).22 RAGE is thus implicated in the pathogenesis of multiple chronic inflammation‐ and age‐related disorders. The adverse consequences of RAGE activation in AD is believed to primarily result from its interaction with AD‐associated Aβ; excess amounts of Aβ trigger elevated RAGE expression, further enhancing the detrimental effects of RAGE activation.23 In line with this view, RAGE is found to be increased in AD‐affected regions of the brain, such as the hippocampus and superior frontal cortex.14, 24, 25, 26 RAGE is increased not only in neurons and microglia but also in cortical amyloid‐laden vessels of cerebral amyloid angiopathy (CAA) patients and in hippocampal microvessels of AD patients.14, 24, 25, 26 Whereas RAGE level is increased in AD patients and in AD animal models, which isoform of RAGE is increased and the mechanisms underlying this event remain to be investigated.
We have identified a critical role for RAGE in osteoclast (OC) maturation and activation.27 Mice lacking RAGE display increased bone mass and mineral density and decreased bone resorptive activity in vivo.27 In vitro, differentiated RAGE mutant OCs exhibit impaired terminal differentiation and reduced bone resorptive activity.27 These results suggest an important role for RAGE in regulating OC maturation and activation in vitro and in vivo.27 We thus have further investigated functions of RAGE ligands in OC differentiation and activation and have demonstrated that HMGB1, a proinflammatory cytokine released from activated macrophages, promotes RANKL‐induced OC differentiation in a RAGE‐dependent manner.28 The RAGE ligands AGE and S100 are also found to be involved in regulating osteoclast differentiation directly or indirectly.29, 30 However, the function of Aβ in OC differentiation and activation is unknown.
Here we present evidence for the Swedish mutation of APP (APPswe) and Aβ in regulating OC differentiation in vitro and in vivo. Age‐dependent biphasic effects on OC differentiation and activation were observed in Tg2576 mice, with an increase in younger mutant mice (<4 months old) but a decrease in older Tg2576 mice (>4 months old). We investigated potential mechanisms underlying the biphasic effects of APPswe and demonstrated that soluble Aβ oligomers, via RAGE, enhance RANKL‐induced in vitro osteoclastogenesis. However, the decrease of OC formation and activity in older Tg2576 mice appeared to correlate with an age‐dependent increase of soluble RAGE (sRAGE) or endogenous secretory RAGE (esRAGE) expression. We further provided evidence for this view by injection of sRAGE into young Tg2576 mice (2 months old) that reduced OC formation in vivo and in vitro. These results suggest that the increased sRAGE may contribute to the decrease of OC formation and activity in older (>4 months) Tg2576 mice. Taken together, our results show an age‐dependent regulation of osteoclast activation and RAGE expression by APPswe/Aβ and provide a mechanism underlying altered bone remodeling of AD patients.
Materials and Methods
Reagents and animals
APP antibody (rabbit polyclonal) was purchased from Cell Signaling (Danvers, MA, USA), and Aβ antibody (monoclonal, 6E10) was purchased from Sigma‐Aldrich (St. Louis, MO, USA). RAGE antibodies were purchased from R&D Systems (monoclonal [mAb] 11451 and goat polyclonal [pAb] 1145) and from Chemicon International (mAb 5328; Billerica, MA, USA). Rabbit polyclonal anti‐RAGE antibodies were also generated using the fusion protein of glutathione‐S‐transferase (GST)–RAGE‐C‐terminal tail as the antigen, as described previously.27
Murine macrophage colony‐stimulating factor (M‐CSF) was obtained from R&D Systems (Minneapolis, MN, USA). Recombinant GST‐RANKL and sRAGE proteins were generated and purified as previously described.27, 28, 31, 32 These recombinant proteins were repurified using a polymyxin B affinity column to remove contaminating lipopolysaccharide (LPS). Human Aβ (1‐42) (from AnaSpec, Fremont, CA, USA) was used. In some experiments, the diluted Aβ (1‐42) was sonicated at 15 amplitude (75 W), 15 sec × 6, and filtered by 0.22 µm membrane (Millipore, Billerica, MA, USA) to remove oligomers or aggregates of Aβ.
Tg2576 mice (purchased from Taconic, Hudson, NY, USA) and RAGE mutant mice (obtained from Dr. Bernd Arnold, German Cancer Research Center, Heidelberg, Germany) have been crossed into C57BL/6 genetic background. BACE mutant mice in C57BL/6 background were obtained from Dr. Riqiang Ran, Cleveland Clinic, OH, USA.33, 34, 35 All experiments with Tg2576 mice used the littermates from the breeding of Tg2576 × C57BL/6. Thus, age‐matched wild type (WT) and mice with a single copy of the transgene Tg2576 mice were compared. All experimental procedures were approved by the Animal Subjects Committee at the Medical College of Georgia, in accordance US National Institutes of Health guidelines.
Bone histomorphometric analysis
The bone histomorphometric analyses were carried out as previously described.27 In brief, mouse tibias and femurs were fixed overnight in 10% buffered formalin, decalcified in 14% EDTA, and embedded in paraffin, sectioned, and stained for tartrate‐resistant acid phosphatase (TRAP) with a methyl green counterstain. Bone histomorphometric parameters were determined by measuring the areas situated at least 0.5 mm from the growth plate, excluding the primary spongiosa and trabeculas connected to the cortical bone.
In vivo bone resorption assay
Mouse bone resorption activity was determined by measuring serum pyridinoline cross‐link (Pyd) concentration using METRA Serum PYD EIA kit (Quidel, San Diego, CA, USA) as previously described.27 In brief, filtered serum samples (25 µL) were incubated with 75 µL Pyd antibody and reagent overnight at 4°C in the dark. After washing three times, samples were incubated with enzyme conjugate for 60 minutes at room temperature. Substrate solution (150 µL) was added to samples after washing and incubated at room temperature for 40 minutes. The reaction was stopped, and the OD was measured at 405 nm. OD was then converted to Pyd concentration using a standard curve. All the samples were measured in duplicate and values were subjected to statistical analysis.
In vitro osteoclastogenesis assay
Mouse bone marrow macrophages (BMMs), prefusion osteoclasts (pre‐OCs), and OCs were generated as previously described.27 In brief, whole bone marrow cells were flushed from the long bones of 4‐ to 6‐week‐old WT, Tg2576, BACE, or RAGE mutant mice and plated on 100 mm tissue culture plates in α‐MEM containing 10% FBS and 10 ng/L recombinant M‐CSF (R&D Systems). Cells were incubated at 37°C with 5% CO2 overnight. Nonadherent cells were harvested and subjected to Ficoll‐Hypaque gradient centrifugation for purification of BMMs. Isolated BMMs were then cultured in α‐MEM containing 10% FBS plus 10 ng/mL recombinant M‐CSF. To generate pre‐OCs, BMMs were cultured in α‐MEM containing 10% FBS in the presence of 10 ng/mL recombinant M‐CSF and 100 ng/mL recombinant RANKL for 2 to 3 days. To generate mature OCs, 5 × 10⁴ BMMs were plated in one well of a 24‐well plate in α‐MEM containing 10% FBS in the presence of 10 ng/mL recombinant M‐CSF and 100 ng/mL recombinant GST‐RANKL for more than 3 days. Mature osteoclasts (multinucleated, large, spread cells) began to form at day 4 of culture. The identity of osteoclasts was confirmed by TRAP staining.
Injection and treatment protocol
Mice (2 months old, WT and Tg2576 female) were injected intraperitoneally (IP) with 100 µg/day sRAGE or with the same volume of phosphate buffered saline (PBS) for 5 days. Mouse femurs were used for bone histomorphometric analysis, and bone marrow macrophages were also isolated for RANKL‐induced osteoclastogenesis assay.
Western blot analysis
BMMs and pre‐OCs were cultured and then starved overnight in serum‐free media. Cells were stimulated with RANKL or Aβ for the indicated times followed by lysis in radio‐immunoprecipitation assay (RIPA) buffer. For sRAGE secretion, cultured media were collected. Lysates and/or media were subjected to SDS‐PAGE and immunoblotting analysis using the indicated antibodies. In addition, lysates from mouse tissues or whole bone marrow cells flushed out from mouse long bones were also subjected to Western blot analysis.
RT‐PCR analysis
Total RNA was prepared from indicated tissues or cells using Trizol (Invitrogen, Carlsbad, CA, USA). The cDNAs were synthesized from 2 µg of total RNA using SuperScript III First Strand Synthesis System (Invitrogen) in a volume of 20 µL. The reaction mixture was adjusted to 100 µL with distilled water. 1 µL of cDNA was amplified with the specific primers indicated by PCR. The PCR product was separated on a 1.5% agarose gel and visualized by ethidium bromide staining. The following primers were used:
mRAGE F1: 5'‐TTGGAGAGCCACTTGTGCTA‐3'
mRAGE R2: 5'‐GACCCTGATGCTGACAGGAG‐3'
mRAGE F2: 5'‐CTCAGGTCCACTGGATAAGG‐3'
mRAGE R3: 5'‐CCTCATCCTCCTGGCTTTCCGG‐3'
mRAGE F3: 5'‐CAGCTGAAGGTGAGGACTGGAC‐3'
RANKL F1: 5'‐GACTCGACTCTGGAGAGT‐3'
RANKL R1: 5'‐GAGAACTTGGGATTTTGATGC‐3'
OPG F1: 5'‐TGGAGATCGAATTCTGCTTG‐3'
OPG R1: 5'‐TCAAGTGCTTGAGGGCATAC‐3'
GAPDH F1: 5′‐CAAGGTCATCCATGACAACTTTG‐3′
GAPDH R1: 5′‐GTCCACCACCCTGTTGCTGTAG‐3′
Statistical analysis
Data were analyzed using an unpaired two‐tailed Student's t‐test and are expressed as the mean ± SEM. P values less than .05 were considered significant.
Results
Age‐dependent regulation of OC activation and bone mass in Tg2576 mice
To assess the potential role of APP in bone remodeling, we took advantage of the transgenic animal model for AD, Tg2576, which expresses the Swedish mutation of APP under the control of a prion promoter.1, 2 APP was ubiquitously expressed in different tissues, including in BMMs and OCs derived from both wild type and Tg2576 mice (Fig. 1A, B ). An approximately 2‐ to 3‐fold increase of APPswe protein in BMMs and OCs from Tg2576 mice was observed (Fig. 1 B). OC differentiation in vivo was then examined by TRAP staining analysis of wild type and Tg2576 femurs and tibias at different ages. The number of OCs per unit resorptive surface was unchanged between wild type and Tg2576 mice at age 1 month (Fig. 1C, D ). However, the OC number was slightly increased in 4‐month‐old Tg2576 tibias and femurs, but the size of individual TRAP+ cells appeared to be smaller (Fig. 1C, D ). Interestingly, this increase of OCs in vivo was not observed in mutant mice after age 6 months (Fig. 1 D). Instead, a significant reduction in OC number per resorptive area was observed in 1‐year‐old Tg2576 mice as compared with the same age wild type control (Fig. 1C, D ). In line with these observations, serum Pyd, an indicator of bone resorption (collagen matrix degradation) in vivo, was slightly increased in 2‐ to 4‐month‐old Tg2576 mice but decreased after 6 months (Fig. 1 E). Together, these results suggest that expression of APPswe in vivo resulted in biphasic effects on OC differentiation and activation, with an increase in younger (before 4 months of age) but a decrease in aged Tg2576 mice (after 4 months).
Figure 1.
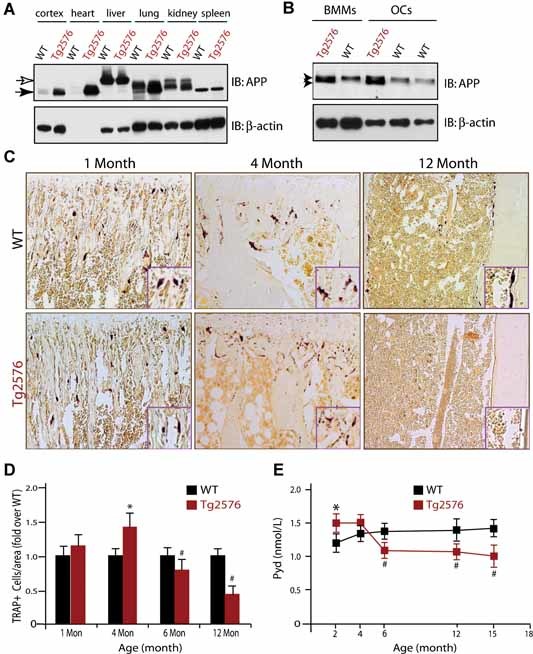
Age‐dependent effects on OC formation and activity in Tg2576 mice. (A,B) Western blot analysis of APP protein expression in different tissues of adult wild type and Tg2576 mice (A) and in BMMs and OC cells derived from wild type and Tg2576 mice (B). ∼50 µg lysates from indicated tissue or cell homogenates were loaded onto SDS‐PAGE and subjected to Western blot analysis using indicated antibodies. (C,D) Tartrate‐resistant acid phosphatase (TRAP) staining analysis of OCs in different‐aged Tg2576 mice. Sections of femurs from WT and Tg2576 mice at indicated age were stained for TRAP activity (purple) to identify OCs. The data were quantified and illustrated in (D). (E) Measurement of serum Pyd levels in different‐aged WT and Tg2576 mice by RIA. In (D) and (E), Mean ± SD from 3 different samples (n = 3) are shown. * and #, p < .05, a significant difference from WT control (Student's t‐test).
We next determined whether APPswe regulates osteoclast differentiation and function in vivo by examining bone mass in Tg2576 mice, because osteoclasts play a critical role in maintenance of healthy bone. Microcomputer tomographic (µCT) analyses showed a decrease in the density of trabecular bone in the metaphyseal region of femurs in 2‐month‐old but not 8‐month‐old Tg2576 mice (Fig. 2A–D ), suggesting an age dependency. However, the trabecular bones in spines of Tg2576 mice were reduced at both 2 months and 8 months of age (Fig. 2C–E ). The reduction of bone density in spines but not long bones (eg, femur) in aged Tg2576 mice was also supported by PIXImus densitometric analysis (GE Medical Systems, Buckinghamshire, UK), which showed a significant decrease in bone mineral density (BMD) of vertebrae/spine bones but not femurs or whole bones, in 1‐year‐old Tg2576 mice, compared with that of age‐ and strain‐matched WT mice (Fig. 2 F). These phenotypes, an age‐ and region‐dependent reduction of bone density, are in line with the observation for an increase of osteoclast differentiation and function in femurs from young (eg, 2‐month‐old) but not aged (eg, 8‐month‐old) Tg2576 mice.
Figure 2.

Age‐dependent reduction of bone mass in Tg2576 mice. (A) µCT images of femurs isolated from 2‐ and 8 month‐old control C57BL/6 (WT) and Tg2576 male mice. (B) Cross‐section images at the position (red line) of femurs shown in (A). Note a reduction of bone volume in 2‐month‐old but not in 8‐month‐old Tg2576 femurs. (C) Three‐dimensional images of trabecular bones of femurs (metaphyseal region) and spines from 2‐ and 8‐month‐old WT and Tg2576 mice. (D,E) Quantitative analysis of the ratio of BV/TV of trabecular bones at metaphyses (D) and spines (E). Again, a reduction in bone volume of trabecular bones was noted in 2‐month‐old but not 8‐month‐old Tg2576 metaphyseal regions of femurs (D). In spines, bone volume was reduced in both 2‐ and 8‐month‐old Tg2576 mice (E). tb, trabecular bone. (F) PIXImus densitometric analysis of the BMD of whole bone mass (total), spines, and femurs from 12‐month‐old WT and Tg2576 mice. Mean ± SD from 3 different animals (n = 3) are shown. *p < .05, a significant difference from the WT control (Student's t‐test).
Aβ increase of OC formation and activity in vitro
We next examined whether APPswe regulates OC formation in vitro. To this end, BMMs from adult Tg2576 and WT mice (the latter ∼2 months old, as a control) were subjected for RANKL‐induced in vitro osteoclastogenesis assay, as previously described27, 28 An increase in TRAP+ cells, an indicator of OC formation, was observed at days 2–3 of RANKL treatment in BMMs from Tg2576 mice (Fig. 3A, B ). However, this increase appeared to be transient and cell density dependent. By day 5 of RANKL treatment, no difference of TRAP+ cells was observed between wild type and mutant culture (Fig. 3A, B ). At a lower density of BMM culture, no increase in OCs was observed in BMMs from Tg2576 mice (Fig. 3 C). To assess whether the transient increase of OC cells leads to an increase of OC activity, we carried out an in vitro resorption assay. Indeed, an increase of resorbing activity was observed in both day 4 and day 8 cultures of APPswe+ OCs (Fig. 3D, E ). Moreover, the APPswe+ OCs (even at day 10 of culture) appeared to have normal morphology, based on their TRAP staining and actin ring structures (Fig. 3 E), implicating APPswe's minimal effect, if any, on OC death or survival.
Figure 3.
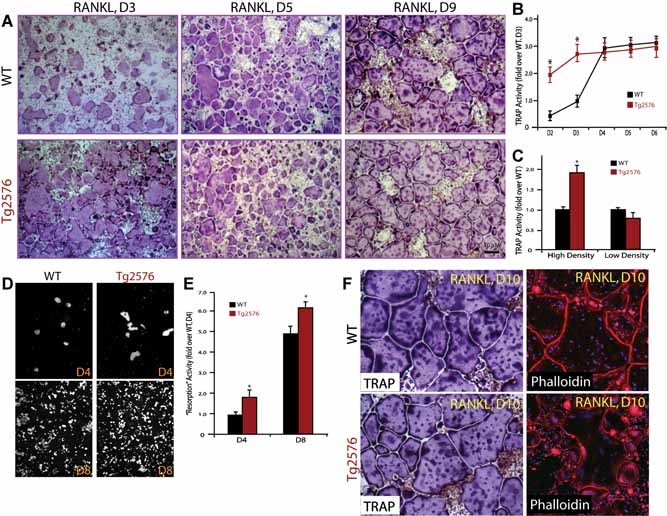
Transient increase of in vitro osteoclastogenesis in BMMs derived from Tg2576 mice. (A) Tartrate‐resistant acid phosphatase (TRAP) staining analysis of in vitro osteoclastogenesis from BMMs derived from WT and Tg2576 mice at indicated days of RANKL (100 ng/mL) treatment. BMMs at the same density (5 × 10⁵/well) from 1‐month‐old WT and Tg2576 mice were cultured for 3 days in the presence of 10% M‐CSF. RANKL (100 ng/ml) was then added for the indicated days. (B) Quantitative analysis of the average TRAP activity during in vitro osteoclastogenesis for the indicated days. D2, day 2 of RANKL treatment. (C) Quantitative analysis of the average TRAP activity of in vitro osteoclastogenesis using a high (5 × 10⁵/well) and a low (105/well) density of BMMs from 1‐month‐old WT and Tg2576 mice. Data obtained are from day 4 culture. In (B,C), BMMs were treated with 100 ng/mL RANKL. Means ± SD from 3 different cultures (n = 3) are shown. *p < .05, a significant difference from WT (Student's t‐test). (D,E) In vitro resorptive activity in WT and APPswe‐OCs cultured for 4 and 8 days after RANKL treatment. The resorbing activity was quantified based on total resorbing area, which is normalized by WT control (E). Mean ± SD from 2 different experiments (n = 2) are shown. *p < .05, a significant difference from WT control (Student's t‐test). (F) Relatively normal osteoclast morphology was revealed by TRAP and phalloidin staining analyses. Cells were cultured in the presence of RANKL (100 ng/mL) for 10 days (D10).
Because Aβ, produced in Tg2576 mice, is believed to be a major inducer of the pathogenesis of AD, we next examined whether Aβ is involved in the transient increase of OC differentiation in Tg2576 mice and in culture. To this end, in vitro osteoclastogenesis with purified BMMs was analyzed in the presence or absence of Aβ42 peptide. Aβ did increase the number of TRAP+ OCs (Fig. 4A, D ). Several characteristics of this effect were noted. First, it is dose dependent. In the presence of a permissive concentration (10 ng/mL) of RANKL, the optimal dose of Aβ induction of OC is ∼ 1 µM (Fig. 4C, D ), but the optimal dose for Aβ induction of OC formation decreased to ∼0.1–0.5 µM when 100 ng/mL RANKL was used (Fig. 4A, B ). Second, Aβ induction of OC formation was a transient event, increasing in the earlier phase but not in the late phase of in vitro osteoclastogenesis (Fig. 4E, F ). These results are in line with observations of in vitro osteoclastogenesis using BMMs derived from Tg2576 mice (Fig. 3), implicating Aβ generated from APPswe‐expressing bone cells in contributing to the transient increase of TRAP+ cells.
Figure 4.
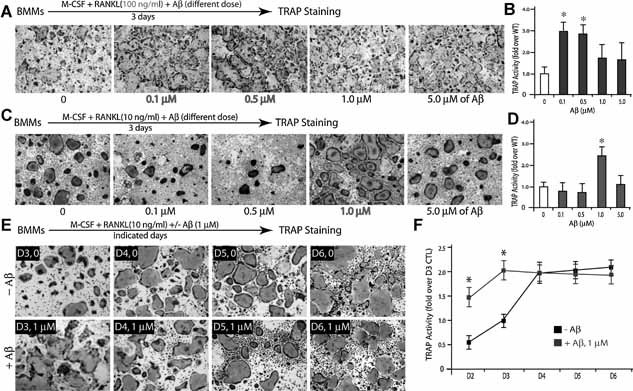
Transient increase of in vitro osteoclastogenesis by exogenous Aβ. (A,B) Dose‐dependent Aβ effect on RANKL‐induced osteoclastogenesis. BMMs (5 × 10⁵/well) were treated with 44 ng/mL M‐CSF, 100 ng/mL RANKL, and indicated doses of Aβ for 3 days. The images are shown in (A), and the tartrate‐resistant acid phosphatase (TRAP) activity is quantified and illustrated in (B). Note that Aβ (0.1–0.5 µM) enhanced RANKL induced TRAP activity (*p < .05, a significant difference from WT control). (C,D) Dose‐dependent Aβ effect on in vitro osteoclastogenesis in the presence of permissive concentration of RANKL (10 ng/mL). Note that 1 µM Aβ increased TRAP activity significantly (*p < .05, a significant difference from WT control). (E,F) Time‐dependent Aβ effect on osteoclastogenesis. BMMs were treated with 44 ng/mL M‐CSF, 10 ng/mL RANKL, and 1 µM Aβ for the indicated days. The images are shown in (E), and the TRAP activity is quantified and illustrated in (F). Note that Aβ increased RANKL‐induced TRAP activity only at day 3 (*p < .05, a significant difference from WT control). In (A) to (E), all of the cultures were stained for TRAP activity. Each condition had three replicates (wells). A representative area of the cultures from each condition is shown.
To further support this view, we examined in vitro osteoclastogenesis in BMMs derived from BACE/β‐secretase mutant mice, in which Aβ generation is abolished.36 A decrease of TRAP+ cells was observed at days 3–4 of RANKL treatment of BACE−/− culture (Supplemental Fig. 1A, B). By the day 5 of RANKL treatment, a slightly increase of TRAP activity was observed in the mutant culture (Supplemental Fig. 1A, B). These results suggest that BACE is required for enhancing the initial phase of RANKL‐induced OC formation, supporting the view that Aβ generation from BMMs enhances the early phase of OC differentiation.
Aβ increase of OC formation is dependent on Aβ oligomerization and RAGE
It is believed that the soluble Aβ oligomer, but the not monomer, is a major neurotoxic agent in the pathogenesis of AD.11 We thus asked whether different forms of Aβ have different effects on OC differentiation. Soluble Aβ monomers were produced by filtration of Aβ oligomers (Fig. 5 A). Their effects on in vitro osteoclastogenesis were compared. Remarkably, Aβ monomers were unable to enhance OC formation from BMMs in the presence of permissive concentration of RANKL (Fig. 5B–D ), suggesting a dependency on Aβ oligomerization.
Figure 5.
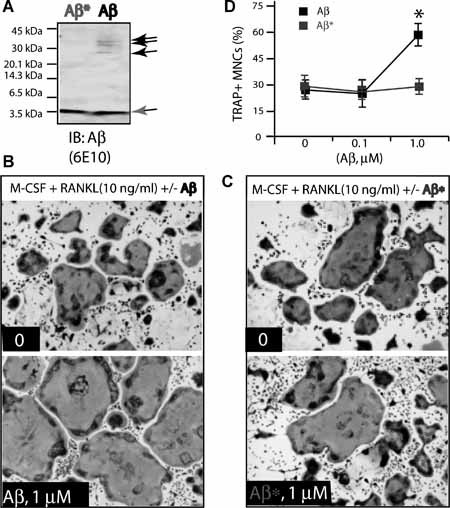
Failure to increase OC formation by Aβ “monomers.” (A) “Oligomeric” and “monomeric” Aβs were revealed by Western blot analysis using 6E10 antibody. Biotin‐conjugated Aβ42 peptides (50 µg/mL) were filtered through the membrane. Equal volumes of filtered and unfiltered Aβs were loaded onto the SDS‐PAGE. Aβ = unfiltered Aβ, which contains both oligomeric (indicated by black arrows) and monomeric forms; Aβ* = filtered/monomeric form indicated by a gray arrow. (B,C) 1 µM Aβ (B), but not the “monomeric” form of Aβ* (C), promotes OC formation from BMMs in the presence of a permissive concentration of RANKL. Tartrate‐resistant acid phosphatase (TRAP) staining images at day 3 culture are shown. (D) Quantification of TRAP+ multinucleated cells based on data from (B,C). Mean ± SD from 3 different experiments (n = 3) are shown. *p < .05, a significant difference from Aβ* treatment (Student's t‐test).
RAGE is believed to be an Aβ receptor in mediating Aβ‐induced cell signaling and changes in cellular behavior.24, 37, 38 RAGE is also required for RANKL‐induced OC maturation and activation in vivo and in vitro.27 We thus investigated the role of RAGE in Aβ‐induced osteoclastogenesis in vitro. BMMs derived from wild type and RAGE−/− mice were used for the treatment. Aβ induction of the TRAP+ OCs was abolished in RAGE−/− culture but not in W, culture (Fig. 6A, C ), indicating RAGE dependence and supporting the view for Aβ oligomer‐RAGE signaling in the induction of OC differentiation.
Figure 6.
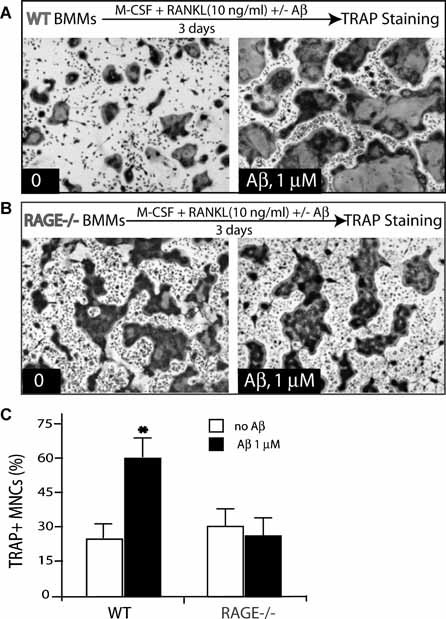
Requirement of RAGE for Aβ‐induced OC formation. (A,B) Aβ (at 1 µM) induced osteoclastogenesis in BMMs (105/well) from WT (A) and RAGE−/− (B) mice in the presence of a permissive concentration of RANKL. Aβ stimulates osteoclastogenesis in WT but not in RAGE−/− BMMs. (C) Quantitative analysis of the average tartrate‐resistant acid phosphatase (TRAP) activity during in vitro osteoclastogenesis. Mean ± SD (n = 3) are shown. *p < .05, a significant difference from control (without Aβ treatment) (Student's t‐test).
Increase of soluble RAGE expression in aged Tg2576 mouse tissues
To investigate mechanisms underlying the decrease of OCs in aged Tg2576 mice, we compared the expression level of several proteins involved in osteoclastogenesis (eg, RANKL, OPG, RAGE, and esRAGE) in various tissues of 4‐month‐old WT and Tg2576 mice. Whereas RANKL and GAPDH transcripts were expressed at a comparable level in various tissues between WT and Tg2576 mice, the full‐length RAGE, to our surprise, was regulated in a tissue‐specific manner, decreasing in the brain and heart, but increasing in the liver and muscle of Tg2576 mice (Supplemental Fig. 2A, B). We then measured the level of esRAGE and found that it was increased in various tissues of Tg2576 mice, including brain, heart, liver, and muscle (Supplemental Fig. 2A, B). These results demonstrate an increase of sRAGE and/or esRAGE transcripts in various tissues of 4‐month‐old Tg2576 mice. In addition to sRAGE, OPG, an inhibitor of RANKL, was also significantly increased in multiple tissues (eg, brain, heart, liver, and lung) in 4‐month‐old Tg2576 mice (Supplemental Fig. 2A, C). We next examined RAGE protein level in various tissue lysates from WT and Tg2576 mice at different ages. RAGE protein (detected by mAb 5328) was at a comparable level in various tissues of 2‐month‐old Tg2576 mice and WT controls of the same age (Supplemental Fig. 3A). However, it was increased in all of the tissues examined in Tg2576 mice at 4 months or older (Supplemental Fig. 3B, C). Because the epitope of the antibody (mAb 5328) is located at the extracellular domain of RAGE, it could not distinguish sRAGE from membrane RAGE. We thus compared RAGE immunoreactivity in lysates from the lungs of wild type and Tg2576 mice using 4 different RAGE antibodies (Supplemental Fig. 3D). Those antibodies, recognizing epitopes at different sites of RAGE (Supplemental Fig. 4A), were specific, because they failed to recognize major RAGE bands in the mutant lung tissues (Supplemental Fig. 4B). Two monoclonal antibodies (5328 and 11451), whose epitopes are located at the RAGE extracellular domain, showed an increase of RAGE immunoreactivity in Tg2576 mice (Supplemental Fig. 3D). By contrast, two polyclonal antibodies, including one that recognizes RAGE intracellular domain (rabbit pAb) and one for extracellular domain (goat pAb), failed to detect any increase in the same lysates (Supplemental Fig. 3D). These results, in line with the RT‐PCR analysis, support the view for an increase of sRAGE isoform(s), but not membrane RAGE, in Tg2576 mouse tissues. In addition, an increase of sRAGE in serum of 1‐year‐old but not younger Tg2576 mice was also observed by ELISA analysis (Supplemental Fig. 3E, F), further supporting this view.
Increase of sRAGE in Tg2576 bone marrow and enhanced RAGE shedding in APPswe‐expressing cells
We then compared RAGE or sRAGE protein level in bone marrow (BM) from 2‐ and 8‐month‐old WT and Tg2576 mice. Whole BM cells were flushed out from WT and Tg2576 long bones with PBS and centrifuged to separate cells (in pellet) from fluid (supernatant). Western blot analysis showed that RAGE was in large part detected in the supernatant but not in the pellet of BMs (Fig. 7 A), implying the presence of sRAGE in BMs. This RAGE or sRAGE was increased in aged BMs (8‐month BMs showed higher levels than 2‐month BMs) and further increased in aged Tg2576 BMs compared to the same‐age WT control (Fig. 7 A). We then examined RAGE level in primary cultured BMMs and OCs. A reduction of RAGE protein levels was observed in lysates of BMMs and OCs from Tg2576 mice as compared with the WT control (Fig. 7 B). However, the sRAGE in the medium of BMMs from Tg2576 mice was increased (Fig. 7 C). These results are in agreement with the observation of a reduction of membrane‐associated full‐length RAGE but an increase of sRAGE in Tg2576 mouse BM cells.
Figure 7.
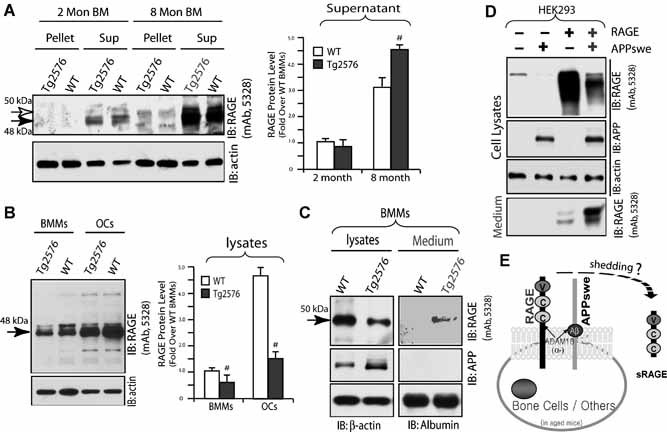
Age‐dependent increase of sRAGE in Tg2576 bone marrow. (A) Western blot analysis of RAGE protein in pellet and supernatant of bone marrow flushed from WT and Tg2576 femurs at indicated age. RAGE was detected in large part in supernatant and increased in aged (8‐month) bone marrow, as indicated by the quantification analysis shown in the right panel. In addition, a further increase in Tg2576 bone marrow supernatant was observed (# p < .05, a significant difference from WT control). (B) Western blot analysis of RAGE protein in lysates of BMMs and OCs from WT and Tg2576 mice. The quantification analysis is shown in the right panel (# p < .05, a significant decrease in lysates of BMMs and OCs from Tg2576 mice). (C) Western blot analysis of RAGE protein in lysates and medium of BMMs from WT and Tg2576 mice. A reduction of RAGE in lysates but an increase in the medium of BMMs from Tg2576 mice was observed. (D) Increase of RAGE shedding in HEK293‐APPswe cells. Full‐length RAGE was transiently transfected into HEK293 and HEK293‐APPswe stable cells. Cell lysates and medium were subjected to SDS‐PAGE and immunoblotting analysis. (E) Illustration of a model for sRAGE generation in APPswe‐expressing cells by RAGE ectodomain shedding.
It is known that sRAGE may arise from receptor ectodomain shedding and splice variant. (39, 40)We thus examined RAGE shedding by expressing full‐length RAGE into HEK 293 cells or HEK293‐APPswe stable cells. Remarkably, an increase of sRAGE in the medium but a decrease of RAGE in lysates was found in HEK293‐APPswe cells as compared with the control HEK293 cells (Fig. 7 D). This sRAGE in medium was generated from RAGE ectodomain shedding, because it has a slightly smaller molecular weight (∼44 kDa) than the full‐length RAGE (∼50 kDa). These results provide evidence for another mechanism underlying the increase of sRAGE in APPswe‐expressing mouse tissues or cells.
RANKL regulation of RAGE expression and OC formation in a dose‐dependent manner
We have previous demonstrated a requirement for RAGE in RANKL‐induced osteoclastogenesis.27 The decrease of RAGE protein and increase of sRAGE in BMM culture from Tg2576 mice thus leads to a speculation regarding a reduction of osteoclastogenesis in the mutant culture. However, an increase in OC formation and activity was found when a high density of mutant BMMs was stimulated with RANKL at 100 ng/mL (Fig. 4A, B ). To solve this paradox, we compared in vitro osteoclastogenesis of a lower density of WT and Tg2576 BMMs in response to different doses of RANKL. Interestingly, at lower doses of RANKL (10 ng/mL to 50 ng/mL, but not 100 ng/mL), a decrease of OC formation was observed in Tg2576 BMM culture (Fig. 8A, B ). These results suggest that the increase of OCs in APPswe‐BMM culture depends not only on BMM cell density but also RANKL concentration.
Figure 8.
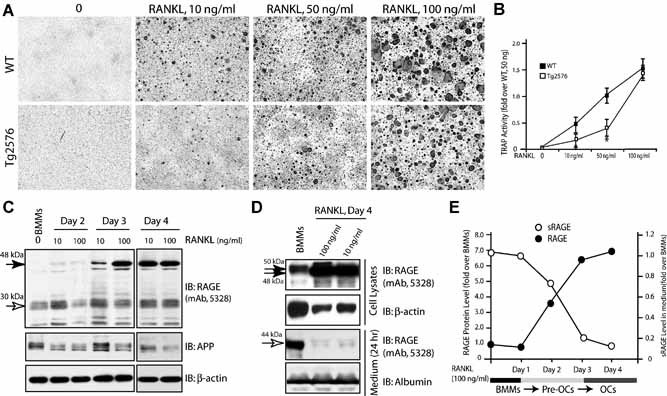
RANKL regulation of RAGE and sRAGE protein levels in BMMs and OCs. (A,B) Decrease in OC formation in APPswe‐BMM culture by permissive concentration of RANKL (10 to 50 ng/mL). BMMs from WT and Tg2576 mice (2 months old) were cultured at low density (105/well) and treated with different doses of RANKL with 1% of M‐CSF. Images of tartrate‐resistant acid phosphatase (TRAP) staining analysis at day 5 culture were shown in (A), and TRAP activity is quantified (mean ± SD, n = 3) and illustrated in (B). *p < .05, a significant difference from WT control. (C) Dose‐ and time‐dependent increase of RAGE protein in BMMs by RANKL. Lysates of BMMs and BMMs incubated with indicated concentrations of RANKL for indicated days were subjected for Western blot analysis using indicated antibodies. (D) Decrease of medium RAGE (sRAGE) by RANKL. Lysates and medium of BMMs and BMMs treated with RANKL were subjected to Western blot analysis of RAGE/sRAGE. RANKL increase of RAGE protein in lysates but decrease of sRAGE in medium were quantified and summarized in (E).
We next examined whether RANKL regulates RAGE protein level and secretion in BMMs/pre‐OCs in a dose‐ and time‐dependent manner. WT‐BMMs were treated with RANKL (10 ng/mL or 100 ng/mL) for 2 days. A time‐ and dose‐dependent increase of RAGE protein was observed in lysates of BMMs in response to RANKL (Fig. 8 C). Similarly, sRAGE in the medium was detected in BMMs only in the absence of RANKL treatment (Fig. 8 D). These results show an increase of RAGE protein expression but a decrease of sRAGE production by RANKL during OC differentiation (Fig. 8 E).
sRAGE inhibition of OC formation in vitro and in 2‐month‐old Tg2576 mice
The age‐dependent increase of esRAGE/sRAGE correlated well with the decrease of OC differentiation in aged Tg2576 mice (Supplemental Fig. 3 and Fig. 7A). We thus tested whether sRAGE inhibits RANKL‐induced osteoclastogenesis in vitro. To this end, a recombinant sRAGE protein containing the extracellular domain of RAGE was generated, as described previously.41 RANKL‐induced TRAP+ cells in culture were significantly reduced by sRAGE in a dose‐dependent manner, with a significant inhibition of OCs by 0.1 µg/mL sRAGE (Fig. 9A, B ). We next examined whether the sRAGE generated from the RAGE ectodomain shedding plays a similar role to the recombinant sRAGE in the osteoclastogenesis assay. RAGE conditioned medium (RAGE‐CM) from RAGE‐expressing cells was collected and contained ∼10 ng/mL of sRAGE (Fig. 9 C). Inhibition of osteoclastogenesis in vitro was observed; however, it appeared to be weaker than that observed with ∼10 ng/mL of recombinant sRAGE treatment (Fig. 9D, E ). These results suggest that sRAGE (either the recombinant form or that collected from conditioned medium) acts as an inhibitor of RANKL‐induced osteoclastogenesis in vitro, supporting the view that increased esRAGE/sRAGE causes a reduction of OCs in aged Tg2576 mice.
Figure 9.
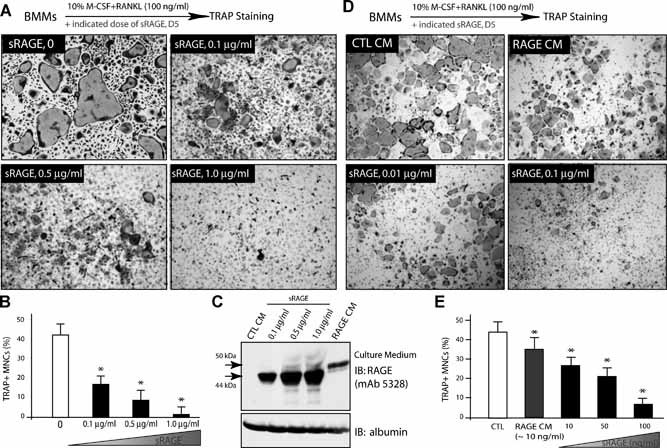
sRAGE inhibition of RANKL‐induced osteoclastogenesis in vitro. (A,B) Dose‐dependent inhibition of RANKL‐induced in vitro osteoclastogenesis by recombinant sRAGE. BMMs were treated with 44 ng/mL M‐CSF, 100 ng/mL RANKL, and indicated doses of the sRAGE for 5 days. The images are shown in (A), and the tartrate‐resistant acid phosphatase (TRAP) activity is quantified and illustrated in (B). Mean ± SD from 3 different experiments are shown. *p < .05, a significant difference from the control (without sRAGE). (C) Western blot analysis of sRAGE from conditioned medium of RAGE‐expressing cells (recombinant sRAGEs were used loading controls). (D,E) Inhibition of in vitro osteoclastogenesis by RAGE conditioned medium (RAGE‐CM). TRAP staining images are shown in (D), and the TRAP activity is quantified and shown in (E). Means ± SD from 3 different experiments are shown. *p < .05, significant difference from the control.
To further test whether sRAGE inhibits OC formation in vivo, we injected sRAGE (intraperioneally, 100 µg/g, once a day, for 5 days) into 2‐month‐old Tg2576 mice. The control group (Tg2576 mice of the same age and sex) received similar treatment with a corresponding volume of PBS. In Tg2576 mice that received sRAGE treatment, TRAP analysis of femurs showed evident reduced staining, whereas the control group displayed a level of TRAP+ cells similar to that in untreated Tg2576 mice (Fig. 10A, B ). These data suggest that systemic treatment with sRAGE in young Tg2576 mice may inhibit OC formation. Further supporting this view, RANKL‐induced in vitro osteoclastogenesis was nearly abolished in BMMs isolated from Tg2576 mice injected with sRAGE (Fig. 10C, D ).
Figure 10.
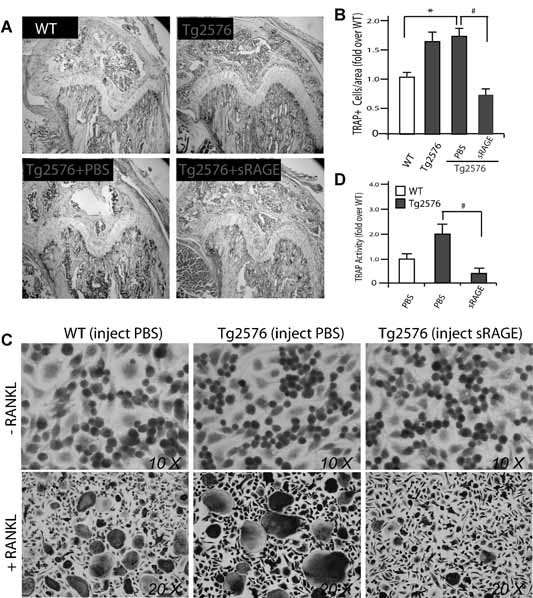
Effect of intraperitoneal administration of sRAGE on OC formation in 2‐month‐old Tg2576 mice. (A,B) Tartrate‐resistant acid phosphatase (TRAP) staining analysis of OCs in femurs of 2‐month‐old WT and Tg2576 mice systemic treated without or with sRAGE or PBS. The data are quantified and illustrated in (B). Bars show the mean ± SEM. *p < .05, a significant increase compared with WT control. # p < .05, a significant decrease compared with PBS treatment. (C) TRAP staining analysis of osteoclastogenesis of BMMs from 2‐month‐old WT and Tg2576 mice injected with sRAGE or PBS. RANKL (100 ng/mL) was used to induce osteoclast formation. (D) Quantitative analysis of the average TRAP activity during in vitro osteoclastogenesis (data from C). Mean ± SD (n = 3) are shown. # p < .05, a significant decrease between sRAGE and PBS treatments (Student's t‐test).
Discussion
This study shows that overexpressed APPswe leads to altered OC differentiation and activation in vitro and in vivo. OC activation was found to both increase and decrease in Tg2576 mice, in an age‐dependent manner. An increase of OCs in young (<4‐month‐old) Tg2576 mice may be due to soluble Aβ oligomer–induced RAGE activation in BMMs (Fig. 11). However, the decrease of OC in aged (>4‐month‐old) Tg2576 mice appears to correlate with the increase of sRAGE expression and production in aged APPswe‐expressing cells (Fig. 11). These results suggest an unexpected function of APPswe and provide a potential mechanism underlying the increased bone fracture rate in AD patients.
Figure 11.
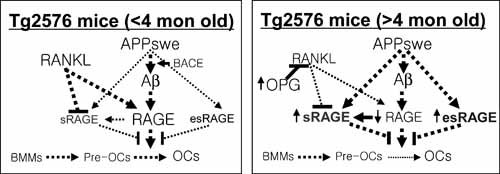
A working model for APPswe/Aβ regulation of OC differentiation and function in an age‐dependent manner.
Although the increased bone fracture rate is not a typical feature of patients with AD at the time of diagnosis, it is common to observe both symptoms clinically in AD patients.4, 5 Patients with AD are known to have an increased risk for bone fracture compared with non‐AD control subjects, despite having normal bone mineral density (BMD). Using Tg2576 mice, a well‐studied animal model for AD, we showed altered OC differentiation and activity in vivo. Bone density appears to be normal in aged long bones (eg, 8 to 12 months old), but reduced in vertebrae/spines in both young and aged Tg2576 mice (Fig. 2)42 The relatively normal bone density in aged long bones may result from a reduction of both OB and OC activity or from a decrease in bone remodeling in aged Tg2576 mice. This decrease in bone remodeling in aged Tg2576 mice may reduce the capability for the regeneration or repair of a microarchitectural damage of bone, leading to an increase in bone fracture rate.
Aβ, a 40‐ to 42‐amino acid peptide produced from the β‐ and γ‐ secretase cleavage of APP, displays proinflammatory cytokine‐like properties. In the brain, Aβ oligomers are neurotoxic and induce a proinflammatory response.43 Its role in osteoclastogenesis and the molecular mechanisms underlying its functions remain to be elucidated. Our work provides evidence that Aβ increases osteoclastogenesis in vitro and in vivo with the following characteristics. The Aβ effect depends on soluble Aβ oligomer and RAGE, in line with the observations that soluble Aβ oligomers are neurotoxic43 and that RAGE is necessary for OC maturation in vitro and in vivo.27 The APPswe/Aβ effect may be both cell autonomous and nonautonomous, because the in vitro osteoclast culture is not completely pure and the in vitro data are not in completely agreement with the in vivo data. The APPswe /Aβ effect is a transient event. Both BMMs expressing APPswe and those treated with exogenous Aβ show a transient increase of RANKL‐induced OC formation and activation (Figs. 3 and 4). The underlying mechanism for such a transient effect by APPswe/Aβ is unclear. It is likely that the ratio of soluble Aβ oligomers over monomers or the ratio of RAGE over sRAGE may be changed during culture: high at the start, but reduced at the late stage of culture because of macrophage‐mediated uptake of soluble Aβ oligomers. Finally, the APPswe/Aβ effect depends on BMM cell density and the dose of RANKL. An increase in OCs was found only in high‐density APPswe‐BMM culture with a higher (>100 ng/mL) concentration of RANKL treatment. We speculate that such culture conditions may favor Aβ generation and RAGE expression, thus promoting OC formation. Conditions similar to those found in these cultures may exist in the bone marrow environments of young but not in aged Tg2576 mice, because BMM cell density may be reduced in aged mouse bone marrow. Taken together, our results suggest that Aβ generated from APPswe‐expressing cells may cause a transient increase of OC differentiation in a RAGE‐dependent manner.
Regarding mechanisms underlying the decrease of OC in aged Tg2576 mice, our studies have pointed to a role for sRAGE. sRAGE is increased in aged Tg2576 mice, which inhibits RANKL‐induced osteoclastogenesis in vitro (Fig. 9) and decreases OC formation in young Tg2576 mice upon systematic administration (Fig. 10), in agreement with the observation that sRAGE suppresses periodontitis‐associated bone loss in diabetic mice.44 In addition to sRAGE, other factors, such as OPG, a well known inhibitor of RANKL, may also play a crucial role in the decrease of OCs in aged Tg2576 mice (Fig. 11). Supporting this view are the observations that OPG transcripts were increased in various tissues of 4‐month‐old Tg2576 mice (Supplemental Fig. 2A, C ). Interestingly, serum OPG protein level is reported to be increased in aged human AD patents, but not in the early phase of the disease. 45, 46 Moreover, we also speculate that the reduced BMM cell density in aged mouse bone marrow may cause APPswe‐BMMs to be insensitive to RANKL, another mechanism underlying the decrease of OCs in aged Tg2576 mice.
Several issues are raised by this study. First, how does APPswe cause an increase of sRAGE, but a decrease of full‐length RAGE? RAGE RNA splicing and protein shedding may both be involved, a possibility supported by our RT‐PCR analysis of mRNA transcripts and Western blot analysis of the BMM or HEK293 culture medium that contains the extracellular domain of RAGE resulting from RAGE protein shedding.40 However, the exact mechanisms underlying this differential regulation of RAGE RNA slicing and protein shedding by APPswe remain to be investigated. Second, the circulating soluble forms of RAGE are believed to counteract RAGE‐mediated pathogenesis by acting as decoys. This view appears to be true in the context of osteoclastogenesis, where RAGE expression in BMMs is required for OC maturation in vitro and in vivo.27 and sRAGE inhibits osteoclastogenesis. However, in the context of the pathogenesis of AD, the increase of RAGE but not sRAGE is believed to contribute to the detrimental effect. Our data showing an increase of sRAGE in aged Tg2576 mice thus appear to contradict this view. RAGE is reported to be increased in AD patients; however, the exact isoforms in patients remain to be investigated. The exact type of sRAGE in plasma or tissues in patients of AD also remains to be determined, because sRAGEs in serum may arise from receptor ectodomain shedding and/or expression of a splice variant (esRAGE).39, 40 The different types of sRAGEs in plasma and/or in local tissues may have different post‐translational modifications and different functions. Finally, it still remains to be fully elucidated whether the observed increase of sRAGE and/or OPG in Tg2576 mouse tissues is due to compensatory defense mechanisms or whether sRAGE or OPG plays a causative role in the disease process.
In summary, APPswe appears to have a biphasic function in OC differentiation in an age‐dependent manner. The Aβ‐RAGE–mediated increase of OCs in young Tg2576 mice may have a role in promoting the release of cytokines and factors from the bone matrix, thus contributing to the pathogenesis of disease. However, the decrease of OC formation in aged Tg2576 mice that may result from the increase of sRAGE and OPG can slow down bone remodeling in an unbalanced manner, thus, leading to an increase of bone fracture rate without a significant change of total bone density.
Disclosures
All the authors state that they have no conflicts of interest.
Supporting information
Additional Supporting information may be found in the online version of this article.
Supplementary Figure
Supplementary Figure 1
Supplementary Figure 2
Supplementary Figure 3
Supplementary Figure 4
Acknowledgements
Shun Cui, Fei Xiong, and Yan Hong contributed equally to this work.
This study was supported in part by grants from the National Institutes of Health (WCX and LM).
References
- 1. Rockenstein E, Crews L, Masliah E. Transgenic animal models of neurodegenerative diseases and their application to treatment development. Adv Drug Deliv Rev. 2007;59:1093–1102. [DOI] [PubMed] [Google Scholar]
- 2. Hsiao KK, Borchelt DR, Olson K, et al. Age‐related CNS disorder and early death in transgenic FVB/N mice overexpressing Alzheimer amyloid precursor proteins. Neuron. 1995;15:1203–1218. [DOI] [PubMed] [Google Scholar]
- 3. Yankner BA, Lu T. Amyloid beta‐protein toxicity and the pathogenesis of Alzheimer's disease. J Biol Chem. 2009;284:4755–4759. [DOI] [PMC free article] [PubMed] [Google Scholar]
- 4. Tysiewicz‐Dudek M, Pietraszkiewicz F, Drozdzowska B. Alzheimer's disease and osteoporosis: common risk factors or one condition predisposing to the other? Ortop Traumatol Rehabil. 2008;10:315–323. [PubMed] [Google Scholar]
- 5. Melton LJ 3rd, Beard CM, Kokmen E, Atkinson EJ, O'Fallon WM. Fracture risk in patients with Alzheimer's disease. J Am Geriatr Soc. 1994;42:614–619. [DOI] [PubMed] [Google Scholar]
- 6. Stefani M, Liguri G. Cholesterol in Alzheimer's disease: unresolved questions. Curr Alzheimer Res. 2009;6:15–29. [DOI] [PubMed] [Google Scholar]
- 7. Ashe KH. Learning and memory in transgenic mice modeling Alzheimer's disease. Learn Mem. 2001;8:301–308. [DOI] [PubMed] [Google Scholar]
- 8. German DC, Eisch AJ. Mouse models of Alzheimer's disease: insight into treatment. Rev Neurosci. 2004;15:353–369. [DOI] [PubMed] [Google Scholar]
- 9. Scheuner D, Eckman C, Jensen M, et al. Secreted amyloid beta‐protein similar to that in the senile plaques of Alzheimer's disease is increased in vivo by the presenilin 1 and 2 and APP mutations linked to familial Alzheimer's disease. Nat Med. 1996;2:864–870. [DOI] [PubMed] [Google Scholar]
- 10. Selkoe DJ, Yamazaki T, Citron M, et al. The role of APP processing and trafficking pathways in the formation of amyloid beta‐protein. Ann N Y Acad Sci. 1996;777:57–64. [DOI] [PubMed] [Google Scholar]
- 11. Walsh DM, Klyubin I, Shankar GM, et al. The role of cell‐derived oligomers of Abeta in Alzheimer's disease and avenues for therapeutic intervention. Biochem Soc Trans. 2005;33:1087–1090. [DOI] [PubMed] [Google Scholar]
- 12. Smith DG, Cappai R, Barnham KJ. The redox chemistry of the Alzheimer's disease amyloid beta peptide. Biochim Biophys Acta. 2007;1768:1976–1990. [DOI] [PubMed] [Google Scholar]
- 13. Yan SD, Stern D, Kane MD, Kuo YM, Lampert HC, Roher AE. RAGE‐Abeta interactions in the pathophysiology of Alzheimer's disease. Restor Neurol Neurosci. 1998;12:167–173. [PubMed] [Google Scholar]
- 14. Li W, Li J, Ashok M, et al. A cardiovascular drug rescues mice from lethal sepsis by selectively attenuating a late‐acting proinflammatory mediator, high mobility group box 1. J Immunol. 2007;178:3856–3864. [DOI] [PMC free article] [PubMed] [Google Scholar]
- 15. Xie J, Reverdatto S, Frolov A, Hoffmann R, Burz DS, Shekhtman A. Structural basis for pattern recognition by the receptor for advanced glycation end products (RAGE). J Biol Chem. 2008;283:27255–27269. [DOI] [PubMed] [Google Scholar]
- 16. Allmen EU, Koch M, Fritz G, Legler DF. V domain of RAGE interacts with AGEs on prostate carcinoma cells. Prostate. 2008;68:748–758. [DOI] [PubMed] [Google Scholar]
- 17. Ostendorp T, Leclerc E, Galichet A, et al. Structural and functional insights into RAGE activation by multimeric S100B. Embo J. 2007;26:3868–3878. [DOI] [PMC free article] [PubMed] [Google Scholar]
- 18. Cheng C, Tsuneyama K, Kominami R, et al. Expression profiling of endogenous secretory receptor for advanced glycation end products in human organs. Mod Pathol. 2005;18:1385–1396. [DOI] [PubMed] [Google Scholar]
- 19. Schmidt AM, Stern DM. RAGE: a new target for the prevention and treatment of the vascular and inflammatory complications of diabetes. Trends Endocrinol Metab. 2000;11:368–375. [DOI] [PubMed] [Google Scholar]
- 20. Chavakis T, Bierhaus A, Al‐Fakhri N, et al. The pattern recognition receptor (RAGE) is a counterreceptor for leukocyte integrins: a novel pathway for inflammatory cell recruitment. J Exp Med. 2003;198:1507–1515. [DOI] [PMC free article] [PubMed] [Google Scholar]
- 21. Hofmann MA, Drury S, Fu C, et al. RAGE mediates a novel proinflammatory axis: a central cell surface receptor for S100/calgranulin polypeptides. Cell. 1999;97:889–901. [DOI] [PubMed] [Google Scholar]
- 22. Taguchi A, Blood DC, del Toro G, et al. Blockade of RAGE‐amphoterin signalling suppresses tumour growth and metastases. Nature. 2000;405:354–360. [DOI] [PubMed] [Google Scholar]
- 23. Yan SD, Bierhaus A, Nawroth PP, Stern DM. RAGE and Alzheimer's disease: a progression factor for amyloid‐beta‐induced cellular perturbation? J Alzheimers Dis. 2009;16:833–843. [DOI] [PMC free article] [PubMed] [Google Scholar]
- 24. Deane R, Du Yan S, Submamaryan RK, et al. RAGE mediates amyloid‐beta peptide transport across the blood‐brain barrier and accumulation in brain. Nat Med. 2003;9:907–913. [DOI] [PubMed] [Google Scholar]
- 25. Liu LP, Hong H, Liao JM, et al. Upregulation of RAGE at the blood‐brain barrier in streptozotocin‐induced diabetic mice. Synapse. 2009;63:636–642. [DOI] [PubMed] [Google Scholar]
- 26. Jeynes B, Provias J. Evidence for altered LRP/RAGE expression in Alzheimer lesion pathogenesis. Curr Alzheimer Res. 2008;5:432–437. [DOI] [PubMed] [Google Scholar]
- 27. Zhou Z, Immel D, Xi CX, et al. Regulation of osteoclast function and bone mass by RAGE. J Exp Med. 2006;203:1067–1080. [DOI] [PMC free article] [PubMed] [Google Scholar]
- 28. Zhou Z, Han JY, Xi CX, et al. HMGB1 regulates RANKL‐induced osteoclastogenesis in a manner dependent on RAGE. J Bone Miner Res. 2008;23:1084–1096. [DOI] [PMC free article] [PubMed] [Google Scholar]
- 29. Cortizo AM, Lettieri MG, Barrio DA, Mercer N, Etcheverry SB, McCarthy AD. Advanced glycation end‐products (AGEs) induce concerted changes in the osteoblastic expression of their receptor RAGE and in the activation of extracellular signal‐regulated kinases (ERK). Mol Cell Biochem. 2003;250:1–10. [DOI] [PubMed] [Google Scholar]
- 30. Yoshida T, Flegler A, Kozlov A, Stern PH. Direct inhibitory and indirect stimulatory effects of RAGE ligand S100 on sRANKL‐induced osteoclastogenesis. J Cell Biochem. 2009;107:917–925. [DOI] [PubMed] [Google Scholar]
- 31. Li J, Wang H, Mason JM, et al. Recombinant HMGB1 with cytokine‐stimulating activity. J Immunol Methods. 2004;289:211–223. [DOI] [PubMed] [Google Scholar]
- 32. McHugh KP, Hodivala‐Dilke K, Zheng MH, et al. Mice lacking beta3 integrins are osteosclerotic because of dysfunctional osteoclasts. J Clin Invest. 2000;105:433–440. [DOI] [PMC free article] [PubMed] [Google Scholar]
- 33. Hu X, Zhou X, He W, et al. BACE1 deficiency causes altered neuronal activity and neurodegeneration. J Neurosci. 2010;30:8819–8829. [DOI] [PMC free article] [PubMed] [Google Scholar]
- 34. Hu X, He W, Diaconu C, et al. Genetic deletion of BACE1 in mice affects remyelination of sciatic nerves. Faseb J. 2008;22:2970–2980. [DOI] [PMC free article] [PubMed] [Google Scholar]
- 35. Hu X, Hicks CW, He W, et al. Bace1 modulates myelination in the central and peripheral nervous system. Nat Neurosci. 2006;9:1520–1525. [DOI] [PubMed] [Google Scholar]
- 36. Evin G, Weidemann A. Biogenesis and metabolism of Alzheimer's disease Abeta amyloid peptides. Peptides. 2002;23:1285–1297. [DOI] [PubMed] [Google Scholar]
- 37. Du Yan S, Zhu H, Fu J, et al. Amyloid‐beta peptide‐receptor for advanced glycation endproduct interaction elicits neuronal expression of macrophage‐colony stimulating factor: a proinflammatory pathway in Alzheimer disease. Proc Natl Acad Sci U S A. 1997;94:5296–5301. [DOI] [PMC free article] [PubMed] [Google Scholar]
- 38. Sturchler E, Galichet A, Weibel M, Leclerc E, Heizmann CW. Site‐specific blockade of RAGE‐Vd prevents amyloid‐beta oligomer neurotoxicity. J Neurosci. 2008;28:5149–5158. [DOI] [PMC free article] [PubMed] [Google Scholar]
- 39. Kalea AZ, Reiniger N, Yang H, Arriero M, Schmidt AM, Hudson BI. Alternative splicing of the murine receptor for advanced glycation end‐products (RAGE) gene. Faseb J. 2009;23:1766–1774. [DOI] [PMC free article] [PubMed] [Google Scholar]
- 40. Raucci A, Cugusi S, Antonelli A, et al. A soluble form of the receptor for advanced glycation endproducts (RAGE) is produced by proteolytic cleavage of the membrane‐bound form by the sheddase a disintegrin and metalloprotease 10 (ADAM10). Faseb J. 2008;22:3716–3727. [DOI] [PubMed] [Google Scholar]
- 41. Miyata T, Hori O, Zhang J, et al. The receptor for advanced glycation end products (RAGE) is a central mediator of the interaction of AGE‐beta2microglobulin with human mononuclear phagocytes via an oxidant‐sensitive pathway. Implications for the pathogenesis of dialysis‐related amyloidosis. J Clin Invest. 1996;98:1088–1094. [DOI] [PMC free article] [PubMed] [Google Scholar]
- 42. Sommerfeldt DW, McLeod KJ, Rubin CT, Hadjiargyrou M. Differential phosphorylation of paxillin in response to surface‐bound serum proteins during early osteoblast adhesion. Biochem Biophys Res Commun. 2001;285:355–363. [DOI] [PubMed] [Google Scholar]
- 43. Hung LW, Ciccotosto GD, Giannakis E, et al. Amyloid‐beta peptide (Abeta) neurotoxicity is modulated by the rate of peptide aggregation: Abeta dimers and trimers correlate with neurotoxicity. J Neurosci. 2008;28:11950–11958. [DOI] [PMC free article] [PubMed] [Google Scholar]
- 44. Lalla E, Lamster IB, Feit M, et al. Blockade of RAGE suppresses periodontitis‐associated bone loss in diabetic mice. J Clin Invest. 2000;105:1117–1124. [DOI] [PMC free article] [PubMed] [Google Scholar]
- 45. Emanuele E, Peros E, Scioli GA, et al. Plasma osteoprotegerin as a biochemical marker for vascular dementia and Alzheimer's disease. Int J Mol Med. 2004;13:849–853. [PubMed] [Google Scholar]
- 46. Luckhaus C, Mahabadi B, Grass‐Kapanke B, et al. Blood biomarkers of osteoporosis in mild cognitive impairment and Alzheimer's disease. J Neural Transm. 2009;116:905–911. [DOI] [PubMed] [Google Scholar]
Associated Data
This section collects any data citations, data availability statements, or supplementary materials included in this article.
Supplementary Materials
Additional Supporting information may be found in the online version of this article.
Supplementary Figure
Supplementary Figure 1
Supplementary Figure 2
Supplementary Figure 3
Supplementary Figure 4