

Much of the work directed at the creation of arrays for protein analysis relies on the use of highly selective molecules as receptors[1]. In these arrays, the receptors are immobilized and exposed to a mixture of target molecules[1d] or to heterogeneous biological samples such as serum from cancer patients[2]. However, such arrays generally only detect the molecules they were programmed to detect, and are ill-suited for the detection of protein variants, such as sequence changes, deletions, and insertions.
Since it is infeasible to generate a receptor for every possible variation of a particular protein, an alternative strategy in array sensing, inspired by the biological senses of taste and smell, would be to use an array of cross-reactive receptors that can function together to distinguish many protein varients[3]. Such an approach, referred to as differential sensing, has been shown to have the ability to identify both known and unknown targets, including targets that are structurally related to one another, without the need for a unique receptor for each target[4]. One of our group’s approaches to differential sensing uses peptide-based receptors derived from combinatorial library synthesis[5]. We illustrated this approach by using a hexasubstituted aryl core decorated with guanidinium groups which were appended to combinatorially generated tripeptide arms. Randomly chosen members of the receptor library were immobilized and used to differentiate ATP, GTP and AMP [6]. We have recently used this approach to discriminate protein targets. We generated a library derived from appending variable peptide arms to a tridentate core, along with different metallic ions and counter ions chelated into the tridentate core. An 18 receptor ensemble was used to effectively discriminate α-neurokinin, substance P, and tachykinin[5, 7].
While these methods have been successful, the receptors are limited by their small size. Synthetic organic receptors have limited surface areas for interaction, and therefore may not be ideal for binding larger, more complex targets. Therefore, we are now applying these differential sensing methods to a synthetically accessible class of biopolymer receptors, aptamers.
For differential sensing, a receptor should on one hand bind ligands tightly, but on the other hand recognize many targets with different affinities for each target. This allows for a reproducible pattern that can be sufficiently unique to be used for discrimination. Aptamers are structured DNA or RNA molecules selected from random sequence pools [8]. Through an iterative process, aptamers are generated that can show a range of sensitivities and specificities to target analytes, and that are frequently able to cross-recognize protein variants. For example, different aptamers selected against single amino acid variants of bacteriophage MS2 coat protein[9] were found to exhibit a range of activities, from binding to only one protein variant, to avoiding only one variant, to generally binding each of the protein variants. Even more striking was the behavior of an aptamer isolated from a selection against Xenopus TFIIIA, and that was found to bind broadly to a variety of different zinc finger proteins[10].
Our hypothesis was that an array of potentially cross-reactive aptamers might be able to more broadly recognize a series of protein variants than a similar set of highly specific receptors. In this regard, aptamers have previously been used for biosensing[11], and have been used by Stojanovic in cross-reactive arrays[12]. In Pei et al. this group describes an assay in which systematic variations in aptamer sequence were used to discriminate 12 different alkaloids[13]. Rather than relying on systematically varying a single aptamer, we hoped that the aptamers normally generated by in vitro selection would serve as a set of semi-specific receptors.
In particular, we wished to use aptamers in differential sensing protocols to distinguish between wild-type and drug resistant variants of HIV-1 reverse transcriptase. The ability to effectively discriminate various mutant strains of HIV-1 reverse transcriptase could have significant implications on the appropriate course of treatment. While some current assays can detect drug resistant mutations, they are time consuming, taking between 1 and 4 weeks to complete[14]. An immobilized aptamer array might be capable of directly identifying the drug resistance profiles of circulating viruses.
Aptamers were selected against either wild-type (WT) reverse transcriptase (RT) or a drug resistant variant (M3).[15] Ninety-six of the resultant anti-RT aptamers were then screened for binding to the WT and M3 enzymes. They were further screened for binding to two proteins that they had not previously been exposed to: HIV-1 RT variants M5 and M9 (Table 1). Because at least some of the selected aptamers appeared to be semi-specific, (Figure S2), we hypothesized that the arrays might allow recognition of the novel analytes M5 and M9 based on pattern recognition.
Table 1.
Location and Amino acid identity for proteins used.
| AA number | WT | M3 | M5 | M9 |
|---|---|---|---|---|
| 41 | M | L | M | M |
| 44 | E | D | E | E |
| 67 | D | N | N | D |
| 69 | T | D | D | T |
| 70 | K | K | R | K |
| 75 | V | V | V | I |
| 77 | F | F | F | L |
| 116 | F | F | F | Y |
| 118 | V | I | V | V |
| 151 | Q | Q | Q | M |
| 184 | M | V | V | M |
| 210 | L | W | L | L |
| 215 | T | Y | Y | T |
| 219 | K | K | Q | K |
Initially we were unable to effectively discriminate the different RT variants using either the entire set of 96 aptamers (Supplemental Materials S3A), or a filtered set that included only those 15 aptamers predicted to be best at discriminating between proteins (Supplemental Materials S3B). This may have been due to noise arising from non-specific, charge-based interactions with immobilized aptamers, irreproducible preparations of the large numbers of aptamers and slides, or an insufficient number of replicates.
In order to more quickly generate more reproducible data, a more limited set of 30 aptamers was chosen for immobilization on new slides. Fifteen of the aptamers were selected because they were predicted to be the most useful in discriminating different protein variants; however, these aptamers in many instances were found to still be able to bind to several of the variants at once (see sequences in Supplemental Material). Fifteen additional aptamers were included that appeared to be sensitive to the addition of AZT to RT, and thus that might also be sensitive to conformational changes in either the wild-type or mutant enzymes[16].
In order to immobilize the aptamers on arrays, they were extended at their 3′ ends with a sequence that was complementary to an oligonucleotide anchor. The anchor sequence was in turn synthesized as a locked nucleic acid (LNA)-biotin conjugate that could be immobilized on the array via a biotin-Neutravidin interaction (Figure 1). An LNA complementary to the 5′ end was synthesized with a pendant Cy5 fluorophore in order to quantitate the amount of aptamer that was immobilized on the array (Figure 1). The LNAs and aptamers were hybridized to one another in solution and printed on to a glass slide coated with Neutravidin. With the use of a contact microarray printer the aptamers were printed in 16 discrete locations on the slide; this formed 16 “reaction wells” that could be independently probed with protein mixtures. Each aptamer within each well was printed in sextuplet in order to better estimate statistical deviations in protein binding (Figure 2).
Figure 1.
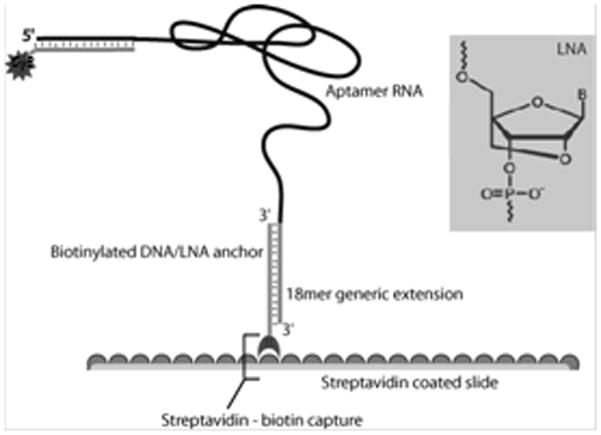
A biotinylated LNA anchor complementary to the 5′ end of the aptamer, securing the aptamer to the Nutravidin coated slide. A second LNA conjugated to the 3′ end of the aptamer acts as a probe for detection of bound aptamer.
Figure 2.
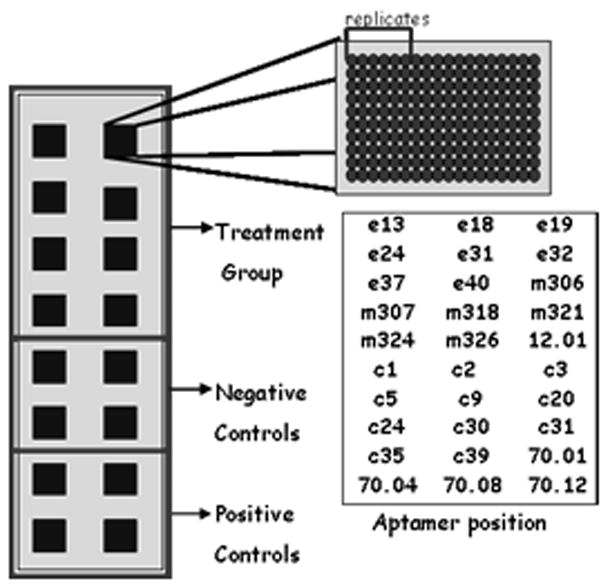
Slide treatment. Each small square represents a single reaction well, 16 per slide. Each well was identical and consisted of 30 aptamers printed in replicates of 6. The aptamer’s position is a representation of where each aptamer was positioned relative to the others; each name represents a set of six replicates. Each slide was separated into three groups of wells. The top eight wells correspond to the treatment group; where one of the four HIV-RT variants were applied. The next four wells correspond to negative controls and the final four correspond to the positive controls.
Of the 16 wells, 8 were treated with either 850pM WT RT or one of the three mutant variants (Table 1), four were treated with 850pM RT as a positive control, and four were treated with buffer only as a negative control. In total there were eight slides, two for each type of protein.
Aptamer protein interactions were detected by first treating each reaction chamber with monoclonal rabbit anti HIV-1 RT followed by Cy3-conjugated goat anti-rabbit. The slides were scanned using a GenePix4000a, and the fluorescence for both the area where the aptamer was printed (foreground), and a circular region surrounding the foreground (background), were measured for both the Cy3 and Cy5 channels. The background subtracted log2 ratio of Cy5/Cy3 was measured for each printed spot. Visual observation showed differential binding between the mutants, as seen in Figure 3a–e.
Figure 3.
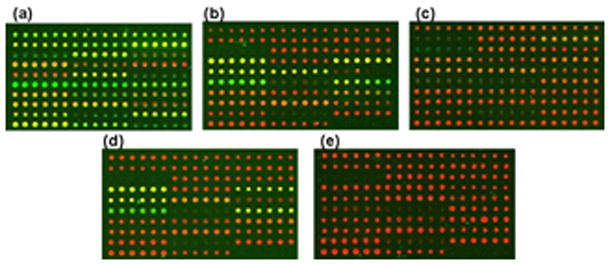
GenePix scan of the 30 aptamer set. Red corresponds to the Cy5 channel and the signal intensity is proportional to the amount of aptamer bound to the slide. “Black” spots indicated locations where little or no aptamer was deposited. If the background intensity exceeded the foreground intensity in either channel the spots were excluded. Green corresponds to the Cy3 channel where the signal intensity is proportional to the amount of protein bound to the aptamer. a) Wild-type b) M3 c) M5 d) M9 e) negative control.
Various data processing and chemometric techniques were considered to best segregate the data based on protein type. Because of the highly multivariate nature of the data and noise inherent to microarray experiments, a supervised learning algorithm, linear discriminate analysis (LDA), was selected for the data analysis. It was found that using “with-in” slide normalization allowed for the clearest discrimination of protein variants (see Supplemental Materials). Figure 4A shows the results of the LDA on the with-in slide normalized data. There are four distinct clusters of data. One cluster corresponds to the wild type protein, which is separated from the mutant proteins and negative controls across the first and second components. The buffer only negative control and M5 mutants are separated from the WT, as well as M3 and M9 proteins, primarily across the second component. However, there is minimal separation of the negative control from M5, and of M3 from M9. As might be expected based on these analyses, the visual pattern of binding for M5 is similar to that of the negative control, and the visual patterns for M3 and M9, are similar (Figure 3b, 3d). By including a third component, one can see that the clusters are separated across the third component as well as the first two (Figure 4B). Most importantly, the M5 mutant could now be visually distinguished from the negative control, and appears further from the WT protein. There was also modest improvement in the visual discrimination between M9 and M3. Results of a leave-one-out cross-validation tests are found in Figure 4C. In this analysis each point was left out of the LDA and the resultant model was used to predict what group the excluded point belonged to. This analysis showed that M9, WT and the negative controls could all be predicted with 100% accuracy. However, 7.15% of the time a M5 well was incorrectly predicted to be M9 and 7.15% of the time it was predicted to be a negative control. This resulted in an overall accurate prediction for M5 85.71% of the time. Interestingly, while M9 was never incorrectly predicted to be M3, M3 was mistaken for M9 26.67% of the time. This implies that there is insufficient difference between the patterns generated by M3 and M9 to effectively separate the two.
Figure 4.

a)“ within-slide” normalized LDA of 30 aptamers set 91.2% explained. Ellipses represent 95% confidence intervals b) LDA of 30 aptamer set including 3 components “within slide normalized”, 98.33% captured. c) Leave-one out cross validation
Taken together, these results validate the hypothesis that aptamers can be used as semi-specific receptors for analytes that they have not previously been exposed to. That said, it is not immediately obvious what parameters should be used for the construction of arrays that provide broad recognition. For example, even though aptamers that recognized M3 were also somewhat related to aptamers that recognized M9, these proteins do not share amino acid substitutions (Table 1). It is possible that aptamers that bound both these proteins recognized conformational changes induced by the mutations rather that the mutations themselves. Similarly, limiting the array to those 15 aptamers predicted to provide the best discrimination of the mutant variants, as opposed to those thought to be sensitive to AZT-induced conformational changes, did not improve discrimination (Supplemental Materials). While semi-specific aptamers appear useful for recognizing novel protein variants, it nonetheless seems likely that selecting aptamers against additional RT variants will likely increase the resolving power of the arrays.
In summary, we have shown that aptamers immobilized in a microarray format can be used to discriminate between similar proteins, based on chemometric methods. Surprisingly, the aptamers could distinguish proteins that differed by as few as 4 amino acid substitutions, even when the aptamers were not specifically selected against a given target protein. Because aptamers combine complex recognition features with synthetic tractability they may prove to be particularly useful for the production of cross-reactive arrays for biomedical testing,[17] bio-defense applications,[18] and food quality monitoring.[19]
Experimental Section
Refer to Supplemental methods
Supplementary Material
Acknowledgments
The authors would like to thank members of the ICMB core facility for their assistance in array printing. This work was funded by the National Institutes of Health (5-R01 GM077040, 05, 06, 07, G,M065515) the Welch Foundation (F-1654), and the United States Navy (N00014-09-1-1087).
Footnotes
Supporting information for this article is available on the WWW under http://www.chembiochem.org or from the author.
Contributor Information
Prof. Dr. Andrew Ellington, Email: andy.ellington@mail.utexas.edu.
Prof. Dr. Eric Anslyn, Email: anslyn@austin.utexas.edu.
Biblography
- 1.a Conroy PJ, Hearty S, Leonard P, O’Kennedy RJ. Semin Cell Dev Biol. 2009;20:10–26. doi: 10.1016/j.semcdb.2009.01.010. [DOI] [PubMed] [Google Scholar]; b Luppa PB, Sokoll LJ, Chan DW. Clin Chim Acta. 2001;314:1–26. doi: 10.1016/s0009-8981(01)00629-5. [DOI] [PubMed] [Google Scholar]; c Goodey A, Lavigne JJ, Savoy SM, Rodriguez MD, Curey T, Tsao A, Simmons G, Wright J, Yoo SJ, Sohn Y, Anslyn EV, Shear JB, Neikirk DP, McDevitt JT. J AM CHEM SOC. 2001;123:2559–2570. doi: 10.1021/ja003341l. [DOI] [PubMed] [Google Scholar]; d Haab BB, Dunham MJ, Brown PO. Genome Biol. 2001;2 doi: 10.1186/gb-2001-2-2-research0004. RESEARCH0004. [DOI] [PMC free article] [PubMed] [Google Scholar]
- 2.Miller JC, Zhou H, Kwekel J, Cavallo R, Burke J, Butler EB, Teh BS, Haab BB. Proteomics. 2003;3:56–63. doi: 10.1002/pmic.200390009. [DOI] [PubMed] [Google Scholar]
- 3.a Lavigne J, Anslyn E. ANGEW CHEM INT EDIT. 2001;40:3119–3130. doi: 10.1002/1521-3773(20010903)40:17<3118::AID-ANIE3118>3.0.CO;2-Y. [DOI] [PubMed] [Google Scholar]; b Dickinson TA, White J, Kauer JS, Walt DR. Nature. 1996;382:697–700. doi: 10.1038/382697a0. [DOI] [PubMed] [Google Scholar]; c Albert KJ, Lewis NS, Schauer CL, Sotzing GA, Stitzel SE, Vaid TP, Walt DR. CHEM REV. 2000;100:2595–2626. doi: 10.1021/cr980102w. [DOI] [PubMed] [Google Scholar]; d Lewis NS. Acc Chem Res. 2004;37:663–672. doi: 10.1021/ar030120m. [DOI] [PubMed] [Google Scholar]
- 4.a Shangguan D, Cao Z, Meng L, Mallikaratchy P, Sefah K, Wang H, Li Y, Tan W. J PROTEOME RES. 2008;7:2133–2139. doi: 10.1021/pr700894d. [DOI] [PMC free article] [PubMed] [Google Scholar]; b Suslick K, Rakow N, Sen A. TETRAHEDRON. 2004;60:11133–11138. [Google Scholar]; c Stojanovic M, Green E, Semova S, Nikic D, Landry D. J AM CHEM SOC. 2003;125:6085–6089. doi: 10.1021/ja0289550. [DOI] [PubMed] [Google Scholar]; d Fitter S, James R. J BIOL CHEM. 2005;280:34193–34201. doi: 10.1074/jbc.M504772200. [DOI] [PubMed] [Google Scholar]
- 5.Umali AP, Anslyn EV. Curr Opin Chem Biol. 2010;14:685–692. doi: 10.1016/j.cbpa.2010.07.022. [DOI] [PMC free article] [PubMed] [Google Scholar]
- 6.McCleskey SC, Griffin MJ, Schneider SE, McDevitt JT, Anslyn EV. J AM CHEM SOC. 2003;125:1114–1115. doi: 10.1021/ja021230b. [DOI] [PubMed] [Google Scholar]
- 7.Wright AT, Edwards NY, Anslyn EV, McDevitt JT. ANGEW CHEM INT EDIT. 2007;46:8212–8215. doi: 10.1002/anie.200701236. [DOI] [PubMed] [Google Scholar]
- 8.a Ellington AD, Szostak JW. Nature. 1990;346:818–822. doi: 10.1038/346818a0. [DOI] [PubMed] [Google Scholar]; b Tuerk C, Gold L. Science. 1990;249:505–510. doi: 10.1126/science.2200121. [DOI] [PubMed] [Google Scholar]
- 9.Hirao I, Spingola M, Peabody D, Ellington AD. Mol Divers. 1998;4:75–89. doi: 10.1023/a:1026401917416. [DOI] [PubMed] [Google Scholar]
- 10.Weiss TC, Zhai GG, Bhatia SS, Romaniuk PJ. BIOCHEMISTRY-US. 2010;49:2732–2740. doi: 10.1021/bi9016654. [DOI] [PubMed] [Google Scholar]
- 11.a Kirby R, Cho E, Gehrke B, Bayer T, Park Y, Neikirk D, McDevitt J, Ellington A. ANAL CHEM. 2004;76:4066–4075. doi: 10.1021/ac049858n. [DOI] [PubMed] [Google Scholar]; b McCauley T, Hamaguchi N, Stanton M. ANAL BIOCHEM. 2003;319:244–250. doi: 10.1016/s0003-2697(03)00297-5. [DOI] [PubMed] [Google Scholar]; c Niu W, Jiang N, Hu Y. ANAL BIOCHEM. 2007;362:126–135. doi: 10.1016/j.ab.2006.12.011. [DOI] [PubMed] [Google Scholar]; d Stadtherr K, Wolf H, Lindner P. ANAL CHEM. 2005;77:3437–3443. doi: 10.1021/ac0483421. [DOI] [PubMed] [Google Scholar]; e Li Y, Lee HJ, Corn RM. ANAL CHEM. 2007;79:1082–1088. doi: 10.1021/ac061849m. [DOI] [PMC free article] [PubMed] [Google Scholar]; f Sefah K, Phillips JA, Xiong X, Meng L, Van Simaeys D, Chen H, Martin J, Tan W. Analyst. 2009;134:1765–1775. doi: 10.1039/b905609m. [DOI] [PubMed] [Google Scholar]
- 12.a Stojanovic MN, Worgall TS. Curr Opin Chem Biol. 2010;14:751–757. doi: 10.1016/j.cbpa.2010.07.008. [DOI] [PubMed] [Google Scholar]; b Stojanovic MN, Green EG, Semova S, Nikic DB, Landry DW. J AM CHEM SOC. 2003;125:6085–6089. doi: 10.1021/ja0289550. [DOI] [PubMed] [Google Scholar]
- 13.Pei R, Shen A, Olah MJ, Stefanovic D, Worgall T, Stojanovic MN. Chem Commun (Camb) 2009:3193–3195. doi: 10.1039/b900001a. [DOI] [PubMed] [Google Scholar]
- 14.Sen S, Tripathy SP, Paranjape RS. J Postgrad Med. 2006;52:187–193. [PubMed] [Google Scholar]
- 15.a Rolland O, Turrin CO, Caminade AM, Majoral JP. New J Chem. 2009;33:1809–1824. [Google Scholar]; b Burke D, Scates L, Andrews K, Gold L. J MOL BIOL. 1996;264:650–666. doi: 10.1006/jmbi.1996.0667. [DOI] [PubMed] [Google Scholar]; c TUERK C, MACDOUGAL S, GOLD L. P NATL ACAD SCI USA. 1992;89:6988–6992. doi: 10.1073/pnas.89.15.6988. [DOI] [PMC free article] [PubMed] [Google Scholar]
- 16. [Google Scholar]
- 17.a Peng G, Hakim M, Broza YY, Billan S, Abdah-Bortnyak R, Kuten A, Tisch U, Haick H. Br J Cancer. 2010 doi: 10.1038/sj.bjc.6605810. [DOI] [PMC free article] [PubMed] [Google Scholar]; b Phillips JA, Lopez-Colon D, Zhu Z, Xu Y, Tan W. ANAL CHIM ACTA. 2008;621:101–108. doi: 10.1016/j.aca.2008.05.031. [DOI] [PubMed] [Google Scholar]
- 18.Taitt CR, Anderson GP, Lingerfelt BM, Feldstein MJ, Ligler FS. ANAL CHEM. 2002;74:6114–6120. doi: 10.1021/ac0260185. [DOI] [PubMed] [Google Scholar]
- 19.Zhang C, Suslick KS. J Agric Food Chem. 2007;55:237–242. doi: 10.1021/jf0624695. [DOI] [PubMed] [Google Scholar]
Associated Data
This section collects any data citations, data availability statements, or supplementary materials included in this article.