

Abstract
Renal cell carcinoma (RCC) is the most lethal urologic cancer. Only two common susceptibility loci for RCC have been confirmed to date. To identify additional RCC common susceptibility loci, we conducted an independent genome-wide association study (GWAS). We analyzed 533 191 single nucleotide polymorphisms (SNPs) for association with RCC in 894 cases and 1516 controls of European descent recruited from MD Anderson Cancer Center in the primary scan, and validated the top 500 SNPs in silico in 3772 cases and 8505 controls of European descent involved in the only published GWAS of RCC. We identified two common variants in linkage disequilibrium, rs718314 and rs1049380 (r2 = 0.64, D ′ = 0.84), in the inositol 1,4,5-triphosphate receptor, type 2 (ITPR2) gene on 12p11.23 as novel susceptibility loci for RCC (P = 8.89 × 10⁻¹⁰ and P = 6.07 × 10⁻⁹, respectively, in meta-analysis) with an allelic odds ratio of 1.19 [95% confidence interval (CI): 1.13–1.26] for rs718314 and 1.18 (95% CI: 1.12–1.25) for rs1049380. It has been recently identified that rs718314 in ITPR2 is associated with waist–hip ratio (WHR) phenotype. To our knowledge, this is the first genetic locus associated with both cancer risk and WHR.
INTRODUCTION
Kidney cancer is the eighth leading cancer in the United States, with an estimated 58 240 new cases and 13 040 deaths in 2010 (1). The incidence rates for kidney cancer have been steadily increasing in most high-income countries in recent decades until recently in some European countries where kidney cancer incidence rates have decreased or stabilized (2,3). In over 85% of kidney cancers, the pathological subtype is renal cell carcinoma (RCC). Established modifiable risk factors for RCC include cigaret smoking, obesity and hypertension. Other risk factors may include physical inactivity, occupational exposure to trichloroethylene and a history of diabetes mellitus (3).
There is compelling evidence for genetic predisposition to RCC, both in rare hereditary syndromes and in the general population (4,5). Rare high-penetrance susceptibility genes include VHL (von Hippel-Lindau syndrome), MET (hereditary papillary renal carcinoma), BHD (Birt-Hogg-Dube syndrome) and FH (hereditary leiomyomatosis and RCC), which are also involved in certain subtypes of sporadic RCC through somatic mutations (4). Genetic predisposition to sporadic RCC has been demonstrated in a meta-analysis of published epidemiological studies in which family history of kidney cancer conferred a 2.2-fold (95% CI: 1.6–2.9) increased risk (6). A recent genome-wide association study (GWAS) comprising individuals of European descent identified two common low-penetrance variants on 2p21 and 11q13.3 that were associated with the risk of RCC (5). A candidate gene on 2p21 is EPAS1, which encodes the hypoxia-inducible factor-2α, central to the VHL–HIF pathway strongly implicated in RCC pathogenesis (5). These two variants are the only confirmed loci for RCC to date and explain a small fraction of the familial risk of RCC. To identify additional novel RCC susceptibility loci, we conducted an independent primary scan of RCC followed by validation of the top 500 single nucleotide polymorphisms (SNPs) in an in silico replication and meta-analysis using previously published GWAS results (5).
RESULTS
The primary scan was performed using the Illumina Infinium HumanHap660W BeadChip in an RCC case–control study consisting of 910 cases and 566 controls of European descent. Cases were newly diagnosed and histologically confirmed RCC patients from MD Anderson Cancer Center, and controls were recruited through random digital dialing in Texas and matched to cases on age, gender and residence (6). We also included 972 controls of Texas residence and European descent who were genotyped using HumanHap610 in a recently published GWAS of bladder cancer (7). After applying strict quality control criteria (Materials and Methods), we restricted the analysis to genotyped SNPs common to the HumanHap610 and 660W Beadchips; accordingly, we analyzed 533 191 SNPs for association with RCC risk for 894 cases and 1516 controls in stage one. A quantile–quantile (Q–Q) plot of observed versus expected χ2-test statistics showed no evidence for inflation of χ2-tests, suggesting no evidence for differences in population substructure (inflation factor λ = 1.037; Supplementary Material, Fig. S1). We adjusted for genomic control in the analysis and there was little difference in the P-values (data not shown). While none of the SNPs reached genome-wide significance in stage one (Supplementary Material, Fig. S2), seven SNPs had a P-value < 10−5 and 58 SNPs showed a P-value < 10−4, all analyzed in silico in stage 2. The two GWAS-identified RCC susceptibility SNPs (5) were confirmed in our primary scan, with allelic ORs of 1.14 (95% CI, 1.01–1.28, P = 0.039) for rs11894252 on EPAS1 (2p21), and 0.75 (95% CI, 0.59–0.95, P = 0.017) for rs7105934 on 11q13.3, respectively (Supplementary Material, Table S1). The corresponding results in the published GWAS were 1.14 (95% CI, 1.09–1.20, P = 1.8 × 10⁻⁸) and 0.69 (0.62–0.76, P = 7.8 × 10⁻¹⁴), respectively (5).
We performed a meta-analysis of the 500 top SNPs from our primary scan data with that of the recently published GWAS of RCC, which had a total of 4092 cases and 8991 controls of European descent undergoing primary scans using various Illumina HumanHap BeadChips (HapMap 300, 500, 610 and 660W) (5). The study design, population characteristics and genotyping platforms for that study were previously described (5). To ensure consistency of genotyping, we only selected the top 500 SNPs that are common across the different BeadChips and did not use imputed data for this meta-analysis. After quality control procedures, 3772 cases and 8505 controls were used for meta-analysis. Combining our primary scan and this GWAS population, there were 4666 RCC cases and 10 021 controls for the meta-analysis.
Two SNPs (rs718314 and rs1049380) on 12p11.23 reached genome-wide significance in meta-analysis (Fig. 1). These two SNPs were in high linkage disequilibrium (LD; r2= 0.64, D ′ = 0.84). The P-values for the discovery phase were 2.43 × 10⁻⁴ and 1.19 × 10⁻³ and for the validation phase were 4.28 × 10⁻⁷ and 9.19 × 10⁻⁷, respectively. The P-values reached 8.89 × 10⁻¹⁰ for rs718314 and 6.07 × 10⁻⁹ for rs1049380 in meta-analysis of two scans using a fixed effects model (Supplementary Material, Table S2). There was no significant heterogeneity between the ORs estimated for the two stages. None of the other SNPs reached genome-wide significance in meta-analysis (Supplementary Material, Table S2). We performed principal component analysis and found one borderline significant (P < 0.1) eigenvector. When we included this eigenvector in the logistic regression model, the results were similar to the model without this eigenvector (Table 1).
Figure 1.

Forest plot showing the association of rs718314 and rs1049380 with RCC risk in discovery and validation populations and in meta-analysis.
Table 1.
Association between rs718314 and the risk of RCC
| Analysisa | Discovery |
Validation |
Meta-analysis | P for heterogeneity | |||
|---|---|---|---|---|---|---|---|
| OR (95% CI) | P–value | OR (95% CI) | P-value | OR (95% CI) | P-value | ||
| Univariate | 1.28 (1.12–1.46) | 2.65E − 04 | 1.17 (1.10–1.25) | 6.34E − 07 | 1.19 (1.13–1.26) | 1.39E − 09 | 0.240 |
| Adjusted for age and sex | 1.29 (1.13–1.48) | 2.43E − 04 | 1.18 (1.10–1.25) | 4.28E − 07 | 1.19 (1.13–1.26) | 8.89E − 10 | 0.225 |
| Adjusted for age, sex and BMI | 1.27 (1.09–1.47) | 2.23E − 03 | 1.17 (1.09–1.23) | 1.09E − 06 | 1.18 (1.12–1.26) | 1.34E − 08 | 0.349 |
| Adjusted for age, sex and eigenvector | 1.28 (1.12–1.47) | 3.09E − 04 | 1.18 (1.10–1.25) | 4.28E − 07 | 1.19 (1.13–1.26) | 1.05E − 09 | 0.246 |
| Adjusted for age, sex, BMI and eigenvector | 1.26 (1.08–1.46) | 3.12E − 03 | 1.17 (1.10–1.25) | 1.09E − 06 | 1.18 (1.12–1.25) | 1.69E − 08 | 0.397 |
| Stratified analysisb | |||||||
| BMI < 25 | 1.41 (1.04–1.91) | 2.52E − 02 | 1.16 (1.01–1.33) | 3.14E − 02 | 1.20 (1.06–1.35) | 4.04E − 03 | 0.242 |
| BMI ≥ 25 and BMI < 30 | 1.12 (0.87–1.44) | 3.75E − 01 | 1.12 (1.01–1.25) | 3.79E − 02 | 1.12 (1.02–1.24) | 2.40E − 02 | 0.995 |
| BMI ≥ 30 and BMI < 35 | 1.31 (0.92–1.86) | 1.33E − 01 | 1.21 (1.02–1.44) | 3.03E − 02 | 1.23 (1.05–1.43) | 9.13E − 03 | 0.693 |
| BMI ≥ 35 | 1.15 (0.70–1.87) | 5.82E − 01 | 1.25 (0.94–1.66) | 1.20E − 01 | 1.22 (0.96–1.56) | 1.05E − 01 | 0.763 |
aThe specified analyses were done in discovery set. In the validation set, study site was a covariate in all the analysis, the two eigenvectors were covariates in all analysis except univariate analysis, and age was not included as a covariate.
bStratified analyses were adjusted for age and sex in the discovery set, and for sex, study site and the two eigenvectors in the validation set.
Since obesity is a risk factor for RCC, and more interestingly, rs718314 has recently been associated with waist–hip ratio [WHR (8)], we added body mass index (BMI) as a covariate in logistic regression analysis and also performed stratified analyses by BMI (Table 1). The ORs were similar with or without BMI adjustment and there was no meaningful difference in the allelic ORs across different BMI strata either. Similarly, we examined the results stratified by the other major risk factors for RCC, namely smoking status, hypertension and family history of kidney cancer, and observed no differences across strata (data not shown).
We next imputed genotypes [IMPUTE version 2 (9)] within 1 Mb of these two SNPs using the 1000 Genomes Project data (Build 36) combined with HapMap 3 (release 2) in our primary scan population (Fig. 2A). LD analysis of genotyped and imputed SNPs showed that these two SNPs reside within an LD block on 12p11.23 containing only the ITPR2 gene (Fig. 2B).
Figure 2.
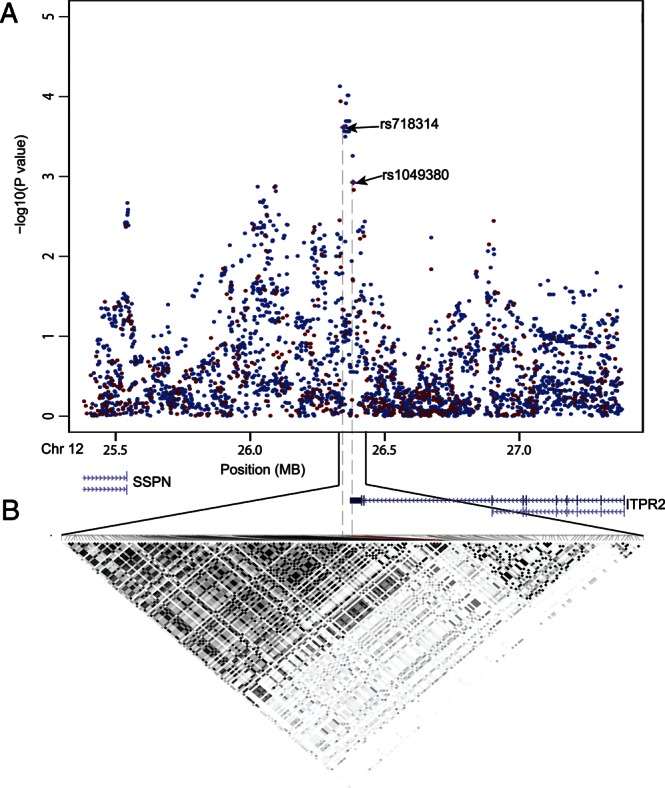
(A) Results of SNP association from primary scan: observed results from genotyped SNPs are in red and imputed results are in black. All known genes in this region are also shown. (B) LD structure across this region based on genotyped and imputed SNPs. Shown in each box is the square of the correlation coefficient (r2) derived from genotyped and imputed SNPs in Haploview software. Darker shading box indicates greater extent of LD between two SNPs.
DISCUSSION
We identified two highly linked common variants in ITPR2 on 12p11.23 that point to a novel susceptibility locus for RCC through a GWAS. Interestingly, rs718314 was recently unequivocally identified as a locus for WHR in a meta-analysis of 32 GWAS followed by candidate validation in 29 studies (P = 1.14 × 10⁻¹⁷ with a sample size of nearly 185 000) (8). Rs1049380 is located in the 3′-untranslated region of the ITPR2 gene, 2786 nucleotides from the stop codon. Rs718314 lies ∼36 kb distal to rs1049380 and resides just outside of the ITPR2 gene.
There is biological plausibility that ITPR2 could directly affect RCC susceptibility. ITPR2 belongs to the family of inositol 1,4.5-triphosphate (IP3) receptors which are intracellular Ca2+-release channels residing in the endoplasmic reticulum (ER) and which mediate Ca2+ mobilization from ER to cytoplasm in response to the binding of IP3, a second messenger. IP3-induced Ca2+ release is triggered by many additional external stimuli and plays important physiological roles (10). There are three subtypes of IP3 receptors in mammals—type 1 (ITPR1), type 2 (ITPR2) and type 3 receptor (ITPR3). These IP3-mediated receptors are expressed in a cell-specific manner and play important physiological functions. In the kidney, the vasopressin receptor, the endothelin receptor and the angiotensin II receptor are coupled to phosphatidylinositol responses. A previous study showed that ITPR2 was the most abundantly expressed subtype in murine kidney tissues, higher than ITPR1, whereas ITPR3 was not detectable (11). Moreover, exposing mice to a nephrotoxic agent, uranyl acetate (UA), caused significantly increased mRNA and protein levels of ITPR2 in kidney, but did not affect the levels of ITPR1 (11). These data suggest a more prominent role of ITPR2 than other two subtypes in kidney function and ITPR2 may participate in UA-induced nephrotoxicity (11). In another microarray gene-expression study, ITPR2 was also shown as among the most significant genes that were downregulated in RCC tumors when compared with adjacent normal kidney tissues (12). These studies provide biological plausibility that ITPR2 could be involved in RCC tumorigenesis, although direct functional evidence supporting the link between ITPR2 and RCC is still lacking.
It is also intriguing whether ITPR2 affects RCC risk at least partially through obesity-related pathways. The most significant SNP in our study, rs718314, was unequivocally associated with WHR (8). Previous GWAS have identified a few common SNPs for BMI and certain cancers, not including RCC (13). Rs718314 is the first common SNP associated with both WHR and cancer. WHR has been suggested as a better measure than BMI for obesity. The positive association between BMI and RCC risk is well established (2,3). The positive association between WHR and RCC risk has been fairly consistent in several epidemiological studies and the association appeared to be stronger in women than in men (14–17). Biologically, a previous study showed that mice with double-knockout of both ITPR2 and ITPR3 exhibited exocrine dysfunction that caused difficulties in nutrient digestion. Despite a normal caloric intake, the double mutants were hypoglycemic and lean (18). ITPR2 exhibited significantly differential expression between abdominal and gluteal subcutaneous adipose tissue (8). Unfortunately, we only have BMI data but do not have WHR data in our studies. Inclusion of BMI as a covariate in the logistic regression analysis did not significantly alter the OR, neither did we observe meaningful difference in ORs across different BMI strata in stratified analysis, suggesting that the association of rs718314 with RCC risk may be independent of obesity. However, future RCC association studies with WHR data are warranted to clarify the relationship between rs718314, WHR and RCC risk. Finally, we could not rule out that a separate gene located elsewhere may be tagged by the two significant SNPs and is the causal gene. Much more additional functional studies are needed to delineate the biological mechanism underlying the link between the SNPs on 12q11.23 and RCC risk.
In summary, we identified conclusively a new RCC susceptibility locus through a meta-analysis of GWAS. The common genetic variants identified in our study implicate a shared locus for WHR and RCC risk and also point towards a plausible candidate gene, ITPR2, for investigating the biological basis of this association.
MATERIALS AND METHODS
Study population
MD Anderson discovery population
Cases and controls for the primary scan were derived from an ongoing RCC case–control study starting 2002. The study design was described previously (6). Briefly, all cases were newly diagnosed, histopathologically confirmed and previously untreated RCC patients recruited from the University of Texas MD Anderson Cancer Center. There were no age, gender, ethnicity and cancer-stage restrictions. The controls were healthy individuals with no prior history of cancer (except non-melanoma skin cancer) recruited through random digit dialing (RDD). The controls must have lived for at least 1 year in the same county or in socio-economically matched surrounding counties where the case resided. The controls were frequency matched to the cases by age (±5 years), gender, ethnicity and county of residence. The overall response rate for RDD screening was 51% and, among those who agreed to participate, the response rate was 88%. The response rate for the eligible cases was 87%. We also included controls from an ongoing bladder cancer case–control study who were involved in a previously published GWAS of bladder cancer (7). These controls were recruited from Kelsey Seybold Clinic, the largest multi-specialty, managed-care physician group in the Houston metropolitan area and all these controls were also residents of Texas. We only included self-reported Caucasian individuals for this study. These studies were approved by the Institutional Review Boards of participating institutions and Informed consent was obtained from all study participants before the collection of epidemiological data and blood samples by trained MD Anderson staff interviewers.
Validation populations
We used RCC cases and controls from a completed GWAS as our validation populations (5). There were two primary scans performed in that GWAS, one was coordinated by the International Agency for Research on Cancer (IARC) and the Centre National de Génotypage (CNG) consisting of 2639 RCC cases and 5392 controls of European background drawn from seven studies conducted in Europe, and the other was led by the US National Cancer Institute (NCI) based on 1453 RCC cases and 3531 controls of European background from four US studies. The study design of each participating study and population characteristics were previously described (5). After quality control, 3772 cases and 8505 controls were used in meta-analysis.
Genotyping
The primary scan for the discovery population of RCC case–control study (910 cases and 566 controls) was performed at MD Anderson Cancer Center using the Illumina HumanHap660W Beadchips. Genotyping of the additional 972 controls of the bladder cancer control study was performed using the HumanHap610 Beadchips (7). Cases and controls were excluded from analysis if they had genotyping call rates less than 95% (n = 4), were found on review to be duplicated samples or known relatives to another sample (n = 12), were found to have reported a gender that did not match with X chromosome heterozygosity (n = 10). We excluded 13 samples that deviated by more than 4 SD from other study subjects using similarity in genotypes implemented in PLINK. After all quality control procedures were completed, 2410 samples including 894 cases and 1516 controls were available for analyses. We restricted analysis to genotyped SNPs common to both the HumanHap610 and 660W Beadchips. There were 561 882 overlapping SNPs between these two chips. After removing SNPs that were copy number variation markers, did not yield genotype and had minor allele frequency < 0.01, call rate <95%, Hardy–Weinberg equilibrium P< 0.0001 in controls, or P< 0.001 in the comparison of RCC controls and bladder cancer controls, we finally had 533 191 SNPs in the final analysis. For the published GWAS, the genotyping platform for each study was described previously (5). Briefly, the primary scans of the European studies were performed with the HumanHap 300 or 610 Beadchips. The primary scans of the four US studies were performed at the NCI Core Genotyping Facility with the HumanHap 500, 610 or 660w BeadChips.
Statistical analyses
Associations between each SNP and the risk of RCC in the primary scan was estimated using multivariate unconditional logistic regression by the OR and 95% CI assuming an additive genetic model with 1 degree of freedom. The genotype was coded as 0, 1, 2 (the count of minor alleles), except for SNPs in chromosome X among men in which the genotype was coded 0 for major allele and 2 for the minor allele. Q–Q plots of the χ2-test statistics was used to assess possible population stratification, adequacy of the case–control matching, and the possibility of differential genotyping in cases and controls. We performed principal component analysis implemented in SVS (Golden Helix, Inc) in our primary scan. Logistic regression analysis adjusting for age and gender was used to assess the significance of the eigenvectors and revealed one borderline significant (P< 0.1) eigenvector. When we included this eigenvector in the model, the results were similar to the model without this eigenvector. The final logistic regression analysis was adjusted by age and gender in the discovery stage and adjusted by gender, study center and the two eigenvectors in the replication studies. We performed fixed effects meta-analysis using allelic OR and 95% CI derived from the unconditional logistic regression to estimate the combined ORs and P-value for discovery and validation phases and Cochran's Q-statistic for heterogeneity implemented in STATA. We used the Haploview software (v.4.2) to infer the LD structure (19). We used IMPUTE (version 2) (9) to impute SNPs within 1Mb of rs1049380 based on the public reference data of the 1000 Genomes Project (Build 36) combined with HapMap 3 (release 2).
SUPPLEMENTARY MATERIAL
Supplementary Material is available at HMG online.
Conflict of Interest statement. None declared.
FUNDING
The study was partially supported by the US National Institutes of Health (NIH) grant R01CA 98897 (X.W.), MD Anderson Research Trust (X.W.), French Institut National du Cancer (INCa) for those studies coordinated by IARC/CNG and the intramural research program of the National Cancer Institute (NCI), NIH for those studies coordinated by the NCI.
Supplementary Material
ACKNOWLEDGEMENTS
We thank the genotyping personnel, study coordinators, and interviewers for performing experiments and recruiting participants. We are especially thankful for all the study participants who made the research possible.
REFERENCES
- 1.Jemal A., Siegel R., Xu J., Ward E. Cancer statistics, 2010. CA Cancer J. Clin. 2010;60:277–300. doi: 10.3322/caac.20073. [DOI] [PubMed] [Google Scholar]
- 2.Chow W.H., Devesa S.S. Contemporary epidemiology of renal cell cancer. Cancer J. 2008;14:288–301. doi: 10.1097/PPO.0b013e3181867628. [DOI] [PMC free article] [PubMed] [Google Scholar]
- 3.Chow W.H., Dong L.M., Devesa S.S. Epidemiology and risk factors for kidney cancer. Nat. Rev. Urol. 2010;7:245–257. doi: 10.1038/nrurol.2010.46. [DOI] [PMC free article] [PubMed] [Google Scholar]
- 4.Linehan W.M., Pinto P.A., Bratslavsky G., Pfaffenroth E., Merino M., Vocke C.D., Toro J.R., Bottaro D., Neckers L., Schmidt L.S., et al. Hereditary kidney cancer: unique opportunity for disease-based therapy. Cancer. 2009;115:2252–2261. doi: 10.1002/cncr.24230. [DOI] [PMC free article] [PubMed] [Google Scholar]
- 5.Purdue M.P., Johansson M., Zelenika D., Toro J.R., Scelo G., Moore L.E., Prokhortchouk E., Wu X., Kiemeney L.A., Gaborieau V., et al. Genome-wide association study of renal cell carcinoma identifies two susceptibility loci on 2p21 and 11q13.3. Nat. Genet. 2011;43:60–65. doi: 10.1038/ng.723. [DOI] [PMC free article] [PubMed] [Google Scholar]
- 6.Clague J., Lin J., Cassidy A., Matin S., Tannir N.M., Tamboli P., Wood C.G., Wu X. Family history and risk of renal cell carcinoma: results from a case-control study and systematic meta-analysis. Cancer Epidemiol. Biomarkers Prev. 2009;18:801–807. doi: 10.1158/1055-9965.EPI-08-0601. [DOI] [PMC free article] [PubMed] [Google Scholar]
- 7.Wu X., Ye Y., Kiemeney L.A., Sulem P., Rafnar T., Matullo G., Seminara D., Yoshida T., Saeki N., Andrew A.S., et al. Genetic variation in the prostate stem cell antigen gene PSCA confers susceptibility to urinary bladder cancer. Nat. Genet. 2009;41:991–995. doi: 10.1038/ng.421. [DOI] [PMC free article] [PubMed] [Google Scholar]
- 8.Heid I.M., Jackson A.U., Randall J.C., Winkler T.W., Qi L., Steinthorsdottir V., Thorleifsson G., Zillikens M.C., Speliotes E.K., Magi R., et al. Meta-analysis identifies 13 new loci associated with waist-hip ratio and reveals sexual dimorphism in the genetic basis of fat distribution. Nat. Genet. 2010;42:949–960. doi: 10.1038/ng.685. [DOI] [PMC free article] [PubMed] [Google Scholar]
- 9.Howie B.N., Donnelly P., Marchini J. A flexible and accurate genotype imputation method for the next generation of genome-wide association studies. PLoS Genet. 2009;5:e1000529. doi: 10.1371/journal.pgen.1000529. [DOI] [PMC free article] [PubMed] [Google Scholar]
- 10.Mikoshiba K. The IP3 receptor/Ca2+ channel and its cellular function. Biochem. Soc. Symp. 2007;74:9–22. doi: 10.1042/BSS0740009. [DOI] [PubMed] [Google Scholar]
- 11.Ondrias K., Sirova M., Kubovcakova L., Krizanova O. Uranyl acetate modulates gene expression and protein levels of the type 2, but not type 1 inositol 1,4,5-trisphosphate receptors in mouse kidney. Gen. Physiol. Biophys. 2008;27:187–193. [PubMed] [Google Scholar]
- 12.Dalgin G.S., Holloway D.T., Liou L.S., DeLisi C. Identification and characterization of renal cell carcinoma gene markers. Cancer Inform. 2007;3:65–92. [PMC free article] [PubMed] [Google Scholar]
- 13.Roberts D.L., Dive C., Renehan A.G. Biological mechanisms linking obesity and cancer risk: new perspectives. Annu. Rev. Med. 2010;61:301–316. doi: 10.1146/annurev.med.080708.082713. [DOI] [PubMed] [Google Scholar]
- 14.Adams K.F., Leitzmann M.F., Albanes D., Kipnis V., Moore S.C., Schatzkin A., Chow W.H. Body size and renal cell cancer incidence in a large US cohort study. Am. J. Epidemiol. 2008;168:268–277. doi: 10.1093/aje/kwn122. [DOI] [PMC free article] [PubMed] [Google Scholar]
- 15.Dal Maso L., Zucchetto A., Tavani A., Montella M., Ramazzotti V., Talamini R., Canzonieri V., Garbeglio A., Negri E., Tonini A., et al. Renal cell cancer and body size at different ages: an Italian multicenter case–control study. Am. J. Epidemiol. 2007;166:582–591. doi: 10.1093/aje/kwm108. [DOI] [PubMed] [Google Scholar]
- 16.Luo J., Margolis K.L., Adami H.O., Lopez A.M., Lessin L., Ye W. Body size, weight cycling, and risk of renal cell carcinoma among postmenopausal women: the Women's Health Initiative (United States) Am. J. Epidemiol. 2007;166:752–759. doi: 10.1093/aje/kwm137. [DOI] [PubMed] [Google Scholar]
- 17.Prineas R.J., Folsom A.R., Zhang Z.M., Sellers T.A., Potter J. Nutrition and other risk factors for renal cell carcinoma in postmenopausal women. Epidemiology. 1997;8:31–36. doi: 10.1097/00001648-199701000-00005. [DOI] [PubMed] [Google Scholar]
- 18.Futatsugi A., Nakamura T., Yamada M.K., Ebisui E., Nakamura K., Uchida K., Kitaguchi T., Takahashi-Iwanaga H., Noda T., Aruga J., et al. IP3 receptor types 2 and 3 mediate exocrine secretion underlying energy metabolism. Science. 2005;309:2232–2234. doi: 10.1126/science.1114110. [DOI] [PubMed] [Google Scholar]
- 19.Barrett J.C., Fry B., Maller J., Daly M.J. Haploview: analysis and visualization of LD and haplotype maps. Bioinformatics. 2005;21:263–265. doi: 10.1093/bioinformatics/bth457. [DOI] [PubMed] [Google Scholar]
Associated Data
This section collects any data citations, data availability statements, or supplementary materials included in this article.