

Abstract
A tight interplay of genetic predisposition and environmental factors define the onset and the rate of progression of chronic renal disease. We are seeing a rapid expansion of information about genetic loci associated with kidney function and complex renal disease. However, discovering the functional links that bridge the gap from genetic risk loci to disease phenotype is one of the main challenges ahead. Risk loci are currently assigned to a putative context using the functional annotation of the closest genes via a guilt-by-proximity approach. These approaches can be extended by strategies integrating genetic risk loci with kidney-specific, genome wide gene expression. Risk loci associated transcripts can be assigned a putative disease specific function using gene expression co-regulation networks. And, ultimately, genotype-phenotype dependencies postulated from these associative approaches in humans need to be tested via genetic modification in model organism. In this review, we survey strategies that employ human tissue-specific expression and the use of model organisms to identify and validate the functional relationship between genotype and phenotype in renal disease. Strategies to unravel how genetic risk and environmental factors orchestrate renal disease manifestation can be the first steps towards a more integrated, holistic approach urgently needed for chronic renal diseases.
Introduction
The genetic predisposition of an individual is a crucial factor in renal disease manifestation. In rare instances, a mutation of a single gene crucial for a specific renal function is sufficient to lead to a defined renal disease. But, more commonly, genetic risk and environmental factors together define where, when, and how a renal disease develops and progresses in a given individual. In addition, renal disease genetics has successfully defined the cause of many monogenetic diseases of the kidney. Recent advances in whole genome analysis can now provide insight into the role of common genetic variants found in human populations for the risk and manifestation of common kidney diseases. To define the contribution of these variants to a complex disease, Genome Wide Association Studies (GWAS) are the most widely used tools to date.
A GWAS of a common, complex (non-Mendelian) disease such as Type 2 Diabetes Mellitus (T2DM) and accompanying complications like Diabetic Nephropathy (DN) is aimed at determining the statistical relationship between DNA variants and an observable disease-related characteristic or trait. Because of the earlier availability of microarray-based genotyping platforms, the most commonly studied variants are Single Nucleotide Polymorphisms (SNPs), where a single base at a particular genomic location differs among individuals. Recent advances in sequencing technology also allow the detection of other variants including structural differences in the genome, such as Copy Number Variations (CNVs) where segments of DNA occur in unusual numbers of repetitions – including deletions (zero repetitions), and one or more duplications of one segment. An advantage of GWAS over previous genetic approaches such as linkage, is that associated variants may be causal, leading via genetics to the pathophysiology of disease. For instance, a nucleotide change in a coding region can result in a different amino acid when RNA is translated to protein (a non-synonymous SNP), leading to a dysfunctional protein, and the associated pathophysiological consequences. Other causal variants may directly target gene regulation by changing transcription factor binding sites to either allow or disrupt initiation of gene transcription. But, often, phenotype-associated variants are only markers of an inherited genetic region containing the causal variant.
With all the promise of the GWAS approach, the primary challenge to explain a common, complex disease phenotype using a genetic study of disease-variant associations is that discovered variants frequently have a small effect size. That is, each associated variant individually makes a limited contribution to the phenotypic outcome. This observation suggests two plausible scenarios, both of which implicate complex physiological interactions as the mechanism for manifesting genetic alterations as phenotype in common disease. The first scenario is that a common disease is due to groups of rare variants each found in a small population of subjects, and so cannot be detected by comparing the genotype of many individuals in a case-control genome-wide association study1. In the second scenario, multiple common variants act in concert in an individual to lead to the disease phenotype. In both scenarios, individual or small groups of causative variants have independent effect on different parts of the same cellular or tissue physiology (Figure 1). The difference being that rare variants would each have large physiological effect but in different small groups of affected individuals, while common variants would individually have smaller effect with a cumulative large physiological effect apparent across the affected population. Following the lead of systems biology, we refer to this commonly affected physiology as a system influenced by genetic variants.
Figure 1.
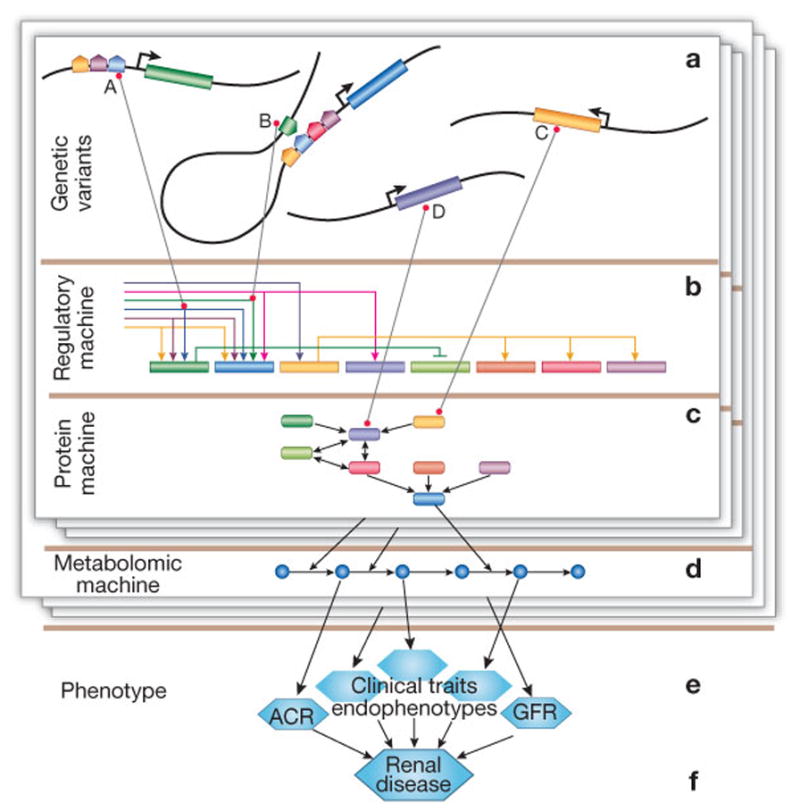
Illustration of physiologic effects of genetic variants based on molecular systems commonly studied in systems biology. Groups of variants (a) directly affect regulatory (b) and proteomic (signaling) (c) machinery of the cell, leading to disruption in a metabolic pathway (d) that ultimately leads to a clinical trait (e) and the renal disease phenotype (f). Shown is a group of regulatory and non-synonymous SNPs and their effect: SNP A lies in the promoter region of a gene, modifying the binding characteristics of a transcription factor; similarly B modifies an enhancer or repressor for another gene; and C and D are non-synonymous, with C having an indirect regulatory effect because of its role as a transcription factor. The layers illustrate that different groups of variants may affect different parts of cellular physiology, but ultimately impact the same phenotype.
The systems hypothesis states that variants impact different parts of the same cellular and tissue physiology to yield a common phenotypic effect. Here we review work toward this goal that focuses on gene regulation relative to genetic effects in renal disease. We focus on hypothesis-generation approaches that integrate kidney tissue-specific gene expression with genotype or GWAS results, though systems approaches can be applied in a situation where the disease mechanism is extra-renal. We also take a prospective look at both near and longer-term efforts using alternative approaches and technologies involving broader molecular and clinical measures.
Systematic studies of the genetic factors in renal disease were initiated over two decades ago2, and subsequently more than 15 GWAS have been performed on various forms of renal disease3–19. Even with substantial numbers of patients, GWAS only have power to detect associations of common variants with moderate contribution (effect size) to the phenotypes of common diseases. However, studies of rare renal diseases can yield significant effect sizes with relatively small populations12,20. In these studies, subjects are genotyped with microarray technology designed to detect alleles of a large set of common SNPs. Each genotyped SNP is selected to tag, or represent, a class of SNPs within a genomic region that are in linkage disequilibrium (LD), which is allele correlation due to population-specific history of recombination. This selection of SNPs is intended to allow a GWAS to determine disease associations with these classes of SNPs, called haplotype blocks, representing the genetic profile of each subject. As a future alternative, high throughput whole genome sequencing allows genotyping of all SNPs in an individual21.
To link genetic risk represented by the tagging SNPs with disease, most of these studies take a case-control strategy6,9,11, while others take a quantitative trait loci (QTL) strategy3,6. A case-control study computes a statistical association for each genotyped SNP between the alleles of the SNP and case-control status for each subject. A QTL analysis computes an association between the SNP alleles and the value of a quantitative trait for each subject in the study. For example, Glomerular Filtration Rate (GFR), used as a continuous variable, can be employed as a quantitative trait. It also can be used for case versus control categorization – e.g., defining cases as subjects with GFR below 60 mL/min/1.73 m2, and all others as controls. With both approaches, the studies result in variants that are implicated as causal for the phenotype examined, but do not help explain how the genetic region represented by these variants affect cellular or tissue physiology – another rationale for taking a systems approach. The systems perspective on renal disease also has a history that has recently been reviewed by He et al22 in this journal. In particular, gene expression studies based on renal biopsies have made an important contribution to understanding the role of transcriptional regulation in renal disease. Our goal is to review ways that gene expression can be integrated with genetic analysis to better understand the systems effects of genetic variants leading to renal disease phenotypes.
Approaches
With the exception of variants like non-synonymous SNPs or CNVs that result in modified gene products or deleted genes in affected individuals, it is frequently difficult to establish how a phenotype-associated variant determines the phenotypic outcome. How can we fill the gap in the genotype-phenotype projection? A promising strategy is to determine the molecules serving intermediary functions between genotype and phenotype (i.e., RNAs, proteins and metabolites) on a genomic scale (Figure 1). The use of gene expression in the analysis of genetic variants offers two basic techniques that help us start making the functional genotype-phenotype link. Integrating genetic risk with gene expression can establish associations of variants to gene regulation, and defining a putative functional context for the effect(s) of a variant. In human subjects, these approaches can only identify statistical relationships, while studies in model systems can allow experimentation with systemic perturbations that help validate hypotheses derived from the human studies. In the following, we discuss studies, some prospective, that address each of these aspects. We focus on variants that impact intra-renal gene regulation and the systems context of variants that affect the regulation of genes, but will not consider non-synonymous or structural variants leading to direct alterations of amino acid sequence or a deletion of a protein.
Associating Variants to Gene Expression
The key to the success of using gene expression to understand the effects of genetic variants is to relate variants to the genes that they might affect. The traditional approach in GWAS analysis has been to use guilt-by-proximity, in which candidate genes are identified with a variant simply by being nearby. In some cases, for instance, the Type 1 Diabetic Nephropathy (T1DN) candidate FRMD311, a proximal SNP can be verified to fall within a promoter region (see next section), but for most variants this will not be the case. While more complete genotyping from sequencing is more likely to include causal variants, proximity also misses variants that may affect enhancers or suppressors that are known to be up to several thousand base pairs from the regulated gene, depending on the 3-dimensional structure of the DNA23. In most GWAS studies, including the Genetics of Kidney in Diabetes (GoKinD)11 and CKDGen Consortium6 studies for which we discuss functional analysis below, renal gene expression is not available from the genotyped subjects, and guilt-by-proximity is a reasonable rule of thumb. When expression and genotype are both available from individuals in a study population, it is possible to perform an expression as a quantitative trait locus (eQTL) analysis to identify associations between variants and expression of genes.
An eQTL study determines the statistical association of genotype with transcript expression as a phenotypic trait24,25, and can involve analysis of small groups of variants but is usually an all-against-all analysis (all measured transcripts against all genotyped variants). While this analysis does not yield a causal relationship, it does give a direct, rather than inferred, relationship between SNP and the expression of a gene. Wheeler et al.26 employ eQTLs in a restricted way in their study of kidney function as a proxy phenotype for aging, but no human genome-wide kidney eQTL study has been published to date. Such studies will provide the opportunity to link GWAS candidates directly to genes in an unbiased, genome-wide manner, but matching a GWAS SNP to an eQTL can still be a subtle art27,28.
An association of a SNP with a transcript encoded by a nearby gene is defined as a cis-eQTL, and an associated variant association far from the gene, either on the same or a different chromosome, is called a trans-eQTL. While a cis-eQTL SNP likely tags a causal SNP that changes transcript abundance of a nearby gene in an allele-specific manner, a trans-eQTL has less obvious involvements in transcriptional regulation29. However, a trans-eQTL could identify distant enhancers or repressors that will not be captured by tight definitions of cis-regions (Figure 1). A model developed by Veyrieras et al.30 suggests putatively causative cis-associated SNPs are concentrated near transcription start and end sites; ranging about 100 kilobases upstream of the start site, to no more than 40 kilobases downstream of the end site.
Focusing only on cis-eQTLs emphasizes variants with direct regulatory effect, but, may miss variants that have relevant, but indirect effect on gene regulation. Studies in model organisms find that variants with trans (i.e., distant) effects often form hotspots. A trans-hotspot is a variant together with a set of genes whose expression is associated with the variant, and is identified by simply counting nominally significant associations per variant. Permutation testing31 is used to test the distribution of hotspot sizes and determine empirical significance of each observed hotspot. Such sets potentially indicate the effect of master regulators impacting a cascade of transcripts, a particularly appealing for a systems analysis of renal disease. Hotspots also provide an opportunity for causal analysis, such as inferring regulatory relationships from gene co-expression networks32–35. Still, there is some question as to whether trans-effects are real or simply statistical artifacts. Listgarten et al.36, for instance, define and compare several statistical models for eQTL analysis, and find that trans-effects only occur in the weakest, suggesting that caution is required in analyses based on trans-effects.
Clinical measures may be used in conjunction with eQTL analysis to further refine GWAS variants. Figure 2 depicts an approach, in which a clinical QTL analysis is performed for the biopsy population, and the QTL SNPs are used to focus the eQTLs on clinically relevant traits before interpreting the GWAS candidates. This is similar, in principle, to the approach taken by Zhong et al.37 to identify liver and adipose tissue eQTLs putatively involved in Type 2 Diabetes Mellitus. Cohorts with extensive clinical observations are a prerequisite to these analyses. Parameters that may be integrated with renal eQTLs include longitudinal measurements of proteinuria and GFR as well as detailed histological scoring of renal biopsies and ultrastructural morphometry. Plasma and urine proteomic and metabolomic measurements can provide additional opportunities for analysis, especially in diseases where renal damage has extra-renal origins and kidney gene expression may not be informative.
Figure 2.

Use of expression and clinical traits to compute quantitative trait loci (QTL) in order to identify GWAS candidates with putative regulatory effect impacting clinical traits associated with the GWAS phenotype. Kidney specific eQTLs allow focus on tissue-specific regulatory effects, while clinical QTLs narrow further to those showing associations with measures of renal disease progression.
Identifying Functional Context
The systems hypothesis implies that each causative variant has an effect on a cellular system that defines its functional context in a tissue-specific manner. Most work so far has focused on analysis of single variants, with a broader systems strategy still in the future. In this section we present efforts to perform analysis of the functional context of single variants implicated in renal disease.
The identification of such a functional context is aided by having tissue-specific gene expression. Correlations between transcripts can be used to define a co-regulation network of renal disease in which the strongest correlations indicate potential subsystems. By linking candidate genetic variants to transcripts in these subsystems, followed by pathway analysis of co-regulated transcripts, it is possible to identify the putative functional and regulatory contexts of disease-associated genetic variants.
An example of this approach is a current project to study GWAS candidates from the CKDGen consortium using GFR-correlated gene expression from the European Renal cDNA Bank (ERCB). The CKDGen study is a meta-analysis of twenty GWAS that include an aggregate of over 65,000 subjects of European descent with chronic kidney disease (CKD) or reduced kidney function measured by various methods of GFR estimation6,38. ERCB39–42 is a collection of subjects with glomerular diseases or transplants who underwent renal biopsies. The integration strategy employed (Figure 3) is to use the GFR trait to link the ERCB gene expression to the CKDGen phenotype to identify genes whose expression correlates with GFR.
Figure 3.

Use of clinical trait correlated tissue-specific expression to identify GWAS candidate genes and co-regulated genes relevant to a clinical condition.
This analysis was based on candidate genes identified, guilt-by-proximity, within 60kb of the 16 CKD-associated candidate SNPs from the CKDGen study. Glomerular and tubulo-interstitial gene expression was used from ERCB renal biopsies of subjects diagnosed with a glomerular disease and biopsies from living donor kidneys. The expression values for the genes in proximity to the candidate were correlated with the GFR levels for the ERCB subjects. A statistically significant set of genes show GFR-correlated expression in the tubulo-interstitial compartment, with fewer such genes from the glomerular compartment – most of which are correlated in both. The majority of the correlations imply decreased expression with loss of kidney function as measured by lower GFR.
One of the genes with GFR-correlated expression in both compartments is VEGFA, which has been implicated in progressive diabetic nephropathy43. Performing a pathway analysis of this gene with its GFR co-regulated genes in the ERCB gene expression data set finds strong enrichment for the Hypoxia Signaling pathway. Support for Hypoxia Signaling in CKD is further provided by a promoter analysis of the hypoxia pathway transcripts correlated with GFR defining putative common upstream transcriptional regulators. While this analysis is still underway, these results provide evidence for a regulatory and functional link between hypoxia and fibrosis in CKD, as well as many other connections among the implicated pathways.
As seen in the CKD analysis, the use of tissue-specific expression is important to the functional analysis of candidate genes. This is especially true in the analysis of genes near a single candidate SNP, which have few if any functional annotations. An example of this analytical approach is the functional analysis of a candidate SNP (rs1888747) from the GoKinD GWAS of T1DN 11. This SNP is located in the extended promoter region of a poorly annotated gene, FRMD3, presenting a difficult analytic scenario involving a non-coding SNP in proximity to an unknown gene. In this situation, genes showing correlated expression with the candidate gene can be used to assign a function using statistical enrichment tests. Genes sharing function and regulation justify a systematic analysis of the mechanism responsible for transcriptional co-regulation via promoter modeling approaches44.
Using FRMD3 as a case-study, a gene co-regulation network was constructed from gene expression of early diabetic glomerulopathy. Within this network, several hundred transcripts were found to have correlated expression with FRMD3. Pathway analysis identified, among others, the bone morphogenic protein (BMP) pathway as being significantly enriched for this set of correlated transcripts. BMP has been reported to have a protective role in renal fibrosis and DN45. Analysis of the SNP-altered promoter region together with DN co-regulated BMP pathway members found a shared regulatory transcriptional module suggestive of common regulation of FRMD3 and BMP pathway genes in the presence of the risk allele. These results allow the formulation of a testable hypothesis for the role of FRMD3, which is that the polymorphism impacts the BMP pathway as part of the pathophysiologic cascade driving progression in DN.
The CKD and T1DN examples stress the utility of kidney tissue specific expression data sets as a resource to developing hypotheses for causal pathways underlying the GWAS association between a variant and phenotype. Several large-scale studies underway aim not only to include comprehensive clinical measures, but also to capture renal tissue, DNA and other biosamples for large-scale molecular analysis (ERCB, Systems Biology towards Novel Chronic Kidney Disease Diagnosis and Treatment (SYSKID)46, Nephrotic Syndrome Study Network (NEPTUNE) and others47). The availability of such measures increases the opportunity for linking expression to GWAS phenotype relevant traits to focus candidate gene sets as in the CKD study.
The CKD study illustrates the utility of GFR as a linking trait, but other measures such as albumin-creatinine ratio (ACR), renal histologic morphometry, and levels of metabolites in urine may also be useful linking traits. In particular, preliminary analysis of expression correlated morphometric scores suggest they are good candidates as more direct, and very early, measures of disease progression48. In a clinical setting, this is especially intriguing since the compensatory abilities of the kidney often prevent the early detection of renal impairment by standard serum- or urine-based parameters.
Animal Models: Functional Validation
The previous sections demonstrate uses of whole genome expression data to identify or characterize novel gene variants associated with renal disease. However the path to clinical utility requires experiments that demonstrate the associated variants impact disease pathogenesis and that define their function. Such studies are difficult in humans and require the use of model organisms, which can also be coupled with in vitro systems, to validate the genetic discovery, define its mechanism(s) and help select new therapeutic, diagnostic or prognostic targets. We will describe several studies, which use model organisms in novel designs, to decode the processes by which human genetic variants regulate their associated diseases. Although the phenotypes in these studies are not renal, the approaches can be applied to kidney diseases.
Mice continue to be the workhorse model organ system, and gene function is often revealed in mice when novel genes, identified by genotype-phenotype mapping strategies, are deleted. Yet generic loss- and gain-of-function approaches will not clarify mechanisms by which associated genetic variants regulate disease pathogenesis. However, mice can be used to recapitulate the human phenotype caused by a specific genetic variant and creative experimental design will decode pathogenesis49. The dissection of the etiology of the hypotonia in intermediate DEND syndrome (iDEND) provides an elegant illustration of this approach50. iDEND is a rare genetic disorder characterized by neonatal diabetes, muscle hypotonia and delayed speech and motor milestones. Gain of-function mutations in KCNJ11 are associated with iDEND. KCNJ11 encodes the Kir6.2 inward-rectifier type potassium channel pore and interacts with a regulatory sulfonylurea receptor subunit to generate a functional ATP-gated K+ [KATP] channel. iDEND patients are often unable to walk due to lower extremity weakness, a phenotype that could be explain by KATP channel expression in either the brain or skeletal muscle. To address this question, mice were engineered to selectively express the most common human mutation associated with iDEND in muscle and nerve. Surprisingly, the resulting motor phenotypes, which mimic the human disease, show the neuron-targeted mutation is responsible for motor impairment. The clinical implications of these data are immediate and testable. Infants with neonatal diabetes and developmental delay, muscle weakness and speech problems may be more effectively treated with sulfonylurea drugs that target the SUR1 sulfonylurea receptor subtype, the predominant SUR regulatory subunit in the nervous system. In addition, sulfonylurea drugs with better blood-brain barrier penetration might increase efficacy in children with this syndrome. Although this example focuses on a Mendelian disorder, similar designs have been used in mice for variants controlling common traits51.
In contrast to mice, simple model organisms provide opportunities for higher throughput gene manipulation and phenotype quantification, especially for common diseases that often associate with many non-coding genetic variants in genome wide association studies. Zebrafish have been cleverly used to dissect function of three linkage disequilibrium blocks, which harbor non-coding SNPs reproducibly associated with type 2 diabetes52. The experimental design employs a computational analysis to identify regions of synteny between teleost and human genomes, termed genomic regulatory blocks (GRBs), that control gene expression53,54. Highly conserved noncoding regions (HCNE), contained within both the GRB and diabetes risk allele-containing LD block, were used to construct zebrafish reporter vectors. The results suggest DM-associated SNPs regulate genes that control pancreatic development and insulin secretion. In two cases, the HCNE drove expression of gene distant from the gene nominally associated with the diabetes risk SNP but within the GRB. Additionally, this study shows that zebrafish embryos can respond to human HCNE [even if not highly conserved in teleosts] in a time- and tissue-restricted manner. A conceptually similar design in mice further demonstrates utility of exploring human gene variants associated with common diseases55. Targeted deletion of a 70kb non-coding interval in mice, which is orthologous to the 9p21 risk interval for coronary artery disease (CAD), provided direct evidence that this region affects CAD progression by regulating vascular cell proliferation. As noted these are not renal studies, but may serve as exemplars for future kidney disease research where the rat may be a good choice both for modeling human physiology and the opportunity for gene targeting (see, e.g., Sato et al.56).
Discussion
Our capability to define the genetic landscape of patients with kidney disease has reached a level of resolution unimaginable just a few years ago, and is expected to reach true genome wide sequencing capabilities in the near future. The main challenge ahead for the renal research community is the integration of this information with renal function, disease pathogenesis and disease course. For progress to be made in understanding common genetic kidney disease, genetic variants need to be linked with phenotypic outcomes using integrative strategies to identify intermediate cellular and tissue disease mechanisms, and validate these mechanisms in model organisms. Systems effects of variants are expected to be observable at various levels of cellular activity, leading to a systems genetics approach where the effects of genetic variants are identified at different levels of cellular activity57. By integrating metabolic and proteomic observations, in addition to measuring gene expression and clinical traits, we can hope to better refine the effect of variants on renal disease (Figure 4). Experience gained with systems genetics studies already done in human58,59, plant60,61 and other model systems62,63 can help guide this work forward, providing both potential strategies and tools, as well as cautions when to expect complex environmental and other confounders.
Figure 4.
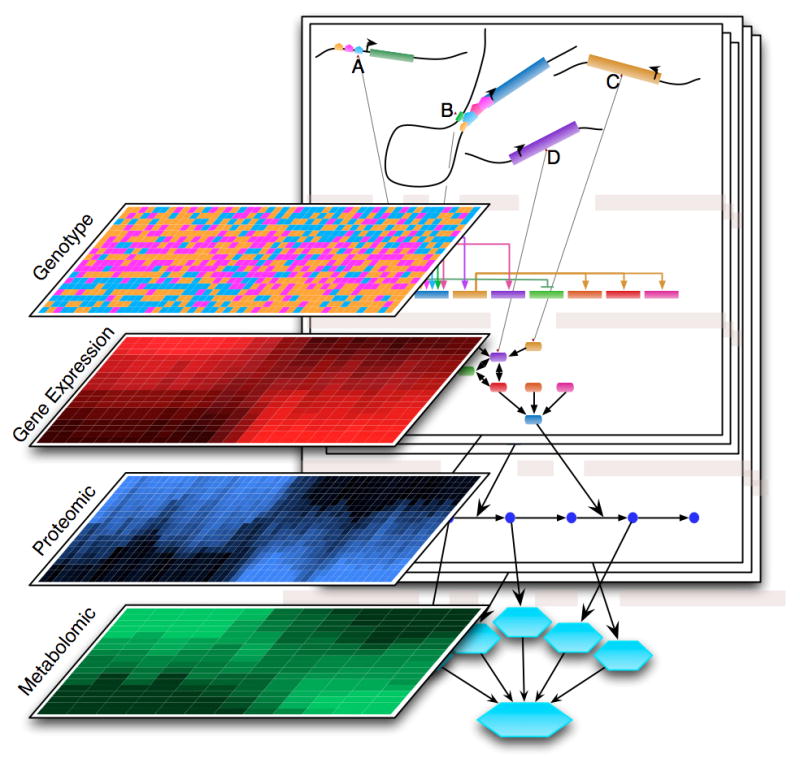
Systems genetics strategy for studying systems effects of candidate variants. Various high-throughput technologies allow observation of the state of the molecular mechanism of the cell as quantitative measures of macromolecules (shown are RNA, proteins, and metabolites) that can be used in quantitative trait locus (QTL) analysis.
A key challenge for moving ahead is the ascertainment of sufficiently large human disease cohorts with complete, robust molecular measures and clinical observations. Having sufficient starting material from renal tissue compartments and urinary biosamples for metabolic or proteomic observations may pose a particular challenge to straightforward systems genetics strategies, so further technical adaptation of these approaches may be necessary. However, the adoption of uniform protocols for procuring the samples and data across studies will provide opportunity for more robust analyses, and will be central to developing large cohorts to capture genetic heterogeneity adequately. Still, we must acknowledge that these approaches are limited by gene expression from biopsies representing a snapshot of regulatory activity in the kidney, and will need to look to information capable of capturing dynamic aspects of the disease (i.e., urine based measures) as well as epigenetic profiles that capture the effects of prior events.
Results from the analyses of genetic candidates in humans will be associative and require functional validation. Employing an appropriate animal model to demonstrate the systems effect of a variant on disease pathophysiology is necessary to confirm the hypotheses of functional interdependence generated in silico. Ingenious use of murine transgenic technology and human systems genetics can uncover novel disease mechanism. Evaluating the consequences of disease variants on regulatory pathways in the transgenic animals will allow a feedback loop to test and refine the initial systems genetics hypotheses.
Understanding the genotype-phenotype continuum of renal disease is already redefining our concepts of human disease pathophysiology. The discovery that a single locus on Chromosome 22 can be responsible for a significant part of the excess risk for renal disease in African Americans is a first indication of the power of these approaches9,20,64. Establishing patient cohorts, experimental tools and analytical workflows will be required to integrate this information into our current knowledge base so that we can reap many more unexpected insights into renal disease in the near future.
Acknowledgments
O’Brien Renal Center (NIH P30 # DK081943-01)
National Center for Integrative Bioinformatics (NIH U54 # DA021519 01A1)
Footnotes
Disclosure
All authors have no competing interests.
Contributor Information
Benjamin J. Keller, Department of Computer Science, Eastern Michigan University, Ypsilanti, Michigan, USA
Sebastian Martini, Division of Nephrology, Department of Internal Medicine, University of Michigan, Ann Arbor, Michigan, USA
John R. Sedor, Kidney Disease Research Center, Departments of Medicine and Physiology and Biophysics, Case Western Reserve University, Cleveland, Ohio, USA
Matthias Kretzler, Division of Nephrology, Department of Internal Medicine, University of Michigan, Ann Arbor, Michigan, USA
References
- 1.Manolio TA, Collins FS, Cox NJ, et al. Finding the missing heritability of complex diseases. Nature. 2009;461:747–753. doi: 10.1038/nature08494. [DOI] [PMC free article] [PubMed] [Google Scholar]
- 2.Ferguson R, Grim CE, Opgenorth TJ. A familial risk of chronic renal failure among blacks on dialysis? J Clin Epidemiol. 1988;41:1189–1196. doi: 10.1016/0895-4356(88)90023-6. [DOI] [PubMed] [Google Scholar]
- 3.Gudbjartsson DF, Holm H, Indridason OS, et al. Association of variants at UMOD with chronic kidney disease and kidney stones-role of age and comorbid diseases. PLoS Genet. 2010;6:e1001039. doi: 10.1371/journal.pgen.1001039. [DOI] [PMC free article] [PubMed] [Google Scholar]
- 4.Pezzolesi MG, Katavetin P, Kure M, et al. Confirmation of genetic associations at ELMO1 in the GoKinD collection supports its role as a susceptibility gene in diabetic nephropathy. Diabetes. 2009;58:2698–2702. doi: 10.2337/db09-0641. [DOI] [PMC free article] [PubMed] [Google Scholar]
- 5.Ng DPK, Tai BC, Koh D, et al. Angiotensin-I converting enzyme insertion/deletion polymorphism and its association with diabetic nephropathy: a meta-analysis of studies reported between 1994 and 2004 and comprising 14,727 subjects. Diabetologia. 2005;48:1008–1016. doi: 10.1007/s00125-005-1726-2. [DOI] [PubMed] [Google Scholar]
- 6.Köttgen A, Pattaro C, Böger CA, et al. New loci associated with kidney function and chronic kidney disease. Nat Genet. 2010;42:376–384. doi: 10.1038/ng.568. [DOI] [PMC free article] [PubMed] [Google Scholar]
- 7.Greene CN, Keong LM, Cordovado SK, et al. Sequence variants in the PLEKHH2 region are associated with diabetic nephropathy in the GoKinD study population. Hum Genet. 2008;124:255–262. doi: 10.1007/s00439-008-0548-y. [DOI] [PubMed] [Google Scholar]
- 8.Tzur S, Rosset S, Shemer R, et al. Missense mutations in the APOL1 gene are highly associated with end stage kidney disease risk previously attributed to the MYH9 gene. Hum Genet. 2010;128:345–350. doi: 10.1007/s00439-010-0861-0. [DOI] [PMC free article] [PubMed] [Google Scholar]
- 9.Freedman BI, Kopp JB, Langefeld CD, et al. The apolipoprotein L1 (APOL1) gene and nondiabetic nephropathy in African Americans. J Am Soc Nephrol. 2010;21:1422–1426. doi: 10.1681/ASN.2010070730. [DOI] [PMC free article] [PubMed] [Google Scholar]
- 10.Maeda S, Kobayashi MA, Araki SI, et al. A single nucleotide polymorphism within the acetyl-coenzyme A carboxylase beta gene is associated with proteinuria in patients with type 2 diabetes. PLoS Genet. 2010;6:e1000842. doi: 10.1371/journal.pgen.1000842. [DOI] [PMC free article] [PubMed] [Google Scholar]
- 11.Pezzolesi MG, Poznik GD, Mychaleckyj JC, et al. Genome-wide association scan for diabetic nephropathy susceptibility genes in type 1 diabetes. Diabetes. 2009;58:1403–1410. doi: 10.2337/db08-1514. [DOI] [PMC free article] [PubMed] [Google Scholar]
- 12.Stanescu HC, Arcos-Burgos M, Medlar A, et al. Risk HLA-DQA1 and PLA(2)R1 alleles in idiopathic membranous nephropathy. N Engl J Med. 2011;364:616–626. doi: 10.1056/NEJMoa1009742. [DOI] [PubMed] [Google Scholar]
- 13.Gharavi AG, Kiryluk K, Choi M, et al. Genome-wide association study identifies susceptibility loci for IgA nephropathy. Nat Genet. 2011;43:321–327. doi: 10.1038/ng.787. [DOI] [PMC free article] [PubMed] [Google Scholar]
- 14.Jafari Y, Rahimi Z, Vaisi-Raygani A, et al. Interaction of eNOS polymorphism with MTHFR variants increase the risk of diabetic nephropathy and its progression in type 2 diabetes mellitus patients. Mol Cell Biochem. 2011 doi: 10.1007/s11010-011-0770-0. [DOI] [PubMed] [Google Scholar]
- 15.Tien KJ, Tu ST, Chou CW, et al. Apolipoprotein e polymorphism and the progression of diabetic nephropathy in type 2 diabetes. Am J Nephrol. 2011;33:231–238. doi: 10.1159/000324561. [DOI] [PubMed] [Google Scholar]
- 16.Lee JS, Park HK, Suh JS, et al. Toll-like receptor 1 gene polymorphisms in childhood IgA nephropathy: a case-control study in the Korean population. Int J Immunogenet. 2011;38:133–138. doi: 10.1111/j.1744-313X.2010.00978.x. [DOI] [PubMed] [Google Scholar]
- 17.Qin L, Lv J, Zhou X, et al. Association of IRF5 gene polymorphisms and lupus nephritis in a Chinese population. Nephrology (Carlton) 2010;15:710–713. doi: 10.1111/j.1440-1797.2010.01327.x. [DOI] [PubMed] [Google Scholar]
- 18.Chen SY, Chen CH, Huang YC, et al. Effect of IL-6 C-572G polymorphism on idiopathic membranous nephropathy risk in a Han Chinese population. Ren Fail. 2010;32:1172–1176. doi: 10.3109/0886022X.2010.516857. [DOI] [PubMed] [Google Scholar]
- 19.Kim S, Chin HJ, Na KY, et al. Single nucleotide polymorphisms in the phospholipase a(2) receptor gene are associated with genetic susceptibility to idiopathic membranous nephropathy. Nephron Clin Pract. 2011;117:c253–8. doi: 10.1159/000320194. [DOI] [PubMed] [Google Scholar]
- 20.Genovese G, Friedman DJ, Ross MD, et al. Association of trypanolytic ApoL1 variants with kidney disease in African Americans. Science. 2010;329:841–845. doi: 10.1126/science.1193032. [DOI] [PMC free article] [PubMed] [Google Scholar]
- 21.Edenberg HJ, Liu Y. Laboratory methods for high-throughput genotyping. Cold Spring Harb Protoc 2009. 2009 doi: 10.1101/pdb.top62. pdb.top62. [DOI] [PubMed] [Google Scholar]
- 22.He J, Chuang P, Ma’ayan A, et al. Systems biology approach of kidney disease. Kidney Int [Google Scholar]
- 23.Dekker J. Gene regulation in the third dimension. Science. 2008;319:1793–1794. doi: 10.1126/science.1152850. [DOI] [PMC free article] [PubMed] [Google Scholar]
- 24.Cookson W, Liang L, Abecasis G, et al. Mapping complex disease traits with global gene expression. Nat Rev Genet. 2009;10:184–194. doi: 10.1038/nrg2537. [DOI] [PMC free article] [PubMed] [Google Scholar]
- 25.Cheung VG, Spielman RS. Genetics of human gene expression: mapping DNA variants that influence gene expression. Nat Rev Genet. 2009;10:595–604. doi: 10.1038/nrg2630. [DOI] [PMC free article] [PubMed] [Google Scholar]
- 26.Wheeler HE, Metter EJ, Tanaka T, et al. Sequential use of transcriptional profiling, expression quantitative trait mapping, and gene association implicates MMP20 in human kidney aging. PLoS Genet. 2009;5:e1000685. doi: 10.1371/journal.pgen.1000685. [DOI] [PMC free article] [PubMed] [Google Scholar]
- 27.Nica AC, Montgomery SB, Dimas AS, et al. Candidate causal regulatory effects by integration of expression QTLs with complex trait genetic associations. PLoS Genet. 2010;6:e1000895. doi: 10.1371/journal.pgen.1000895. [DOI] [PMC free article] [PubMed] [Google Scholar]
- 28.Nicolae DL, Gamazon E, Zhang W, et al. Trait-associated SNPs are more likely to be eQTLs: annotation to enhance discovery from GWAS. PLoS Genet. 2010;6:e1000888. doi: 10.1371/journal.pgen.1000888. [DOI] [PMC free article] [PubMed] [Google Scholar]
- 29.Babak T, Garrett-Engele P, Armour CD, et al. Genetic validation of whole-transcriptome sequencing for mapping expression affected by cis-regulatory variation. BMC Genomics. 2010;11:473. doi: 10.1186/1471-2164-11-473. [DOI] [PMC free article] [PubMed] [Google Scholar]
- 30.Veyrieras JB, Kudaravalli S, Kim SY, et al. High-resolution mapping of expression-QTLs yields insight into human gene regulation. PLoS Genet. 2008;4:e1000214. doi: 10.1371/journal.pgen.1000214. [DOI] [PMC free article] [PubMed] [Google Scholar]
- 31.Breitling R, Li Y, Tesson BM, et al. Genetical genomics: spotlight on QTL hotspots. PLoS Genet. 2008;4:e1000232. doi: 10.1371/journal.pgen.1000232. [DOI] [PMC free article] [PubMed] [Google Scholar]
- 32.Chen Y, Zhu J, Lum PY, et al. Variations in DNA elucidate molecular networks that cause disease. Nature. 2008;452:429–435. doi: 10.1038/nature06757. [DOI] [PMC free article] [PubMed] [Google Scholar]
- 33.Emilsson V, Thorleifsson G, Zhang B, et al. Genetics of gene expression and its effect on disease. Nature. 2008;452:423–428. doi: 10.1038/nature06758. [DOI] [PubMed] [Google Scholar]
- 34.Schadt EE, Molony C, Chudin E, et al. Mapping the genetic architecture of gene expression in human liver. PLoS Biol. 2008;6:e107. doi: 10.1371/journal.pbio.0060107. [DOI] [PMC free article] [PubMed] [Google Scholar]
- 35.Zhu J, Zhang B, Smith EN, et al. Integrating large-scale functional genomic data to dissect the complexity of yeast regulatory networks. Nat Genet. 2008;40:854–861. doi: 10.1038/ng.167. [DOI] [PMC free article] [PubMed] [Google Scholar]
- 36.Listgarten J, Kadie C, Schadt EE, et al. Correction for hidden confounders in the genetic analysis of gene expression. Proc Natl Acad Sci USA. 2010 doi: 10.1073/pnas.1002425107. [DOI] [PMC free article] [PubMed] [Google Scholar]
- 37.Zhong H, Beaulaurier J, Lum PY, et al. Liver and adipose expression associated SNPs are enriched for association to type 2 diabetes. PLoS Genet. 2010;6:e1000932. doi: 10.1371/journal.pgen.1000932. [DOI] [PMC free article] [PubMed] [Google Scholar]
- 38.Köttgen A, Glazer NL, Dehghan A, et al. Multiple loci associated with indices of renal function and chronic kidney disease. Nat Genet. 2009;41:712–717. doi: 10.1038/ng.377. [DOI] [PMC free article] [PubMed] [Google Scholar]
- 39.Schmid H, Boucherot A, Yasuda Y, et al. Modular Activation of Nuclear Factor- B Transcriptional Programs in Human Diabetic Nephropathy. Diabetes. 2006;55:2993–3003. doi: 10.2337/db06-0477. [DOI] [PubMed] [Google Scholar]
- 40.Cohen CD, Frach K, Schlöndorff D, et al. Quantitative gene expression analysis in renal biopsies: a novel protocol for a high-throughput multicenter application. Kidney Int. 2002;61:133–140. doi: 10.1046/j.1523-1755.2002.00113.x. [DOI] [PubMed] [Google Scholar]
- 41.Yasuda Y, Cohen CD, Henger A, et al. Gene expression profiling analysis in nephrology: towards molecular definition of renal disease. Clin Exp Nephrol. 2006;10:91–98. doi: 10.1007/s10157-006-0421-z. [DOI] [PubMed] [Google Scholar]
- 42.Lindenmeyer MT, Eichinger F, Sen K, et al. Systematic analysis of a novel human renal glomerulus-enriched gene expression dataset. PLoS ONE. 2010;5:e11545. doi: 10.1371/journal.pone.0011545. [DOI] [PMC free article] [PubMed] [Google Scholar]
- 43.Lindenmeyer MT, Kretzler M, Boucherot A, et al. Interstitial vascular rarefaction and reduced VEGF-A expression in human diabetic nephropathy. J Am Soc Nephrol. 2007;18:1765–1776. doi: 10.1681/ASN.2006121304. [DOI] [PubMed] [Google Scholar]
- 44.Cohen CD, Klingenhoff A, Boucherot A, et al. Comparative promoter analysis allows de novo identification of specialized cell junction-associated proteins. Proc Natl Acad Sci USA. 2006;103:5682–5687. doi: 10.1073/pnas.0511257103. [DOI] [PMC free article] [PubMed] [Google Scholar]
- 45.Maciel TT, Kempf H, Campos AH. Targeting bone morphogenetic protein signaling on renal and vascular diseases. Curr Opin Nephrol Hypertens. 2010;19:26–31. doi: 10.1097/MNH.0b013e328332fc13. [DOI] [PubMed] [Google Scholar]
- 46.Rudnicki M, Perco P, Enrich J, et al. Hypoxia response and VEGF-A expression in human proximal tubular epithelial cells in stable and progressive renal disease. Lab Invest. 2009;89:337–346. doi: 10.1038/labinvest.2008.158. [DOI] [PubMed] [Google Scholar]
- 47.Si H, Banga RS, Kapitsinou P, et al. Human and murine kidneys show gender- and species-specific gene expression differences in response to injury. PLoS ONE. 2009;4:e4802. doi: 10.1371/journal.pone.0004802. [DOI] [PMC free article] [PubMed] [Google Scholar]
- 48.Perco P, Oberbauer R. Integrative analysis of -omics data and histologic scoring in renal disease and transplantation: renal histogenomics. Semin Nephrol. 2010;30:520–530. doi: 10.1016/j.semnephrol.2010.07.009. [DOI] [PMC free article] [PubMed] [Google Scholar]
- 49.Terzic A, Perez-Terzic C. Channelopathies: decoding disease pathogenesis. Sci Transl Med. 2010;2:42ps37. doi: 10.1126/scitranslmed.3001433. [DOI] [PubMed] [Google Scholar]
- 50.Clark RH, McTaggart JS, Webster R, et al. Muscle dysfunction caused by a KATP channel mutation in neonatal diabetes is neuronal in origin. Science. 2010;329:458–461. doi: 10.1126/science.1186146. [DOI] [PMC free article] [PubMed] [Google Scholar]
- 51.Musunuru K, Strong A, Frank-Kamenetsky M, et al. From noncoding variant to phenotype via SORT1 at the 1p13 cholesterol locus. Nature. 2010;466:714–719. doi: 10.1038/nature09266. [DOI] [PMC free article] [PubMed] [Google Scholar]
- 52.Ragvin A, Moro E, Fredman D, et al. Long-range gene regulation links genomic type 2 diabetes and obesity risk regions to HHEX, SOX4, and IRX3. Proc Natl Acad Sci USA. 2010;107:775–780. doi: 10.1073/pnas.0911591107. [DOI] [PMC free article] [PubMed] [Google Scholar]
- 53.Alexander RP, Fang G, Rozowsky J, et al. Annotating non-coding regions of the genome. Nat Rev Genet. 2010;11:559–571. doi: 10.1038/nrg2814. [DOI] [PubMed] [Google Scholar]
- 54.Kikuta H, Laplante M, Navratilova P, et al. Genomic regulatory blocks encompass multiple neighboring genes and maintain conserved synteny in vertebrates. Genome Res. 2007;17:545–555. doi: 10.1101/gr.6086307. [DOI] [PMC free article] [PubMed] [Google Scholar]
- 55.Visel A, Zhu Y, May D, et al. Targeted deletion of the 9p21 non-coding coronary artery disease risk interval in mice. Nature. 2010;464:409–412. doi: 10.1038/nature08801. [DOI] [PMC free article] [PubMed] [Google Scholar]
- 56.Sato Y, Wharram BL, Lee SK, et al. Urine podocyte mRNAs mark progression of renal disease. J Am Soc Nephrol. 2009;20:1041–1052. doi: 10.1681/ASN.2007121328. [DOI] [PMC free article] [PubMed] [Google Scholar]
- 57.Jansen RC, Tesson BM, Fu J, et al. Defining gene and QTL networks. Curr Opin Plant Biol. 2009;12:241–246. doi: 10.1016/j.pbi.2009.01.003. [DOI] [PubMed] [Google Scholar]
- 58.Romanoski CE, Lee S, Kim MJ, et al. Systems genetics analysis of gene-by-environment interactions in human cells. Am J Hum Genet. 2010;86:399–410. doi: 10.1016/j.ajhg.2010.02.002. [DOI] [PMC free article] [PubMed] [Google Scholar]
- 59.Plaisier CL, Horvath S, Huertas-Vazquez A, et al. A systems genetics approach implicates USF1, FADS3, and other causal candidate genes for familial combined hyperlipidemia. PLoS Genet. 2009;5:e1000642. doi: 10.1371/journal.pgen.1000642. [DOI] [PMC free article] [PubMed] [Google Scholar]
- 60.Wentzell AM, Rowe HC, Hansen BG, et al. Linking metabolic QTLs with network and cis-eQTLs controlling biosynthetic pathways. PLoS Genet. 2007;3:1687–1701. doi: 10.1371/journal.pgen.0030162. [DOI] [PMC free article] [PubMed] [Google Scholar]
- 61.Fu J, Keurentjes JJB, Bouwmeester H, et al. System-wide molecular evidence for phenotypic buffering in Arabidopsis. Nat Genet. 2009;41:166–167. doi: 10.1038/ng.308. [DOI] [PubMed] [Google Scholar]
- 62.Jumbo-Lucioni P, Ayroles J, Chambers M, et al. Systems genetics analysis of body weight and energy metabolism traits in Drosophila melanogaster. BMC Genomics. 2010;11:297. doi: 10.1186/1471-2164-11-297. [DOI] [PMC free article] [PubMed] [Google Scholar]
- 63.Nuzhdin SV, Brisson JA, Pickering A, et al. Natural genetic variation in transcriptome reflects network structure inferred with major effect mutations: insulin/TOR and associated phenotypes in Drosophila melanogaster. BMC Genomics. 2009;10:124. doi: 10.1186/1471-2164-10-124. [DOI] [PMC free article] [PubMed] [Google Scholar]
- 64.Kopp JB, Winkler CA, Nelson GW. MYH9 genetic variants associated with glomerular disease: what is the role for genetic testing? Semin Nephrol. 2010;30:409–417. doi: 10.1016/j.semnephrol.2010.06.007. [DOI] [PMC free article] [PubMed] [Google Scholar]