Abstract
FISH probes are generally made out of BAC clones with genomic DNA containing a variable amount of repetitive DNA that will need to be removed or blocked for FISH analysis. To generate repeat free (RF) Probes without loss in genomic coverage, a random library is made from BAC clones by whole-genome amplification (WGA). Libraries are denatured in the presence of excess C0t-1 DNA and allowed to re-anneal followed by digestion of all double-stranded elements by duplex-specific nuclease (DSN). Selective amplification of all elements not containing repetitive sequences is realized by a sequential amplification. The final RF products can be re-amplified and used as a stock for future probe production. The RF probes have a lower background, the signal intensity build up is faster and there is no need for blocking DNA. The signal to background ratio of the RF was higher as compared to repeat containing probes.
INTRODUCTION
Fluorescent In Situ Hybridization (FISH) is a powerful technique for detection of RNA or DNA sequences in cells (1–3). FISH is applied for gene mapping, diagnosis of chromosomal abnormalities and studies of cellular structure and function. In most cases, FISH probes are made out of BAC clones which contain mapped random pieces of genomic DNA. As these probes contain a variable amount of repetitive DNA, the hybridization needs to be blocked by a large excess of non-labeled repetitive DNA (4,5). To simplify and improve FISH assays, several attempts have been made to remove repetitive sequences from isolated genomic sequences (6–9). Although successful these techniques are labor intensive and do not provide a source of probes that can be used for the simple production of repeat-free (RF) FISH probes. Here we introduce a simple and reliable method to remove the repetitive DNA from the FISH probes resulting in an easy PCR amplifiable product with a minimal loss in genomic coverage and probe performance.
MATERIALS AND METHODS
BAC clones and FISH probes
Three BAC clones were chosen in the 17q21.1 region, spanning 454 kb over the ERBB2 gene, three clones in the 10q23.31 region spanning 372 kb over the PTEN gene and three clones in the Xq12 region spanning 340 kb over the AR gene (Table 1). Clones were analyzed using RepeatMasker version 3.2.8 with repeat library RM-20090604 (Smit, AFA, Hubley, R & Green, P. RepeatMasker Open-3.0. 1996-2010 http://www.repeatmasker.org).Clones used for ERG (21q22.2) are described by by Attard et al. (10) and the centromere probes were purchased from Kreatech (Kreatech, Amsterdam, CENX cat. KBI20023, CEN17 cat. KBI20017, CEN10 cat. KBI20010).
Table 1.
BAC clones used for experiments
| Gene region | Cloneid | bp | SINE's (%) | LINE's (%) | Total interspersed repeats (%) | Coverage (bp) |
|---|---|---|---|---|---|---|
| ERBB2 | CTD-387H17 | 227 857 | 27.1 | 12.1 | 49.6 | 454 000 |
| ERBB2 | RP11-94L15 | 161 815 | 24.1 | 6.3 | 34.2 | |
| ERBB2 | RP11-62N23 | 154 278 | 24.2 | 6.4 | 32.8 | |
| AR | RP11-479J1 | 165 974 | 10.7 | 31.7 | 45.8 | 340 000 |
| AR | RP11-383C12 | 161 416 | 9.2 | 35.7 | 51.2 | |
| AR | RP11-963N10 | 198 420 | 6.4 | 52.1 | 69.4 | |
| PTEN | CTD-3007P15 | 130 725 | 16.9 | 19.5 | 48.5 | 372 000 |
| PTEN | CTD-2104P21 | 100 475 | 17.2 | 21.8 | 48.7 | |
| PTEN | RP11-959L24 | 180 586 | 9.2 | 15.4 | 36.6 |
RF procedure
BAC clones were isolated from the bacterial culture using a Qiagen Large Construct Kit (Qiagen, Hilden, Germany, cat. 12 462) minimizing the bacterial genomic DNA in the sample. BAC clones were randomly fragmented according to manufacturer's instructions of the WGA1 kit (Sigma, St Louis, MO, cat. WGA-1) linkers were attached and a first round of amplification was performed according to the same manufacturer’s instructions. The PCR product was purified with the Qiagen PCR purification kit and quantified using a Nanodrop ND1000 (Thermo scientific, Wilmington, DE, USA). Fifty nanogram of this material was added to a 40× excess of C0t-1 DNA (Invitrogen, Carlsbad, CA, USA, cat. 15279-011) in 300 mM NaCl in a total volume of 10 µl and denatured for 10 min at 95°C. The mixture was cooled to 65°C and allowed to hybridize in the presence of 2 U Duplex specific Nuclease (DSN) (Evrogen, Moscow, Russia, cat. EA001) for 90 min in 1× DSN buffer in a total volume of 20 µl. After digestion of the duplex DNA formed during hybridization, the non-restricted fragments of the original BAC clones in the mixture were re-amplified with the WGA-3 kit (Sigma, cat. WGA-3). From this material, 10 ng is used to re-amplify to larger quantities with the WGA-3 kit.
qPCR
qPCR was used to measure the depletion of repetitive elements from the WGA BAC DNA by the DSN treatment. PCR primers were designed to amplify a segment of an alu family repeat sequence present in parental BAC clone to obtain a representative repeat sequence (primers: forward CCAGCCTGACCAACATGGA, reverse CCACGCCTGGCTAATTTTGT). As a reference gene, a primer pair was designed to amplify a unique fragment of the coding sequence of ERBB2 gene also present on the BAC (primers: forward CTGGCCCTGAAAGGGAGTATG, reverse GGACCAAGCTGCTGGGATT). Pre-depletion DNA consisted of the products of the initial whole-genome amplification (WGA) reaction. Post-depletion samples were DNA samples from the third sequential PCR following repeat depletion. Ct values reflect the average Ct of duplicate PCR measurements using 1 ng of DNA as template in each reaction. Time of exposure to DSN was also measured by qPCR for time points from 0 to 90 min. ΔCt was defined as the Ct of the reference primer pair minus the CT of the repetitive primer pair. ΔΔCt is defined as the ΔCt of the pre-depletion samples minus the ΔCt of the post-DSN depletion samples. A log Delta RN value of 60 was set as the threshold for Ct calculations.
FISH Probe labeling
To show that the procedure is not restricted to a single DNA labeling procedure both ULS-dye and NHS-dye labeling were used. For ULS (dy550) labeling, RF and non-RF PCR products were purified with the Qiagen PCR purification kit (Qiagen, cat. 28 106), fragmented by sonification to a size of 100–400 bp and quantified using a Nanodrop ND1000. Fragmented PCR products were labeled with dy550-ULS (Kreatech, Amsterdam, The Netherlands) according to manufacturer's instructions. For aminoallyl incorporation and NHS-dye labeling, the Sigma WGA-3 reamplification kit was used according to manufacturer's instructions except that 80% of the dTTP is replaced by aminoallyl-dUTP (Sigma, cat. A0410). The amplified products were purified with the Qiagen PCR purification kit (Qiagen, cat 28 106), with the wash buffer replaced by 80% ethanol to avoid amines in the eluate. Purified products are fragmented by sonification to a size of 100–400 bp and quantified using a Nanodrop ND1000. NHS dye labeling is done according to manufacturers instructions (Invitrogen). In short, 5 µg of the sonicated DNA is labeled for 2 h at room temperature with tetramethylrhodamine (TAMRA) NHS (Invitrogen, cat. T6105) in 2.5 mg/ml sodium bicarbonate followed by a purification with a Qiagen PCR purification kit.
Hybmix
Labeled probes were diluted to a final concentration of 4 ng/µl in a mixture of 50% deionized formamide (Invitrogen, cat. AM9342), 1xSSC (Sigma, cat. S6639) and 10% dextran sulfate (Sigma, cat. D8906). Labeled repetitive sequences in the non-RF probes were blocked with a 25× excess of C0t-1 DNA (Invitrogen, cat 15279-011).
Preparation of formalin fixed paraffin-embedded cell lines
Cells from the breast cancer cell line MCF7 (ATCC HTB22)cells were grown, trypsinized for harvesting, washed and suspended into 0.5 ml of human plasma. The cell suspension is incubated for 10 min at room temperature with 25 µl of 100 U/ml thrombin (Sigma, cat. T6884). The formed cell clot was fixed overnight in 4% formaldehyde in PBS. After fixation the clot was dehydrated with 70, 80, 90, 96 and 100% ethanol and butanol and embedded in paraffin.
FISH on formalin fixed paraffin-embedded cell lines
Formalin fixed and paraffin-embedded MCF7cells were sectioned at 5 µm, mounted to microscope slides (Menzel, Braunschweig, Germany cat. J3800AMNZ) and baked overnight at 50°C. Slides were pretreated with the Poseidon tissue pretreatment kit (Kreatech, Amsterdam, The Netherlands) according to the package insert with a 15 min pepsin treatment. Ten microliter hybmix was applied under an 18 × 18 mm coverslip and sealed with rubber cement (Kreatech, Amsterdam, The Netherlands). Samples were co-denatured for 5 min at 80°C and hybridized at 42°C for 0.5 to 16 h. After hybridization, the rubber cement and coverslips were removed and slides were washed for 10 min at 37°C and for 2 min at 72°C in 0.4× SSC/0.1% Tween-20. Next slides were dehydrated and dried. Ten microliter Vectashield/DAPI (Vector labs, Burlingame, CA, USA, cat H1200) was applied and covered with a coverslip.
Preparation of metaphase spreads
Normal human metaphase spreads were made by incubating the buffy coat from a healthy donor in 15 ml GIBCO™ BP max™ karyotyping medium (Invitrogen, cat. 12 557 013) for 72 h at 37°C and 5% CO2. The suspension was incubated for 1 h with Colcemid at 0.17 µg/ml (Invitrogen, cat. 15 212 046). Cells were incubated for 2 × 10 min with 10 ml fresh 0.075 M KCl solution at 37°C, fixed with 3 × 10 ml ice cold methanol/acetic acid (3:1) and stored at −20°C.
FISH on metaphase spreads
Cells were dropped onto clean cold (4°C) and wet microscope slides and were allowed to dry for 1 h. After drying, slides were fixed in 1% formaldehyde in PBS for 5 min, rinsed with PBS, dehydrated in graded ethanol 70, 95 and 100% for 1 min each and dried again. Ten microliters hybmix were applied under an 18 × 18mm coverslip and sealed with rubber cement (Kreatech, Amsterdam, The Netherlands). Samples were co-denatured for 5 min at 80°C and hybridized at 42°C for 2 h. After hybridization the rubber cement and coverslips were removed and slides were washed for 10 min at 37°C and for 2 min at 72°C in 0.4× SSC/0.1%Tween-20. Next slides were dehydrated and dried. Ten microliters Vectashield/DAPI (Vector labs, Burlingame, CA, USA, cat H1200) were applied and covered with a coverslip.
FISH signal quantification
Slides were analyzed under a Nikon Eclipse E200 microscope using a 40× or 100× oil 1.3NA objective (Nikon, Amstelveen, The Netherlands). For each slide, 5 non-saturated frames were captured using a 12 bit camera (Hamamatsu, Hamamatsu city, Japan) using the same camera settings for each experiment. To obtain an objective measure of the fluorescence background and signals obtained from FISH probes after hybridization with the tissue, quantitative fluorescence measurements were extracted from the images. Figure 1 shows the principles of these measurements using an image taken with a 100× oil 1.3NA objective from a tissue sample hybridized with dy550 labeled ERBB2 probe. The image in Figure 1A shows nuclei of several cells. The nuclei are visible due to the background staining of the FISH probe and contain both in and out of focus FISH probe signals. Figure 1B shows the maximal fluorescent signal intensity across the image of Figure 1A. To compare the signal to background of the FISH probes, the out of focus FISH probes needed to be excluded from the analysis. This was achieved by only using the signals above the 99.97 percentile as the FISH probe signals and the intensity level at the 95 percentile as the background. As illustrated in Figure 1B, seven FISH probe signals were above the 99.97 percentile and the 95 percentile could be used to determine the background. The images used to determine the signal and the background of the probes contained on average of 10.8 signals per image and ranged from 7 to 18 FISH probe signals. Hamamatsu uses an offset intensity value of 200, which is subtracted from the measurement data before calculation of the signal and background intensities.
Figure 1.
FISH signal and background analysis. (A) Image of MCF7 breast cancer cells hybridized for 8 h with RC probes directed against the ERBB2 (17q21) region. (B) Fluorescent signal intensity profile of the image of (A). The fluorescent signals from the probes that are above the 99.97 percentile are considered in-focus and the mean signal of these probes is used to determine the average FISH signal of the probe. The 95 percentile of the fluorescent signals is used to determine the background.
RF FISH signal comparison
FISH signal intensity and background measurements were measured in a time series to show the progression of the FISH signals during hybridization. Paraffin-embedded MCF7 cells were hybridized with ERBB2 probe with and without repeat removal for 1, 2, 3, 4, 6, 8 and 16 h, washed and embedded as described above. The ERBB2 probe was hybridized in hybmix as described above without C0t-1 DNA for the RF probes and with a 25× excess of C0t-1 DNA for RC probes. Hybridizations were done with dy550-ULS labeled probes. Comparisons of FISH quality for RF and RC probes were shown for three different targets hybridized with and without C0t-1 DNA on both metaphase spreads and paraffin-embedded cell lines. The targets used were ERBB2 (17q21.1), PTEN (10q23.31) and AR (Xq12) (Table 1). FISH is performed according to the procedures described above with a hybridization time of 2 h. Hybridizations were done with TAMRA-NHS labeled probes.
RESULTS
Repeat removal process
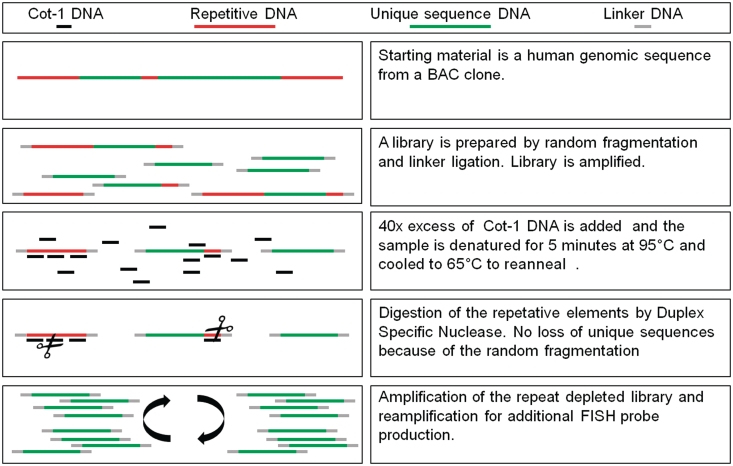
A schematic overview for the generation of RF FISH probes is illustrated in Figure 2. A BAC clone library was generated by WGA. After purification and quantification of the PCR product a 40× excess of C0t-1 DNA was added and denatured at 95°C. The mixture was cooled to 65°C and allowed to hybridize in the presence of 2 U DSN. After digestion of the duplex DNA formed during hybridization, the non-restricted fragments of the original WGA library were re-amplified by three sequential WGA reamplifications. DNA from the third round WGA reamplification was sonicated, fluorescently labeled and used as FISH probe without the use of blocking DNA.
Figure 2.
Schematic overview for the generation of repeats free FISH probes.
Measurement of repetitive sequence removal
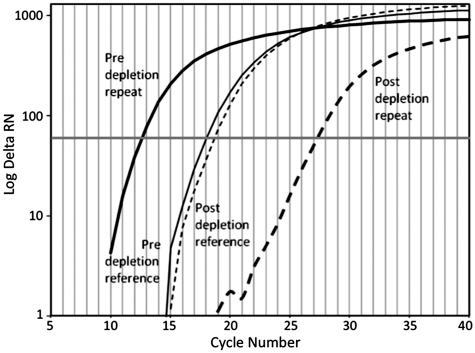
Real-time qPCR was used to measure the depletion of repetitive elements from the WGA BAC DNA by the DSN treatment. A PCR primer pair was designed to amplify a segment of an alu family as a representative repeat sequence present in the parental BAC clone. As a reference gene, a primer pair was designed to amplify a unique fragment of the coding sequence of the ERBB2 gene also present on the BAC.
Figure 3 shows the quantitative PCR measurement of repeat depletion after 90 min DSN treatment. It shows mass normalized PCR data for the reference and repeat sequence before and after repeat depletion with the described procedure. The Ct value of the repetitive sequence increased by 14.7 cycles after depletion whereas the Ct value for the reference sequence increased by only 0.6 cycles. This demonstrates that the depletion reaction heavily favors removal of a representative repetitive sequence compared to unique sequences. Normalization of the repetitive primer pair to the reference primer pair yielded a ΔΔCt value of 14.1 cycles for the sample treated for 90 min with DSN. Aliquots of this reaction were removed at 30 and 60 min and these samples showed ΔΔCt values of 9.2 and 11.4, respectively (data not plotted). This illustrates that increasing the amount of time of exposure to DSN results in increased relative depletion of the repeat sequences.
Figure 3.
Quantitative PCR measurement of the depletion of repeat sequences pre and post 90 min of treatment with DSN. Pre-depletion DNA consisted of the products of the initial WGA reaction (Figure 1). Post-depletion samples were DNA from the third sequential PCR following repeat depletion. Ct values reflect the average Ct of duplicate PCR measurements using 1 ng of DNA as template in each reaction.
FISH signal quantification
To compare the signal with background of repeat containing (RC) and RF probes 5 µm thick sections of formalin fixed paraffin-embedded cells from the breast cancer tumor cell line MCF7 were hybridized with RF and RC probes directed against the ERBB2 (17q21) region. The assays were performed at different hybridization times to uncover differences in the kinetics of the probes. For each experiment, the signal and background values of five different images were evaluated for each time point. As is shown in Figure 4, the optimal signal to background is already achieved after a couple of hours for the RF probes, whereas the signal to background still rises for the RC probes but never reached the maximum that was reached for the RF probes.
Figure 4.
Performance of FISH probes with and devoid of repetitive sequences. Five micrometers thick formalin fixed paraffin-embedded MCF7 cells were hybridized at different incubation times with (RF) and RC probes directed against the ERBB2 (17q21) region. The signal and background intensities were measured as described in Figure 3 and shown in (A). (B) The signal/background ratio of the values shown in A. Each point is the average of five measurements on the same target material.
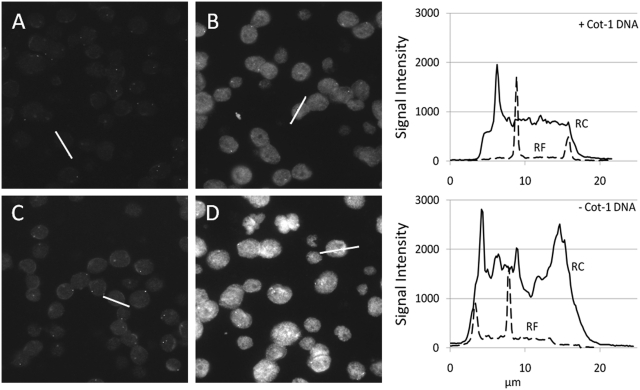
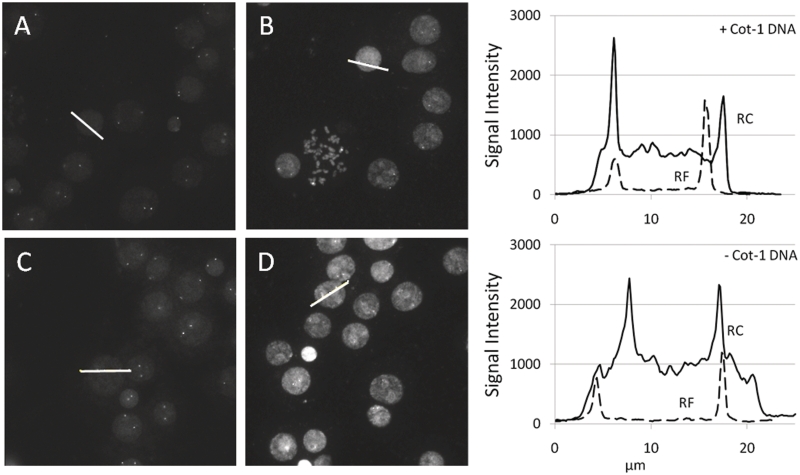
To show the influence of C0t-1 blocking DNA on probes against different DNA regions, we hybridized three probes directed against ERBB2 (17q21.1), AR (Xq12) and PTEN (10q23.31) on paraffin-embedded MCF7 cells as well as normal female metaphase spread slides. Figure 5 shows paraffin-embedded MCF7 cells hybridized with RF and RC probes against AR with and without addition of a 25× excess of C0t-1 DNA. Figure 6 shows metaphase spread slides hybridized with the same mixes. Line profiles show the fluorescence intensity of one of the cells. Lines are drawn through one nucleus and the maximum intensity of one or two FISH signals. These line plots are used to illustrate the difference in nuclear background and signal intensities between the probes. Example pictures of the hybridizations can be found in the Supplementary Data and at http://www.kreatech.com/products/repeat-freetm-poseidontm-fish-probes.html.
Figure 5.
AR FISH on paraffin-embedded MCF-7 cells. Five micrometer thick fixed paraffin-embedded MCF7 cells were hybridized with TAMRA labeled AR probe with and without repeats and hybridized with and without the presence of C0t-1 in the hybmix. (A) RF AR probe hybridized with 25× excess C0t-1 DNA. (B) RC AR probe hybridized with 25× excess C0t-1 DNA. (C) RF AR probe hybridized without blocking DNA. (D) RC AR probe hybridized without blocking DNA. The two histograms show the line intensity profiles of the lines in the pictures. The top histogram shows the profiles of the lines from image A and B to which C0t-1 DNA was added and the bottom histograms show the profiles of the lines in image C and D to which no C0t-1 DNA was added.
Figure 6.
AR FISH on normal female metaphase spread slides. Slides were hybridized with TAMRA labeled AR probe with and without repeats and hybridized with and without the presence of C0t-1 in the hybmix. (A) RF AR probe hybridized with 25× excess C0t-1 DNA. (B) RC AR probe hybridized with 25× excess C0t-1 DNA. (C) RF AR probe hybridized without blocking DNA. (D) RC AR probe hybridized without blocking DNA. The two histograms show the line intensity profiles of the lines in the pictures. The top histogram shows the profiles of the lines from image A and B to which C0t-1 DNA was added and the bottom histograms show the profiles of the lines in image C and D to which no C0t-1 DNA was added.
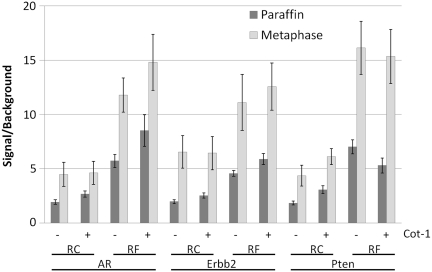
Signal and background intensities were analyzed to show the difference in signal to background ratio between the RC and the RF ERBB2, AR and PTEN probes in Figure 7. Paraffin-embedded MCF7 cells as well as metaphase spread slides were used for the three probes with and without the use of blocking DNA. The signal to background ratio (S/B) was increased when RF probes were used. Blocking with C0t-1 DNA clearly improved most of the RC probes and showed a marginal improvement with the RF probes. On metaphase spread slides, a higher S/B was reached than on paraffin material.
Figure 7.
Comparison of the signal to background ratio of AR, ERBB2 and PTEN probes with and without repeats and blocking DNA on paraffin-embedded MCF7 cells and metaphase spreads. Each point is the average of 5 measurements on the same target material.
DISCUSSION
A method is introduced for the generation and production of RF FISH probes. A library is prepared from a human genomic sequence containing BAC clone by random fragmentation and linker ligation followed by amplification of the library. By allowing C0t-1 DNA to anneal to the repetitive sequences double-stranded DNA is generated that now can be digested by DSN. Due to the random fragmentation of the library, a high degree of the unique sequences will still be represented. The resulting product can now serve as a source for the production of unlimited amount of RF probes.
We showed that almost all repetitive DNA in the probes were removed by measuring the reduction of Alu sequences in ERBB2 probes with qPCR (Figure 2). The background in the FISH that is caused by this part of the DNA is very well visualized in the line profiles next to the images in Figures 5 and 6. The background intensity level inside the cells hybridized with the RC probes is at a much higher level than in the RF images. It could be that due to optimization of the excess of C0t-1 DNA during the hybridization this background could be reduced some more without affecting the signal intensity too much. At the same time, it should be clear that with the RF probes such an optimization procedure is not necessary. Results of hybridization will also be influenced by batch to batch variation that can occur in the production of classical RC probes as well as differences in the quality of the C0t-1 DNA.
The signal to background ratio were analyzed for these hybridizations over time (Figure 4) and show a good ratio for the RF probes even after 1 h of hybridization. The signal intensity still increases up to 4 h, which makes manual microscopic analysis easier. Automatic analysis, however, does not necessarily need the higher intensities as long as the ratio is high enough for differentiating signal from background. By using the RF probes, the hybridization times could be reduced to even 1 h or less for future automatic detection systems. When both RF and RC probes are hybridized for 2 h in the presence of C0t-1 DNA for both probes a reduction in nuclear background is observed. The background in the nucleus for the RF probes could be caused by non-specific sticking of the FISH probe material to the nucleus or by hybridization of remaining repetitive sequences.
Isolations of genomic DNA constructs contain an unpredictable amount of genomic DNA from the host depending on the individual culture and isolation method. The repetitive DNA contributes around 50% of the genomic DNA and will be labeled when not removed. The same happens with the variable amount of bacterial genomic DNA co-isolated in the classical BAC isolation procedures. The removal of the repeats therefore leads to a more efficient probe labeling. By excluding the variability in probe production, the individual probes do not need extensive validation and optimization for every production batch. The method is not restricted to the target area or size of the probes, has been successful in the generation of a large number of FISH probes (Figure 8), (11), has been validated in an independent study for the ERBB2 amplification (12) and has been successfully used for the interrogation of circulating tumor cells (10). Elimination of the necessity to add blocking DNA in a FISH assay simplifies the assay procedure, reduces the assay time, cost and background fluorescence signals, while maintaining the specificity and signal to noise ratio of the FISH probes.
Figure 8.
Examples of metaphase spreads after hybridization without the use of blocking DNA of RF ERBB2 17q11 probe (A), ERG 21q22 probe (B), AR Xq11 probe (C) and PTEN 10q23 probe (D).
SUPPLEMENTARY DATA
Supplementary Data are available at NAR Online: Supplementary Data 1–3.
FUNDING
Funding for open access charge: Veridex LLC.
Conflict of interest statement. Department of Medical Cell Biophysics of the University of Twente receives research funding from Veridex LLC. L.W.M.M.T is an advisor of Veridex LLC. B.F. is an employee of Veridex LLC. United States Patent Application 12/067532 and United States Patent Application 12/181399 covering this work has been licensed exclusively to Kreatech, Amsterdam, The Netherlands.
Supplementary Material
REFERENCES
- 1.Bauman JG, Wiegant J, Borst P, van Duijn P. A new method for fluorescence microscopical localization of specific DNA sequences by in situ hybridization of fluorochromelabelled RNA. Exp. Cell Res. 1980;128:485–490. doi: 10.1016/0014-4827(80)90087-7. [DOI] [PubMed] [Google Scholar]
- 2.Tkachuk DC, Pinkel D, Kuo WL, Weier HU, Gray JW. Clinical applications of fluorescence in situ hybridization. Genet. Anal. Tech. Appl. 1991;8:67–74. doi: 10.1016/1050-3862(91)90051-r. [DOI] [PubMed] [Google Scholar]
- 3.Arnoldus EP, Wiegant J, Noordermeer IA, Wessels JW, Beverstock GC, Grosveld GC, van der Ploeg M, Raap AK. Detection of the Philadelphia chromosome in interphase nuclei. Cytogenet. Cell Genet. 1990;54:108–111. doi: 10.1159/000132972. [DOI] [PubMed] [Google Scholar]
- 4.Landegent JE, Jansen in de Wal N, Dirks RW, Baao F, van der Ploeg M. Use of whole cosmid cloned genomic sequences for chromosomal localization by non-radioactive in situ hybridization. Hum. Genet. 1987;77:366–370. doi: 10.1007/BF00291428. [DOI] [PubMed] [Google Scholar]
- 5.Sealey PG, Whittaker PA, Southern EM. Removal of repeated sequences from hybridisation probes. Nucleic Acids Res. 1985;13:1905–1922. doi: 10.1093/nar/13.6.1905. [DOI] [PMC free article] [PubMed] [Google Scholar]
- 6.Rogan PK, Cazcarro PM, Knoll JH. Sequence-based design of single-copy genomic DNA probes for fluorescence in situ hybridization. Genome Res. 2001;11:1086–1094. doi: 10.1101/gr.171701. [DOI] [PMC free article] [PubMed] [Google Scholar]
- 7.Craig JM, Kraus J, Cremer T. Removal of repetitive sequences from FISH probes using PCR-assisted affinity chromatography. Hum. Genet. 1997;100:472–476. doi: 10.1007/s004390050536. [DOI] [PubMed] [Google Scholar]
- 8.Fuscoe JC, Collins CC, Pinkel D, Gray JW. An efficient method for selecting unique-sequence clones from DNA libraries and its application to fluorescent staining of human chromosome 21 using in situ hybridization. Genomics. 1989;5:100–109. doi: 10.1016/0888-7543(89)90092-x. [DOI] [PubMed] [Google Scholar]
- 9.Milner JJ, Cecchini E, Dominy PJ. A kinetic model for subtractive hybridization. Nucleic Acids Res. 1995;23:176–187. doi: 10.1093/nar/23.1.176. [DOI] [PMC free article] [PubMed] [Google Scholar]
- 10.Attard G, Swennenhuis JF, Olmos D, Reid AH, Vickers E, A'Hern R, Levink R, Coumans F, Moreira J, Riisnaes R, et al. Characterization of ERG, AR and PTEN gene status in circulating tumor cells from patients with castration-resistant prostate cancer. Cancer Res. 2009;69:2912–2918. doi: 10.1158/0008-5472.CAN-08-3667. [DOI] [PubMed] [Google Scholar]
- 11.Cremers AF, Jansen in de Wal N, Wiegant J, Dirks RW, Weisbeek P, van der Ploeg M, Landegent JE. Non-radioactive in situ hybridization. A comparison of several immunocytochemical detection systems using reflection-contrast and electron microscopy. Histochemistry. 1987;86:609–615. doi: 10.1007/BF00489555. [DOI] [PubMed] [Google Scholar]
- 12.Francz M, Egervari K, Kardos L, Toth J, Nemes Z, Szanto J, Szollosi Z. Comparison of Pathvysion and Poseidon HER2 FISH assays in measuring HER2 amplification in breast cancer: a validation study. J. Clin. Pathol. 2010;63:341–346. doi: 10.1136/jcp.2009.066852. [DOI] [PubMed] [Google Scholar]
Associated Data
This section collects any data citations, data availability statements, or supplementary materials included in this article.


