

Abstract
AIM
Drug dosage adjustments in renal impairment are usually based on estimated individual pharmacokinetics. The extent of pharmacokinetic changes in patients with renal impairment must be known for this estimation. If measured data are not available, an estimate based on drug elimination in urine of healthy subjects or patients with normal renal function is commonly made. This is not reliable, however, if renal drug metabolism is involved, as is presumably the case for many peptide and protein drugs. In the present study a new method to predict pharmacokinetic changes for such drugs based on molecular weight was derived.
METHODS
Articles reporting measured pharmacokinetics of peptide and protein drugs in patients with severe renal impairment or end-stage renal disease were identified from the scientific literature, the pharmacokinetic parameter values were extracted and a statistical data synthesis was performed. A sigmoid Emax model was applied and fitted to the data and the prediction error was analyzed.
RESULTS
Overall, 98 peptide and protein drugs were identified. Relevant pharmacokinetic data in patients with renal impairment were found for 21 of these drugs. The average drug clearance was 30% and the average prolongation in half-life was 3.1-fold for low molecular weight peptides or proteins. The median root squared percentage of the prediction error was 18% (drug clearance) and 12% (half-life).
CONCLUSION
An apparently continuous non-linear relationship between molecular weight and pharmacokinetic alterations in patients with severe renal impairment was found. The derived equations could be used as a rough guide for decisions on drug dosage adjustments in such patients.
Keywords: drug dosage calculations, peptides, pharmacokinetics, predictions, proteins
WHAT IS ALREADY KNOWN ABOUT THIS SUBJECT
Renal impairment may affect the pharmacokinetics of peptide and protein drugs.
Molecular size is a predictor. Small molecules are eliminated by the kidneys, whereas large molecules (>67 kDa) are not.
Urinary recovery of peptide and protein drugs in healthy volunteers is not predictive for pharmacokinetic changes in patients with renal impairment.
WHAT THIS STUDY ADDS
An apparently continuous non-linear relationship between molecular weight and pharmacokinetic alterations as observed in patients with severe renal impairment or end-stage renal disease is described.
Potentially relevant pharmacokinetic changes were found for drugs with a molecular weight below 50 kDa.
Analysis of observed pharmacokinetics in patients with severe renal impairment may be a useful approach, especially when urinary recovery in healthy volunteers is not predictive.
Introduction
Impaired renal function leads to impaired elimination of many endogenous and exogenous substances, including drugs. Impaired drug elimination in turn may lead to pronounced drug accumulation and higher drug concentrations, hence predisposing the patient to increased drug effects and toxicity, in particular when standard doses for patients with normal renal function are administered. Drug dosage adjustments may thus be required in order to avoid toxicity and maintain beneficial effects. The most common approach to adjust dosages is based on the estimated individual drug elimination capacity [1] which, in turn, is based on the estimated individual renal function. Adequate drug dosage thus depends on accurate pharmacokinetic parameter estimates.
Pharmacokinetic parameter estimates in patients with renal impairment can be obtained by studying patients with different degrees of renal impairment covering the full range from normal renal function to no renal function. Sufficiently accurate estimates can often be obtained by studying only the extremes, i.e. normal renal function and no renal function (i.e. patients with end-stage renal disease (ESRD), who are functionally anuric), and subsequently applying linear interpolation between these extremes. For many drugs a near linear relationship between estimated glomerular filtration rate and drug clearance or elimination rate constant has been shown [1]. Unfortunately, measured pharmacokinetic data in patients with renal impairment are not available for many drugs. To close this gap, predicted pharmacokinetics should be used.
Pharmacokinetic predictions for renal impairment are often based on urinary recovery of unchanged drug in healthy volunteers or patients with normal renal function [2]. For example, the predicted total drug clearance (pCLtot) in patients without residual renal function can be calculated by subtracting the normal renal clearance (CLren,norm) from normal total body clearance (CLtot,norm).
| 1 |
Importantly, accurate estimates of renal clearance depend on several factors including complete urine collection, drug stability in urine and absence of renal metabolism. Furthermore, such predictions consider only the unchanged drug. The systemically available fraction must be known for predictions based on data after non-intravenous administration.
Although renal metabolism appears to play a minor role for most small molecule drugs, there are some examples where glucuronidation is involved [3]. In contrast, renal metabolism appears to play a major role in the elimination of peptides and proteins. Well known examples include insulin [4], [5] and interferon. Although it was known from animal studies that the kidneys are involved in the elimination of interferon, no interferon was detectable in urine after administration of interferon alpha-2b in healthy volunteers [6]. However, in patients with ESRD and chronic hepatitis C who were treated with interferon, increased toxicity and also increased beneficial effects were observed [7], [8]. Eventually, a reduced drug clearance and a prolonged half-life of interferon was observed in such patients [9], further substantiating the suspected role of the kidneys in eliminating interferon in humans. It should thus be recognized that the part of the elimination capacity by the kidneys which is attributed to renal metabolism is not ‘seen’ in urine. Therefore, the commonly used urine-based estimate of renal clearance should perhaps more accurately be referred to as renal excretion clearance. The extent of renal metabolism can be estimated based on data from patients with normal and severely impaired renal function.
Renal elimination of peptide and protein drugs appears to depend largely on the sequence of glomerular filtration, re-uptake into renal tubule cells and intracellular proteolytic degradation [3]. It is thus expected that renal metabolism will decline in parallel with the glomerular filtration rate in patients with renal impairment, further stressing the need to actually study pharmacokinetics in such patients. However, until the results from such studies are available a method for predicting pharmacokinetics is needed.
To predict the presence or absence of an effect of renal impairment on the pharmacokinetics of large-molecule drugs, a cut-off point is usually applied. It is commonly assumed that drugs with a molecular weight similar to albumin (67 000 Da) or higher are not eliminated by the kidneys, since their size is expected to prohibit glomerular filtration. However, it appears unlikely that a single cut-off point exists. In fact, data from patients with hereditary kidney diseases leading to impaired tubular function (where absence of tubular re-uptake can be assumed) indicate a continuous relationship between the molecular weight and the glomerular sieving coefficient of several endogenous proteins [10].
The aims of the present study were (i) to identify peptide and protein drugs where measured pharmacokinetics are available for patients with severely impaired renal function or ESRD, (ii) to analyze the relationship between molecular weight of these drugs and pharmacokinetic changes in such patients and (iii) to evaluate the potential ability of this relationship to predict pharmacokinetics of peptide and protein drugs in patients with severely impaired renal function or ESRD.
Methods
Identification of drugs with measured pharmacokinetics
First, a comprehensive list of peptide and protein drugs was compiled, including therapeutic proteins approved by the US FDA [11]. Second, articles with pharmacokinetic data in patients with chronic kidney disease and severely impaired renal function (creatinine clearance <30 ml min−1 or estimated glomerular filtration rate <30 ml min−1 1.73 m–2) or ESRD were identified by using the pharmacokinetic database NEPharm [12], PubMed search (e.g. by using the phrase ‘drugname AND (renal[ti] OR haemodialysis) AND pharmacokinetics’) and by screening the reference sections of the identified articles. Third, original publications were obtained and evaluated, where available. For drugs where no relevant articles could be identified, data from the summary of drug characteristics were used.
Statistical data synthesis of pharmacokinetic values
Pharmacokinetic parameter values for drug clearance and elimination half-life were used as presented in the publications, independent from the reported presence or absence of statistically significant differences between patient groups. When drug clearance was not reported, AUC values were used for calculations. When data for patients with severely impaired renal function and patients with ESRD were presented in an article, the data from the ESRD group was used. When two or more comparable studies were found for a drug, mean values were calculated. Data from case reports of single patients were not included.
Pharmacokinetic values for healthy subjects or patients with normal renal function were preferably obtained from the same study in which patients with renal impairment were studied, since the experimental setting and analytical methods would be expected to be similar. If such a control group was not available in the original study, we used one of the following sources of pharmacokinetic parameters: First, data from previous publications from the same authors were included. If not available, we employed comparable studies as identified and reported by the authors of the original publication. If none of these sources was available, we used data from studies using the same route of administration and comparable drug doses, pharmacokinetic setting (e.g. single dose or steady-state), duration of observation, drug assay and concomitant diseases.
Pharmacokinetic comparison between impaired and normal renal function
We hypothesized that the drug fraction eliminated by the renal route must be a function of the molecular weight in the case of peptides and proteins. Pharmacokinetic indices of relative changes in patients with renal impairment were calculated, namely fractional drug clearance (fCL) and half-life factor ( ). In the case of non-intravenous administration the apparent clearance was applied.
| 2 |
| 3 |
These values were related to molecular weight (MW in Da) and a sigmoid Emax function (Equation 4) was applied and fitted to the data by using the Microsoft Excel Solver (Microsoft® Office Excel 2003, SP3, Microsoft Corporation), thereby minimizing the sum of squared residuals. Parameters included the hypothetical factor at a molecular weight of zero (f0), the molecular weight leading to half-maximal changes (M50), and a sigmoidicity constant (γ).
| 4 |
A linear function and a non-sigmoid Emax function (i.e. Equation 4 with γ= 1) were considered, but eventually rejected based on the sum of squared residuals, the Akaike information criterion and calculated prediction errors.
Prediction of pharmacokinetic changes
As an internal validation, model-predicted and observed pharmacokinetic indices were compared and the percentage of the prediction error, a measure of bias, calculated as the difference between predicted and observed values divided by the observed value, and the root squared percentage of the prediction error, a measure of precision, was calculated, as is commonly applied in pharmacokinetics [13], [14].
Results
Overall, 98 peptide and protein drugs were identified. Relevant pharmacokinetic data for patients with chronic kidney disease and severe renal impairment or ESRD were identified for 21 of these drugs, ranging in molecular weight from 1019 to 150 000 Da (Table 1) [9], [15]–[46]. Adequate parameters for comparison were found in 20 of these drugs. For rituximab no comparable parameters could be identified for patients with normal renal function due to its time dependent pharmacokinetics (a single dose study in previously untreated patients with an observation time of 2 to 3 months would have been required).
Table 1.
Pharmacokinetic parameter values of peptide and protein drugs. Values for half-life (t½) and body weight (WT) were rounded to two and drug clearance (CL) to three significant digits
| Drug/Patient group | n | eGFR (ml min−1) | WT (kg) | Dose | ROA | Dosage | Sampling period | Assay | PK model | CL | t1/2 | Reference |
|---|---|---|---|---|---|---|---|---|---|---|---|---|
| Agalsidase alfa | ||||||||||||
| RTX, Fabry's disease | 11 | 65 | 0.2 mg kg−1 | i.v. | Single | 8 h | α-Gal A | NCA | 3.4 ml min−1 kg−1 | 89 min | [15] | |
| ESRD, Fabry's disease | 6 | activity | 3.21 ml min−1 kg−1 | 77 min | ||||||||
| Anakinra | ||||||||||||
| Healthy | 12 | 95 | 82 | 1 mg kg−1 | i.v. | Single | 24 h | ACELISA | NCA | 137 ml min−1 | 2.6 h | [16] |
| ESRD | 20 | 72 | 96 h | 18.7 ml min−1 | 7.1 h | |||||||
| Darbepoetin alfa | ||||||||||||
| Healthy | 4 | 94 | 69 | 0.75 µg kg−1 | i.v. | Single | 17 days | ELISA | Two compartment | 0.164 l h−1 | [17] | |
| CKD | 20 | 24–48 | 1 µg kg−1 | s.c. | Single | 4 weeks | ELISA | NCA | 70 h | [18] | ||
| ESRD | 131 | 55 | 10–90 µg | i.v. | Single and multiple | 168–336 h | ELISA | Two compartment | 0.106 l h−1 | [19] | ||
| ESRD | 10 | i.v. | Single | 96 h | ELISA | 1.6 ml h−1 kg−1 | 25 h | [20] | ||||
| ESRD | 6 | s.c. | Single | 168 h | 49 h | |||||||
| ESRD | 17 | 76 | i.v. | Single | 168 h | ELISA | NCA | 2 ml h−1 kg−1 | 18 h | [21] | ||
| ESRD | 11 | i.v. | Steady-state | 168 h | NCA | 1.65 ml h−1 kg−1 | 24 h | |||||
| ESRD | 58 | 20–180 µg | s.c. | Single | 336–672 h | ELISA | One compartment. | 0.158 l h−1 | 60 h | [22] | ||
| Denosumab | ||||||||||||
| ‘Full PK study’ | 1 mg kg−1 | s.c. | No influence | 26 days | [23] | |||||||
| Desmopressin | ||||||||||||
| Normal (Literature) | 1.7 ml min−1 kg−1 | 3.5 h | [24] | |||||||||
| CKD | 10 | 16 | 0.3 µg kg−1 | i.v. | 26 h | RIA | Two/three compartment. | 0.35 ml min−1 kg−1 | 9.7 h | |||
| Normal | 103 | 2 µg | i.v. | Single | 24 h | RIA | Three compartment. | 10 l h−1 | 3.7 h | [25] | ||
| CKD | 16 | 2.9 l h−1 | 10 h | |||||||||
| Digoxin-specific Fab | ||||||||||||
| Normal, Intoxication | 10 | >60 | 64 | 160–480 mg | i.v. | Single | Calculated | NCA | 20.1 ml min−1 | 25 h | [26] | |
| Normal (Literature) | 23 h | [27] | ||||||||||
| Normal, Intoxication | 3 | >79 | Various | i.v. | Single | RIA | NCA | 31.2 ml min−1 | 16 h | |||
| Impaired, Intoxication | 7 | <30 | 10.9 ml min−1 | 25 h | ||||||||
| ESRD, Intoxication | 5 | 66 | 80–160 mg | i.v. | Single | 204–327 h | RIA | Two compartment. | 0.057 ml min−1 kg−1 | 96 h | [28] | |
| Drotrecogin alfa (activated) | ||||||||||||
| Severe sepsis | 680 | 24 µg kg−1 h−1 | i.v. | Continuous infusion | ICAA | NCA | 40.1 l h−1 | [29] | ||||
| Severe sepsis | <20 | Lower by 23.7% | ||||||||||
| Epoetin beta | ||||||||||||
| Normal | 2 | 101 | 130–152 U kg−1 | i.v. | Single | 48 h | RIA | NCA | 0.12 ml min−1 kg−1 | 8.5 h | [30] | |
| ESRD | 2 | 0 | 0.08 ml min−1 kg−1 | 10 h | ||||||||
| Healthy | 12 | 100 U kg−1 | i.v. | Single | 48 h | RIA | Various | 7.88 ml min−1 1.73 m–2 | 4.9 h | [31] | ||
| ESRD | 21 | 5 ml min−1 1.73 m–2 | 8.3 h | |||||||||
| Etanercept | ||||||||||||
| Healthy | 32 | 10–50 mg | s.c. | Single | 480 h | ELISA | Various | 0.132 l h−1 | 75 h | [32] | ||
| Healthy (Literature) | 25 mg | s.c. | Single | 0.132 l h−1 | 68 h | [33] | ||||||
| ESRD | 6 | 25 mg | s.c. | Steady-state | 16–20 weeks | ELISA | Various | 0.102 l h−1 | 75 h | |||
| Exenatide | ||||||||||||
| Healthy | 8 | 111 | 73 | 10 µg | s.c. | Single | 12 h | IEMA | NCA | 3.4 l h−1 | 1.5 h | [34] |
| ESRD | 8 | 64 | 5 µg | s.c. | Single | 48 h | 0.9 l h−1 | 6 h | ||||
| Healthy and DM2 | 71 | 140 | 97 | s.c. | Single | 8.14 l h−1 | ||||||
| ESRD | 8 | s.c. | Single | 1.3 l h−1 | ||||||||
| rhG-CSF | ||||||||||||
| ESRD | 10 | 50 µg m−2 | i.v. | Single | 24 h | RIA | AUC × 3 | t1/2× 2 | [35] | |||
| Goserelin | ||||||||||||
| Normal | 250 µg | s.c. | Single | RIA | 133 ml min−1 | 4.2 h | [36] | |||||
| CKD | 10–20 | Single | 32 ml min−1 | 12 h | ||||||||
| Growth hormone | ||||||||||||
| Normal | 6 | 200 µg | i.v. | Single | 150 min | IRMA | Two compartment | 265 ml min−1 m−2 | 14 min | [37] | ||
| ESRD | 6 | 79.9 ml min−1 m−2 | 26 min | |||||||||
| Healthy | 24 | 127 | 50–310 µg m−2 h–1 | i.v. | Continuous infusion | 120 min | IRMA | One compartment | 115–208 ml min−1 m−2 | 3.5–8.7 h | [38] | |
| ESRD | 6 | 6–11 | 71–175 ml min−1 m−2 | 9.6–16 h | ||||||||
| Interferon alfa-2b | ||||||||||||
| Normal, HCV | 10 | 3 × 10⁶ IU | s.c. | Single | 36 h | ELISA | NCA | 5.3 h | [9] | |||
| ESRD, HCV | 10 | 9.6 h | ||||||||||
| Interleukin-2 | ||||||||||||
| Normal, malignant tumour (Literature) | 700 000 JRU | i.v. | Single | 24 h | ELISA | Two compartment | 116 ml min−1 | 1.5 h | [39] | |||
| ESRD, renal cell carcinoma | 4 | 350 000–700 000 JRU | i.v. | Single | 50.5 ml min−1 | 1.7 h | ||||||
| Octreotide | ||||||||||||
| Healthy | 9.6 l h−1 | [40] | ||||||||||
| CKD | 4.5 l h−1 | |||||||||||
| Pegfilgrastim | ||||||||||||
| Normal | 7 | 99 | 83 | 6 mg | s.c. | Single | 48 h | ELISA | NCA | 51 h | [41] | |
| ESRD | 6 | 81 | 65 h | |||||||||
| Peg-interferon alpha-2a | ||||||||||||
| Normal | 6 | >100 | 90 µg | s.c. | Single | 336 h | ELISA | 118 ml h−1 | 76 h | [42] | ||
| CKD | 6 | 20–40 | 504 h | 80 ml h−1 | 117 h | |||||||
| Peg-interferon alpha-2b | ||||||||||||
| Normal | 6 | 105 | 81 | 1 µg kg−1 | s.c. | Single | 168 h | ECLA | NCA | 26.4 ml min−1 | 40 h | [43] |
| ESRD | 6 | 90 | 12.9 ml min−1 | 52 h | ||||||||
| Normal | 6 | 129.7 | 84 | 1 µg kg−1 | s.c. | Multiple | 168 h | ECLA | NCA | 25.3 ml min−1 | 52 h | [44] |
| CKD | 7 | 18.9 | 96 | 14.1 ml min−1 | 65 h | |||||||
| Rituximab | ||||||||||||
| ESRD | 9 | 50–375 mg m−2 | i.v. | Single | 84 days | ELISA | NCA | 12 days | [45] | |||
| Triptorelin | ||||||||||||
| Healthy | 6 | 165.8 | 79 | 0.5 mg | i.v. | RIA | Various | 2.67 ml min−1 kg−1 | 2.8 h | [46] | ||
| CKD | 6 | 8.1 | 70 | 1.25 ml min−1 kg−1 | 7.7 h |
ACELISA antibody-capture enzyme-linked immunoassay, AUC area under the curve, CKD chronic kidney disease, DM2 diabetes mellitus type 2, ECLA electrochemiluminescence assay, eGFR estimated glomerular filtration rate or creatinine clearance (as reported in the respective study), ELISA enzyme-linked immunosorbent assay, ESRD end-stage renal disease, HCV hepatitis C virus, ICAA immunocapture-amidolytic assay, IEMA immunoenzymetric assay, IRMA Immunoradiometric assay, JRU Japan reference unit, n number of subjects, NCA non-compartmental analysis, PK pharmacokinetic, RIA radioimmunoassay, ROA route of administration, RTX renal transplant.
Analysis of the relationship between molecular weight and fractional clearance or half-life factors revealed an apparently continuous and non-linear relationship as described by equation 4 (Table 2, Figure 1). For fractional clearance the estimated parameters were f0= 0.30, M50= 35 618 Da and γ= 2.42. When comparing model-predicted and observed values, the median percentage of the prediction error was 0.3%, indicating a successful fit, and the median root squared percentage of the prediction error was 18.3% (interquartile range 10.4 to 36.6%). For the half-life factor the estimated parameters were f0= 3.06, M50= 17 795 Da and γ= 1.89. The median percentage of the prediction error was 6.6%, indicating slight overprediction, and the median root squared percentage of the prediction error was 11.6% (interquartile range 7.2–26.6%). Predictions for the fractional clearance ranged from 61% (pegfilgrastim) to 294% (anakinra) and predictions of the half-life factor ranged from 46% (digoxin-specific Fab) to 183% (interleukin-2) of the observed value.
Table 2.
Pharmacokinetic changes in severe renal impairment or end-stage renal disease
| Drug | Molecular weight (Da) | Fractional clearance | Half-life factor |
|---|---|---|---|
| Agalsidase alfa | 50 000 | 0.94 | 0.87 |
| Anakinra | 17 257 | 0.14 | 2.69 |
| Darbepoetin alfa | 38 000 | 0.72 | 0.86 |
| Denosumab | 147 000 | 1.00 | |
| Desmopressin | 1 069 | 0.25 | 2.76 |
| Digoxin-specific Fab | 46 200 | 0.29 | 2.82 |
| Drotrecogin alfa (activated) | 55 000 | 0.76 | |
| Epoetin beta | 30 400 | 0.65 | 1.45 |
| Etanercept | 150 000 | 0.77 | 1.04 |
| Exenatide | 4 186 | 0.16 | 4.00 |
| rhG-CSF | 18 800 | 0.33* | 2.00 |
| Goserelin | 1 269 | 0.24 | 2.86 |
| Growth hormone | 22 124 | 0.51 | 2.06 |
| Interferon alfa-2b | 19 500 | 0.48 | 1.81 |
| Interleukin-2 | 15 600 | 0.43 | 1.18 |
| Octreotide | 1 019 | 0.47 | |
| Pegfilgrastim | 38 800 | 1.11* | 1.26 |
| Peg-interferon alpha-2a | 40 000 | 0.68 | 1.54 |
| Peg-interferon alpha-2b | 31 000 | 0.52* | 1.28 |
| Triptorelin | 1 311 | 0.47 | 2.72 |
Calculated based on reported AUCs.
Figure 1.
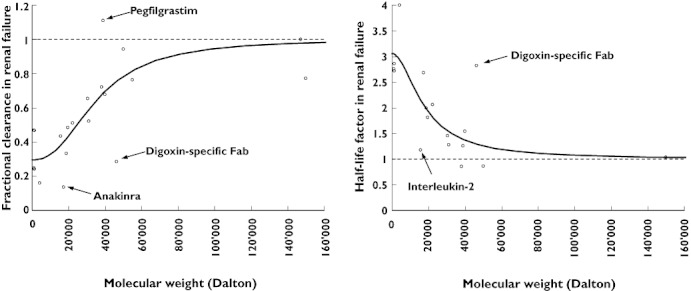
Pharmacokinetic changes in severe renal impairment or end-stage renal disease. For example, a fractional clearance (fCL) of 0.4 indicates that the observed total body clearance of a drug was 40% of the observed clearance in healthy subjects or patients with normal renal function. Similarly, a half-life factor ( ) of 3 indicates a three-fold prolongation of half-life in renal failure. The continuous lines represent the fitted sigmoid Emax model (equation 4). The broken lines represent the hypothetical condition of no change
Discussion
In recent years, peptide- and protein-based drugs have become an increasingly important class of drugs, often for severely ill patients. Even though peptide and protein drugs have been described as subject to renal metabolism and elimination, data on measured pharmacokinetics in patients with chronic kidney disease and severe renal impairment or ESRD are not available for many drugs. Therefore, a method for predicting pharmacokinetic changes of peptide and protein drugs in patients with renal impairment might be useful for adjusting drug dosages until measured pharmacokinetics in such patients become available. In the present study we analyzed the relationship between molecular weight of a drug and changes in drug clearance and half-life in patients with severe renal failure or ESRD based on published pharmacokinetics. Our results indicate that there could, in fact, be a continuous relationship rather than a sharp cut-off point (Figure 1).
Whether pharmacokinetic changes are clinically relevant depends on the pharmacodynamics of a drug (e.g. the therapeutic index). In general, reduction in drug clearance of less than 20% or prolongation in half-life of less than 1.25 fold are rarely clinically relevant. Thus, based on our analysis potentially relevant changes should be expected for drugs with a molecular weight below 50 000 Da. Half-maximal changes due to renal failure were predicted for drugs with a molecular weight of 35–36 000 Da (considering drug clearance) or 17–18 000 Da (considering half-life). This discrepancy could be explained by concomitant changes in the volume of distribution, since a reduction in the volume of distribution is expected to lead to a shorter half-life as reported for peg-interferon [43]. However, this discrepancy could also be explained by methodological differences between the pharmacokinetic studies. Clearance and half-life values in particular are difficult to estimate accurately for drugs with a very long half-life. Nevertheless, our estimate for low molecular weight peptides and proteins of an average reduction in total drug clearance to one third (f0,CL= 0.3) is consistent with the estimated three-fold prolongation of half-life ( ). Conversely, the average fraction eliminated renally (fren) is estimated as 0.7 based on clearance and as 0.67 based on half-life, decreasing to zero with an increasing molecular weight, providing further evidence for the proposed general relationship (equation 5), where fren is the true renally eliminated fraction, normal renal function is indicated by ‘norm’ and no renal function is indicated by ‘anuric’.
| 5 |
We propose that the derived continuous non-linear relationships (equation 4 for fractional clearance and half-life factor) could be used as a rough estimate to guide drug dosage in patients with impaired renal function. For single doses, dose adjustments might not be required unless there is a change in volume of distribution or drug effects are closely correlated with the area under the curve. For repeatedly administered drugs, drug clearance is commonly used to calculate maintenance doses. For drugs with long administration intervals the half-life could be a more appropriate marker.
There are several limitations concerning the present analysis. First, our analysis was based on a relatively low number of studies and many studies included a relatively low number of patients. However, the results from these studies are valuable and should be used since they provide the best evidence currently available. Second, in some cases data from several studies were combined. Differences in study design may limit comparability, especially for drugs with dose- or time-dependent pharmacokinetics. Such characteristics are commonly observed for peptide and protein drugs and are presumably due to target-mediated drug disposition, as suspected in the case of rituximab, where the half-life increases after repeated administration [47]. A comparison of drug clearance values between studies is especially sensitive to differences between drug assays. A comparison of half-life values between studies is especially sensitive to study design, although clearance might also be affected. An important factor is observation time, especially in the case of a multi-exponential concentration decline. Furthermore, differences between mathematical methods may have an impact. For example, analyses based on a one compartment model typically lead to higher estimates of drug clearance and lower estimates of half-life as compared with those derived using a two compartment model. However, when data from several studies were compared, these factors were considered and we preferred control data from studies conducted by the same research group. Third, we analyzed only the extremes of renal function. It is thus unclear whether linear interpolation between values for normal renal function and no renal function is possible for peptide and protein drugs. This relationship has rarely been analyzed so far. Data for peg-interferon alpha-2b indicate that interpolation may be possible [43]. Fourth, the percentage of the prediction error for our model was calculated using the same data which were used to derive the mathematical model. The true error will thus most probably be larger, which could be evaluated only prospectively once new data become available. Fifth, we considered only molecular weight due to the observed relationship between molecular weight and glomerular sieving of endogenous proteins [10] and the easy availability of these values. However, other factors such as the three-dimensional configuration of the drug and electric charge could also play a role. Hence, the hydrodynamic size might be a better parameter [48] but values for specific drugs are rarely communicated in the scientific literature.
In conclusion, we found an apparently continuous non-linear relationship between molecular weight of a drug and pharmacokinetic alterations as observed in patients with severe renal impairment or ESRD. The derived equations could be used as a rough guide for predictions on drug dosage adjustments in such patients.
Competing Interests
There are no competing interests to declare.
REFERENCES
- 1.Dettli L. Drug dosage in renal disease. Clin Pharmacokinet. 1976;1:126–34. doi: 10.2165/00003088-197601020-00004. [DOI] [PubMed] [Google Scholar]
- 2.Welling PG, Craig WA, Kunin CM. Prediction of drug dosage in patients with renal failure using data derived from normal subjects. Clin Pharmacol Ther. 1975;18:45–52. doi: 10.1002/cpt197518145. [DOI] [PubMed] [Google Scholar]
- 3.Pichette V, Leblond FA. Drug metabolism in chronic renal failure. Curr Drug Metab. 2003;4:91–103. doi: 10.2174/1389200033489532. [DOI] [PubMed] [Google Scholar]
- 4.Silvers A, Swenson RS, Farquhar JW, Reaven GM. Derivation of a three compartment model describing disappearance of plasma insulin-131-I in man. J Clin Invest. 1969;48:1461–9. doi: 10.1172/JCI106112. [DOI] [PMC free article] [PubMed] [Google Scholar]
- 5.Rubenstein AH, Mako ME, Horwitz DL. Insulin and the kidney. Nephron. 1975;15:306–26. doi: 10.1159/000180518. [DOI] [PubMed] [Google Scholar]
- 6.Radwanski E, Perentesis G, Jacobs S, Oden E, Affrime M, Symchowicz S, Zampaglione N. Pharmacokinetics of interferon alpha-2b in healthy volunteers. J Clin Pharmacol. 1987;27:432–5. doi: 10.1002/j.1552-4604.1987.tb03044.x. [DOI] [PubMed] [Google Scholar]
- 7.Koenig P, Vogel W, Umlauft F, Weyrer K, Prommegger R, Lhotta K, Neyer U, Stummvoll HK, Gruenewald K. Interferon treatment for chronic hepatitis C virus infection in uremic patients. Kidney Int. 1994;45:1507–9. doi: 10.1038/ki.1994.197. [DOI] [PubMed] [Google Scholar]
- 8.Izopet J, Rostaing L, Moussion F, Alric L, Dubois M, That HT, Payen JL, Duffaut M, Durand D, Suc JM, Puel J. High rate of hepatitis C virus clearance in hemodialysis patients after interferon-alpha therapy. J Infect Dis. 1997;176:1614–7. doi: 10.1086/517339. [DOI] [PubMed] [Google Scholar]
- 9.Rostaing L, Chatelut E, Payen JL, Izopet J, Thalamas C, Ton-That H, Pascal JP, Durand D, Canal P. Pharmacokinetics of alphaIFN-2b in chronic hepatitis C virus patients undergoing chronic hemodialysis or with normal renal function: clinical implications. J Am Soc Nephrol. 1998;9:2344–8. doi: 10.1681/ASN.V9122344. [DOI] [PubMed] [Google Scholar]
- 10.Norden AG, Lapsley M, Lee PJ, Pusey CD, Scheinman SJ, Tam FW, Thakker RV, Unwin RJ, Wrong O. Glomerular protein sieving and implications for renal failure in Fanconi syndrome. Kidney Int. 2001;60:1885–92. doi: 10.1046/j.1523-1755.2001.00016.x. [DOI] [PubMed] [Google Scholar]
- 11.Lee JI, Zhang L, Men AY, Kenna LA, Huang SM. CYP-mediated therapeutic protein-drug interactions: clinical findings, proposed mechanisms and regulatory implications. Clin Pharmacokinet. 2010;49:295–310. doi: 10.2165/11319980-000000000-00000. [DOI] [PubMed] [Google Scholar]
- 12.Keller F, Frankewitsch T, Zellner D, Simon S, Czock D, Giehl M. Standardized structure and modular design of a pharmacokinetic database. Comput Methods Programs Biomed. 1998;55:107–15. doi: 10.1016/s0169-2607(97)00061-8. [DOI] [PubMed] [Google Scholar]
- 13.Op den Buijsch RA, van de Plas A, Stolk LM, Christiaans MH, van Hooff JP, Undre NA, van Dieijen-Visser MP, Bekers O. Evaluation of limited sampling strategies for tacrolimus. Eur J Clin Pharmacol. 2007;63:1039–44. doi: 10.1007/s00228-007-0354-9. [DOI] [PMC free article] [PubMed] [Google Scholar]
- 14.Armendáriz Y, Pou L, Cantarell C, Lopez R, Perelló M, Capdevila L. Evaluation of a limited sampling strategy to estimate area under the curve of tacrolimus in adult renal transplant patients. Ther Drug Monit. 2005;27:431–4. doi: 10.1097/01.ftd.0000158080.61201.65. [DOI] [PubMed] [Google Scholar]
- 15.Pastores GM, Boyd E, Crandall K, Whelan A, Piersall L, Barnett N. Safety and pharmacokinetics of agalsidase alfa in patients with Fabry disease and end-stage renal disease. Nephrol Dial Transplant. 2007;22:1920–5. doi: 10.1093/ndt/gfm096. [DOI] [PubMed] [Google Scholar]
- 16.Yang BB, Baughman S, Sullivan JT. Pharmacokinetics of anakinra in subjects with different levels of renal function. Clin Pharmacol Ther. 2003;74:85–94. doi: 10.1016/S0009-9236(03)00094-8. [DOI] [PubMed] [Google Scholar]
- 17.Agoram B, Sutjandra L, Sullivan JT. Population pharmacokinetics of darbepoetin alfa in healthy subjects. Br J Clin Pharmacol. 2007;63:41–52. doi: 10.1111/j.1365-2125.2006.02752.x. [DOI] [PMC free article] [PubMed] [Google Scholar]
- 18.Padhi D, Ni L, Cooke B, Marino R, Jang G. An extended terminal half-life for darbepoetin alfa: results from a single-dose pharmacokinetic study in patients with chronic kidney disease not receiving dialysis. Clin Pharmacokinet. 2006;45:503–10. doi: 10.2165/00003088-200645050-00005. [DOI] [PubMed] [Google Scholar]
- 19.Kawakami K, Takama H, Nakashima D, Tanaka H, Uchida E, Akizawa T. Population pharmacokinetics of darbepoetin alpha in peritoneal dialysis and non-dialysis patients with chronic kidney disease after single subcutaneous administration. Eur J Clin Pharmacol. 2009;65:169–78. doi: 10.1007/s00228-008-0561-z. [DOI] [PubMed] [Google Scholar]
- 20.Macdougall IC, Gray SJ, Elston O, Breen C, Jenkins B, Browne J, Egrie J. Pharmacokinetics of novel erythropoiesis stimulating protein compared with epoetin alfa in dialysis patients. J Am Soc Nephrol. 1999;10:2392–5. doi: 10.1681/ASN.V10112392. [DOI] [PubMed] [Google Scholar]
- 21.Allon M, Kleinman K, Walczyk M, Kaupke C, Messer-Mann L, Olson K, Heatherington AC, Maroni BJ. Pharmacokinetics and pharmacodynamics of darbepoetin alfa and epoetin in patients undergoing dialysis. Clin Pharmacol Ther. 2002;72:546–55. doi: 10.1067/mcp.2002.128374. [DOI] [PubMed] [Google Scholar]
- 22.Takama H, Tanaka H, Nakashima D, Ogata H, Uchida E, Akizawa T, Koshikawa S. Population pharmacokinetics of darbepoetin alfa in haemodialysis and peritoneal dialysis patients after intravenous administration. Br J Clin Pharmacol. 2007;63:300–9. doi: 10.1111/j.1365-2125.2006.02756.x. [DOI] [PMC free article] [PubMed] [Google Scholar]
- 23. CHMP Assessment Report for Prolia (Study 20040245). Available at http://www.ema.europa.eu/docs/en_GB/document_library/EPAR_-_Public_assessment_report/human/001120/WC500093529.pdf (last accessed May 10 2011)
- 24.Ruzicka H, Björkman S, Lethagen S, Sterner G. Pharmacokinetics and antidiuretic effect of high-dose desmopressin in patients with chronic renal failure. Pharmacol Toxicol. 2003;92:137–42. doi: 10.1034/j.1600-0773.2003.920306.x. [DOI] [PubMed] [Google Scholar]
- 25.Agersø H, Seiding Larsen L, Riis A, Lövgren U, Karlsson MO, Senderovitz T. Pharmacokinetics and renal excretion of desmopressin after intravenous administration to healthy subjects and renally impaired patients. Br J Clin Pharmacol. 2004;58:352–8. doi: 10.1111/j.1365-2125.2004.02175.x. [DOI] [PMC free article] [PubMed] [Google Scholar]
- 26.Schaumann W, Kaufmann B, Neubert P, Smolarz A. Kinetics of the Fab fragments of digoxin antibodies and of bound digoxin in patients with severe digoxin intoxication. Eur J Clin Pharmacol. 1986;30:527–33. doi: 10.1007/BF00542410. [DOI] [PubMed] [Google Scholar]
- 27.Renard C, Grene-Lerouge N, Beau N, Baud F, Scherrmann JM. Pharmacokinetics of digoxin-specific Fab: effects of decreased renal function and age. Br J Clin Pharmacol. 1997;44:135–8. doi: 10.1046/j.1365-2125.1997.00654.x. [DOI] [PMC free article] [PubMed] [Google Scholar]
- 28.Ujhelyi MR, Robert S, Cummings DM, Colucci RD, Sailstad JM, Vlasses PH, Findlay JW, Zarowitz BJ. Disposition of digoxin immune Fab in patients with kidney failure. Clin Pharmacol Ther. 1993;54:388–94. doi: 10.1038/clpt.1993.165. [DOI] [PubMed] [Google Scholar]
- 29.Macias WL, Dhainaut JF, Yan SC, Helterbrand JD, Seger M, Johnson G, III, Small DS. Pharmacokinetic-pharmacodynamic analysis of drotrecogin alfa (activated) in patients with severe sepsis. Clin Pharmacol Ther. 2002;72:391–402. doi: 10.1067/mcp.2002.128148. [DOI] [PubMed] [Google Scholar]
- 30.Kindler J, Eckardt KU, Ehmer B, Jandeleit K, Kurtz A, Schreiber A, Scigalla P, Sieberth HG. Single-dose pharmacokinetics of recombinant human erythropoietin in patients with various degrees of renal failure. Nephrol Dial Transplant. 1989;4:345–9. doi: 10.1093/oxfordjournals.ndt.a091888. [DOI] [PubMed] [Google Scholar]
- 31.Jensen JD, Madsen JK, Jensen LW, Pedersen EB. Reduced production, absorption, and elimination of erythropoietin in uremia compared with healthy volunteers. J Am Soc Nephrol. 1994;5:177–85. doi: 10.1681/ASN.V52177. [DOI] [PubMed] [Google Scholar]
- 32.Kawai S, Sekino H, Yamashita N, Tsuchiwata S, Liu H, Korth-Bradley JM. The comparability of etanercept pharmacokinetics in healthy Japanese and American subjects. J Clin Pharmacol. 2006;46:418–23. doi: 10.1177/0091270006286435. [DOI] [PubMed] [Google Scholar]
- 33.Don BR, Spin G, Nestorov I, Hutmacher M, Rose A, Kaysen GA. The pharmacokinetics of etanercept in patients with end-stage renal disease on haemodialysis. J Pharm Pharmacol. 2005;57:1407–13. doi: 10.1211/jpp.57.11.0005. [DOI] [PubMed] [Google Scholar]
- 34.Linnebjerg H, Kothare PA, Park S, Mace K, Reddy S, Mitchell M, Lins R. Effect of renal impairment on the pharmacokinetics of exenatide. Br J Clin Pharmacol. 2007;64:317–27. doi: 10.1111/j.1365-2125.2007.02890.x. [DOI] [PMC free article] [PubMed] [Google Scholar]
- 35.Akizawa T, Shishido K, Koshikawa S. The effects and pharmacokinetics of rhG-CSF in patients with chronic renal failure. Artif Organs. 1995;19:1251–7. doi: 10.1111/j.1525-1594.1995.tb02295.x. [DOI] [PubMed] [Google Scholar]
- 36.Adam HK, Barker Y, Hutchinson FG, Milsted RAV, Moore RH, Swaisland AJ. Zoladex: a one month duration LH-RH agonist. Pharm Weekbl Sci. 1988;10:57. (Abstract) [Google Scholar]
- 37.García-Mayor RV, Pérez AJ, Gandara A, Andrade A, Mallo F, Casanueva FF. Metabolic clearance rate of biosynthetic growth hormone after endogenous growth hormone suppression with a somatostatin analogue in chronic renal failure patients and control subjects. Clin Endocrinol (Oxf) 1993;39:337–43. doi: 10.1111/j.1365-2265.1993.tb02374.x. [DOI] [PubMed] [Google Scholar]
- 38.Schaefer F, Baumann G, Haffner D, Faunt LM, Johnson ML, Mercado M, Ritz E, Mehls O, Veldhuis JD. Multifactorial control of the elimination kinetics of unbound (free) growth hormone (GH) in the human: regulation by age, adiposity, renal function, and steady state concentrations of GH in plasma. J Clin Endocrinol Metab. 1996;81:22–31. doi: 10.1210/jcem.81.1.8550755. [DOI] [PubMed] [Google Scholar]
- 39.Kamikawa S, Sugimoto T, Asai T, Ishii K, Kim T. Pharmacokinetic study of interleukin-2 following intravenous injection in hemodialysis patients with renal cell carcinoma. Ther Apher Dial. 2008;12:67–71. doi: 10.1111/j.1744-9987.2007.00543.x. [DOI] [PubMed] [Google Scholar]
- 40.Gillis JC, Noble S, Goa KL. Octreotide long-acting release (LAR). A review of its pharmacological properties and therapeutic use in the management of acromegaly. Drugs. 1997;53:681–99. doi: 10.2165/00003495-199753040-00009. [DOI] [PubMed] [Google Scholar]
- 41.Yang BB, Kido A, Salfi M, Swan S, Sullivan JT. Pharmacokinetics and pharmacodynamics of pegfilgrastim in subjects with various degrees of renal function. J Clin Pharmacol. 2008;48:1025–31. doi: 10.1177/0091270008320318. [DOI] [PubMed] [Google Scholar]
- 42.Martin P, Mitra S, Farrington K, Martin NE, Modi MW. Pegylated (40 kDa) interferon alpha-2a (PEGASYS) is unaffected by renal impairment. Hepatology. 2000;32(Pt. 2 of 2):370A. (Abstract 842) [Google Scholar]
- 43.Gupta SK, Pittenger AL, Swan SK, Marbury TC, Tobillo E, Batra V, Sack M, Glue P, Jacobs S, Affrime M. Single-dose pharmacokinetics and safety of pegylated interferon-alpha2b in patients with chronic renal dysfunction. J Clin Pharmacol. 2002;42:1109–15. doi: 10.1177/009127002401382713. [DOI] [PubMed] [Google Scholar]
- 44.Gupta SK, Swan SK, Marbury T, Smith W, Schwartz S, Kolz K, Cutler DL. Multiple dose pharmacokinetics of peginterferon alfa-2b in patients with renal insufficiency. Br J Clin Pharmacol. 2007;64:726–32. doi: 10.1111/j.1365-2125.2007.02950.x. [DOI] [PMC free article] [PubMed] [Google Scholar]
- 45.Vieira CA, Agarwal A, Book BK, Sidner RA, Bearden CM, Gebel HM, Roggero AL, Fineberg NS, Taber T, Kraus MA, Pescovitz MD. Rituximab for reduction of anti-HLA antibodies in patients awaiting renal transplantation: 1. Safety, pharmacodynamics, and pharmacokinetics. Transplantation. 2004;77:542–8. doi: 10.1097/01.tp.0000112934.12622.2b. [DOI] [PubMed] [Google Scholar]
- 46.Müller FO, Terblanchè J, Schall R, Smit R, Tucker T, Marais K, Groenewoud G, Porchet HC, Weiner M, Hawarden D. Pharmacokinetics of triptorelin after intravenous bolus administration in healthy males and in males with renal or hepatic insufficiency. Br J Clin Pharmacol. 1997;44:335–41. doi: 10.1046/j.1365-2125.1997.t01-1-00592.x. [DOI] [PMC free article] [PubMed] [Google Scholar]
- 47.Maloney DG, Grillo-López AJ, Bodkin DJ, White CA, Liles TM, Royston I, Varns C, Rosenberg J, Levy R. IDEC-C2B8: results of a phase I multiple-dose trial in patients with relapsed non-Hodgkin's lymphoma. J Clin Oncol. 1997;15:3266–74. doi: 10.1200/JCO.1997.15.10.3266. [DOI] [PubMed] [Google Scholar]
- 48.Lin JH. Pharmacokinetics of biotech drugs: peptides, proteins and monoclonal antibodies. Curr Drug Metab. 2009;10:661–91. doi: 10.2174/138920009789895499. [DOI] [PubMed] [Google Scholar]