

Abstract
The association between immune dysfunction and the development of autoimmune pathology in patients with human immunodeficiency virus/acquired immune deficiency syndrome (HIV/AIDS) is not clear. The frequency and phenotype of regulatory T cells, as well as the presence of autoantibodies, were evaluated in a paediatric cohort of HIV-infected patients without clinical evidence of autoimmune disease. Lower absolute counts but higher percentages of total CD4+ forkhead box protein 3 (FoxP3)+ T cells were recorded in children with severe immunosuppression than in those without evidence of immunosuppression. The frequencies of classical CD4+CD25+FoxP3+ regulatory T cells were not altered, whereas CD4+FoxP3+CD25- T cells were found increased significantly in patients with severe immunosuppression. Like classical regulatory T cells, CD4+FoxP3+CD25- T cells display higher cytotoxic T-lymphocyte antigen 4 (CTLA-4) but lower CD127 expression compared with CD4+FoxP3–CD25+ T cells. An improvement in CD4+ T cell counts, along with a decrease in viral load, was associated with a decrease in CD4+FoxP3+CD25- T cells. The majority of the patients with severe immunosuppression were positive for at least one out of seven autoantibodies tested and displayed hypergammaglobulinaemia. Conversely, HIV-infected children without evidence of immunosuppression had lower levels of autoantibodies and total immunoglobulins. A decline in CD4+FoxP3+ T cell numbers or a variation in their phenotype may induce a raise in antigen exposure with polyclonal B cell activation, probably contributing to the generation of autoantibodies in the absence of clinical autoimmune disease.
Keywords: autoantibodies, paediatric HIV, Treg
Introduction
Circulating CD4+ regulatory T cells (Tregs) with constitutive immunosuppressive activity are one of the most important cellular subsets involved in controlling inappropriate or excessive immune activation [1]–[3]. Although the physiological function of Tregs is central for maintaining self-tolerance, the negative regulatory activity of these cells can also be counterproductive, as Tregs can suppress immune responses against tumours and viral infections [4]–[8].
Expression of forkhead box protein 3 (FoxP3), together with the interleukin (IL)-2 receptor α chain (CD25) by CD4+ T cells, are used widely as markers to identify Tregs. However, it has been shown that both CD25 and FoxP3 expression could be induced in human naive CD4+ T cells through cell activation, making the identification of FoxP3+ T cells as pure Treg cells difficult [9]. The lack of cell surface expression of CD127 (also known as IL-7 receptor α-chain) has been used to further distinguish Tregs[10],[11]. Furthermore, cells with regulatory properties are also found in the subset of CD4+FoxP3+CD25- T cells [12], confirming the heterogeneity of T cell subsets with suppressive functions.
Chronic immune activation and progressive immune exhaustion are central features of human immunodeficiency virus (HIV) pathogenesis. The expansion of Tregs in HIV infection could, hypothetically, decrease the magnitude of T cell responses in viraemic patients and render them more susceptible to other pathogens [13]. Alternatively, Tregs may have a protective effect, restraining activation-induced immunopathology caused by persistent viraemia [6],[14]–[17].
Several B cell defects have been reported in HIV-infected individuals, mainly in subjects with increased viral load, including polyclonal B cell activation, hypergammaglobulinaemia, induction of terminal differentiation of B cells and increased levels of autoantibodies [18]. In addition, HIV infection is associated with a loss of memory B cells and increased apoptosis in the B cell compartment [19],[20]. The association between immune dysfunction and the development of autoimmune diseases in patients with HIV/acquired immune deficiency syndrome (AIDS) is intriguing [21]. The possible mechanisms for autoimmune manifestations include the direct effect of HIV on endothelial, synovial and haematopoietic cells, resulting in the destruction of CD4+ T cells, increased cytotoxic cell activity and increased expression of autoantigens. Polyclonal B cell activation with increased levels of total immunoglubulins and autoantibodies have also been reported in HIV-infected children [22]–[27]. More recently, immune activation was associated with diminished frequencies of Tregs[28],[29].
Because it is still not known whether or not immune deregulation in HIV infection influences the generation of autoimmune phenomena in paediatric HIV infection, we examined the association between the numbers or phenotype of Tregs and the presence of autoantibodies in a paediatric cohort of HIV-infected children with different degrees of immunosuppression.
Materials and methods
Study population
The group of children evaluated comprised 65 HIV-infected children (30 males and 35 females, aged between 3 and 17 years) treated at the authors' College Hospital. Vertical transmission of HIV infection was confirmed by enzyme-linked immunosorbent assay (ELISA) and Western blot analysis. Patients were selected on the basis of their clinical and immunological status according to the Centers for Disease Control and Prevention (CDC) 1994 paediatric classification [30]. HIV-infected children were divided into two groups: group A, subjects severely immunosuppressed (i.e. CD4+ T cells < 15%, n = 28) and group B, subjects with no evidence of immunosuppression (i.e. CD4+ T cells > 25%, n = 37) (Table 1). Control samples were obtained from 10 HIV-seronegative healthy children among the population coming to the hospital for vaccination. Informed consent was obtained from the parents of all children included in the study, which was approved by the Institution Ethical Committee.
Table 1.
Summary of clinical characteristics of study participants.
| Group A (CD4+ < 15%) | Group B (CD4+ > 25%) | Uninfected (CD4+ 35 ± 3%) | |
|---|---|---|---|
| Number of patients | 28 | 37 | 10 |
| Year age median (range) | 12·9 (3·1–17) | 11·0 (3–17) | 9·5 (2–12) |
| Co-morbidities (n) | No | ||
| Herpes zoster | 1 | 1 | |
| Oral candidiasis | 1 | ||
| Acute otitis media | 2 | ||
| Cryptococcus neoformans in CNS | 2 | ||
| Varicella | 1 | ||
| Pneumonia | 5 | 1 | |
| Tuberculosis | 1 | ||
| Signs/symptoms of autoimmune disease | No | No | No |
| ART | n = 20 (NRTI, PI) | n = 27 (NRTI, PI, NNRTI) | – |
| Length of treatment | 6·3 years | 6·8 years | |
| Viral load mean ± SD (log10 IU/ml) | 4·02 ± 1·27† | 2·55 ± 1·18 | – |
Significantly increased compared with group B (P < 0·001, Fisher's exact test). NRTI, nucleoside reverse transcriptase inhibitor; PI, protease inhibitor; NNRTI, non-nucleoside reverse transcriptase inhibitor; CNS, central nervous system; SD, standard deviation; ART, anti-retroviral therapy.
Plasma HIV RNA viral load
Ethylenediamine tetraacetic acid (EDTA) anti-coagulated blood was centrifuged at 1000 g for 15 min for plasma collection and stored at −80°C until use. HIV RNA level was determined using Nuclisens EasyQ HIV version 1·2 (bioMérieux, Marcy l'Etoile, France). Results are expressed as log10 of number of copies/ml.
Treg phenotyping
Peripheral blood mononuclear cells (PBMC) were isolated from heparinized venous blood by density gradient centrifugation with Ficoll-Hypaque. Staining of 2 × 10⁶ PBMC with surface markers was performed using the following anti-human monoclonal antibodies: CD4 [peridinin chlorophyll (PerCP)], CD25 [fluorescein isothiocyanate (FITC)], CD127 (AlexaFluor 647), CD69 [allophycocyanin (APC)] and human leucocyte antigen D-related (HLA-DR) (APC) from BD Biosciences (San Jose, CA, USA). Intracellular markers were detected using FoxP3 [phycoerythrin (PE)], cytotoxic T lymphocyte antigen 4 (CTLA-4) (APC) and interferon (IFN)-γ (APC) from BD Biosciences, according to the manufacturer's instructions. Data were acquired on a fluorescence activated cell sorter (FACS) Calibur cytometer (Becton Dickinson, Franklin Lakes, NJ, USA) and analysed with CellQuest software (Becton Dickinson). At least 20 000 CD4+ T lymphocytes were acquired for analysis of FoxP3+ cells. An automatized blood cell count was recorded in all patients (Cell Dyn 3500, Abbott, Santa Clara, CA, USA) to determine the absolute levels of CD4+ T cells, total CD4+FoxP3+ T cells or CD25+/CD25- CD4+ Treg subsets.
Determination of autoantibodies
For determination of autoantibodies, immunoglobulin levels and C3 and C4 complement factors, blood to be used for serum analysis was allowed to coagulate at 37°C and centrifuged at 1000 g for 15 min for sera separation. Anti-nuclear factor (ANA), anti-DNA, anti-smooth muscle (ASMA), anti-mitochondrial (AMA) and anti-neutrophil cytoplasm (ANCAc, ANCAp) antibodies were assayed by indirect immunofluorescence (IMMCO, Diagnostic, Buffalo, NY, USA) while anti-cardiolipin (ACA) antibodies were measured by ELISA (Binding Site, Birmingham, UK). Rheumatoid factor (RF), total immunoglobulin as well as C3 and C4 levels were measured by nephelometry (Immage Beckman Coulter, Brea, CA, USA).
Statistical analysis
The Mann–Whitney U-test and Kruskal–Wallis with Dunn's correction test were performed to compare the levels of CD4+FoxP3+ and CD4+FoxP3+CD25+/CD25- T cells among the different clinical groups evaluated. Fisher's exact test was applied to compare the frequency of subjects with positive tests in each clinical group. A correlation analysis was applied by Spearman's rank method. P < 0·05 was considered statistically significant. A univariate analysis was performed to determine differences between children with or without signs of immunosuppression. Student's t-test or Wilcoxon's rank sum test were applied for continuous variables, while the χ2 test was used for categorical variables. Only variables that were statistically different in the univariate analysis (P < 0·10) were included in the multivariate analysis (logistic regression). Correlations between variables were explored with the Pearson test. Those variables that showed collinearity were analysed in different logistic regression models. All statistical analysis was carried out using Analytical Software Statistix version 8·0.
Results
Clinical characteristics and treatment of study population
The main characteristics of the entire study population are summarized in Table 1. All 65 paediatric patients acquired the infection by vertical transmission, but no prophylactic measures were applied in HIV-infected mothers, neither during pregnancy nor during delivery. Ages of diagnosis in children with severe immunosuppression (group A) were similar to those in children without evidence of immunosuppression (group B) (mean = 5·8 years and 4·5 years, respectively). Anti-retroviral therapy (ART) included nucleoside reverse transcriptase inhibitors (NRTIs), protease inhibitors (PI) and non-nucleoside reverse transcriptase inhibitors (NNRTIs).
HIV infection was diagnosed recently in five of the eight children in group A who were not receiving ART, while treatment had been dropped by the remaining three patients. Similarly, HIV infection had been diagnosed recently in all children from group B who were not under treatment at initiation of the study. Eighteen children in group A and seven in group B showed virological failure, defined for all children as a <1·0 log10 decrease in HIV RNA copy number from baseline after 8–12 weeks of therapy, HIV RNA >400 copies/ml after 6 months of therapy or repeated levels of HIV RNA copies above the limit of detection after 12 months of therapy. Eighteen of the 65 patients included were also evaluated at two different time-points with an average follow-up period of 12 months (Table 2). One of these 18 patients was diagnosed recently for HIV infection, and thus was naive of treatment at inclusion (i.e. subject 14 in Table 2), four children were already receiving the appropriate ART (i.e. patients 8, 12, 13 and 18 in Table 2), while the remaining 13 children showed virological failure due to deficient adherence to treatment.
Table 2.
Clinical characteristics of 18 human immunodeficiency virus (HIV)-infected children at inclusion in the study and at follow-up.
| Patient ID | CD4 count at initiation of study (cells/µl) | Viral load at initiation of study (log CV) | HIV-related illness | ARV at inclusion | Months of ARV at inclusion | CD4 count at follow-up (cells/µl) | Viral load at follow-up (log CV) |
|---|---|---|---|---|---|---|---|
| 1 | 203 | 5·3† | d4T ABV FPV/r | 60 | 175 | 4·8 | |
| 2 | 85 | 5·25† | Otitis media | AZT 3TC LPV/r | 24 | 140 | 3·74 |
| 3 | 86 | 5·43† | Cryptococcal meningitis | d4T ABV LPV/r | 168 | 276 | 1·7 |
| 4 | 194 | 5·36† | AZT ABV LPV/r | 120 | 155 | 4·23 | |
| 5 | 184 | 3·71† | AZT DDI NFV | 60 | 222 | 3·74 | |
| 6 | 496 | 3·43† | d4T ABV FPV/r | 156 | 426 | 4·07 | |
| 7 | 185 | 2·84† | EFV ABV FPV/r | 96 | 227 | 2·64 | |
| 8 | 222 | 1·7 | d4T ABV LPV/r | 72 | 421 | 2·3 | |
| 9 | 684 | 3·94† | d4T DDI DRV/r | 156 | 470 | 4 | |
| 10 | 853 | 4·88† | AZT DDI NFV | 84 | 1123 | 2·1 | |
| 11 | 879 | 3·11† | DDI NVP NFV | 168 | 734 | 2·38 | |
| 12 | 1073 | 1·7 | AZT 3TC NFV | 144 | 1325 | 3·99 | |
| 13 | 687 | 1·7 | d4T ABV IND/r | 156 | 663 | 1·7 | |
| 14 | 942 | 4·61 | AZT 3TC NFV | 0 | 556 | 3·07 | |
| 15 | 546 | 3·56† | AZT 3TC NFV | 120 | 556 | 3·31 | |
| 16 | 487 | 5·75† | Pneumonia | AZT 3TC NFV | 36 | 911 | 5·07 |
| 17 | 234 | 3·61† | AZT DDI LPV/r | 16 | 497 | 1·7 | |
| 18 | 669 | 1·7 | AZT DDI NFV | 60 | 1142 | 2·3 | |
| Mean | 483·8 | 3·75 | 556·6 | 3·16 | |||
| SD | 321·7 | 1·42 | 363·6 | 109 | |||
| Median | 491·5 | 3·66 | 483 | 3·19 |
Children with virological failure. d4T, stavudine; DDI, didanosine; AZT, zidovudine; ABV, abacavir; 3TC, lamivudine; NVP, nevirapine; NFV, nelfinavir; EFV, efavirenz; FPV/r, fosamprenavir + ritonavir; LPV/r, lopinavir + ritonavir; ARV, anti-retroviral therapy; SD, standard deviation; DRV, darunavir/rotanavir; IND, indinavir.
Decreased numbers of CD4+FoxP3+ T cells in peripheral blood of HIV-infected children
The expression of FoxP3, one of the most specific markers for Tregs[31]–[34], was quantified to determine the levels of total Tregs in HIV-infected paediatric patients. Lower absolute levels of CD4+FoxP3+ T cells were recorded in children with severe immunosuppression (group A) than in children without evidence of immunosuppression (group B) and uninfected controls (Fig. 1a). Conversely, percentage levels of total CD4+FoxP3+ T cells were higher in group A compared with group B and the control group (Fig. 1b).
Fig. 1.
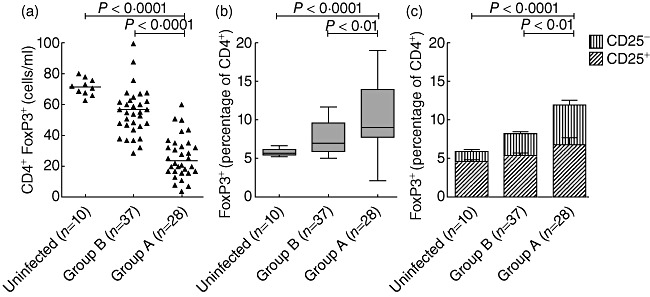
The frequency and phenotype of CD4+forkhead box P3 (FoxP3)+ T cells are altered in human immunodeficiency virus (HIV)-paediatric patients. Peripheral blood mononuclear cells (PBMC) were collected and stained with anti-CD4, anti-CD25 and FoxP3 monoclonal antibodies. CD4+ T cells were gated from a side-scatter (SSC) versus CD4 dot-plot and the expression of FoxP3 and CD25 was analysed with CellQuest Pro software. Blood cell count was recorded in all subjects. (a) Absolute numbers (shown as cells per millilitre of blood) of total CD4+FoxP3+ T cells. The horizontal lines denote the median values for each clinical group. (b) FoxP3+ T cell levels (expressed as percentages of CD4+ T cells) in the different clinical groups. Boxes represent values between the 25th and 75th percentiles and medians; bars indicate 10th and 90th percentiles. (c) Frequency of regulatory CD4+ T cell subsets according to CD25 expression. CD4+CD25–FoxP3+ T cells in group A were significantly higher compared with those in group B and uninfected controls.
When co-expression between CD25 and FoxP3 was tested, no significant differences in CD4+FoxP3+CD25+ T cells as percentage frequencies were found among patient groups (Fig. 1c), while CD4+Foxp3+CD25- T cells were increased significantly in HIV-infected children with severe immunosuppression in comparison with those without evidence of immunosuppression and healthy controls (Fig. 1c).
The absolute CD4+FoxP3+ T cell counts as well as the percentages of CD4+FoxP3+CD25- T cells correlated strongly with the degree of immunosuppression, as determined by multivariate analysis (Table 3). Similarly, viral load and the percentages of total CD4+FoxP3+ T cells were also statistically significant in the multivariate analysis (Table 3).
Table 3.
Univariate and Multivariate analysis for immunosuppression in HIV-infected children.
| Univariate analysis | Multivariate analysis | ||||
|---|---|---|---|---|---|
| Study variables | Group A (CD4+ < 15%) | Group B (CD4+ > 25%) | P-value | Coefficient β | P-value |
| Age, years ± SD | 10·97 ± 5·15 | 10·46 ± 4·6 | 0·67 | ||
| Anti-retroviral treatment† (%) | 19/28 (68) | 32/37 (86) | 0·07 | −0·45 | 0·68 |
| Logarithm 10 of viral copies ± DS | 3·97 ± 1·3 | 2·71 ± 1·22 | 0·0002 | 0·708 | 0·035 |
| Co-morbidities† (%) | 15/28 (54) | 8/37 (22) | 0·0076 | 1·1 | 0·20 |
| Treatment adherence† (%) | 7/24 (29) | 23/33 (70) | 0·0025 | −0·50 | 0·67 |
| Absolute count CD4+FoxP3+ | 28·7 ± 27·4 | 63·7 ± 27·7 | <0·0001 | −0·06 | 0·0004* |
| %CD4+FoxP3+ | 12·7 ± 8·4 | 7·7 ± 2·3 | 0·0043 | 0·22 | 0·04* |
| %CD4+FoxP3+CD25– | 5·98 ± 5·4 | 2·75 ± 1·2 | 0·0044 | 0·82 | 0·002* |
| %CD4+FoxP3+CD25+ | 6·7 ± 4·59 | 4·84 ± 1·75 | 0·05 | 0·14 | 0·17* |
Variables with collinearity were analysed in different multivariate models.
No. of positive patients/total no. of subjects assayed. Bold type indicates significant differences. FoxP3, forkhead box protein 3; DS, double-stranded; SD, standard deviation.
Phenotyping of CD4+FoxP3+CD25+ and CD4+FoxP3+CD25- T cells
To confirm whether CD4+FoxP3+CD25- T cells were Tregs with altered CD25 expression, markers of suppressive (i.e. CTLA-4) and effector (i.e. IFN-γ production) functions, respectively, as well as activation (i.e. CD127, CD69 and HLA-DR), were measured on CD4+FoxP3+CD25+, CD4+FoxP3+CD25- and CD4+FoxP3–CD25+ T cells. No significant differences in CTLA-4 [Fig. 2a (upper panel), b], CD127 (Fig. 2c), CD69 [Fig. 2a (bottom panel), e], HLA-DR (Fig. 2f) expression or IFN-γ production (Fig. 2d) were found between CD4+FoxP3+CD25+ and CD4+FoxP3+CD25- T cells. Conversely, either CD4+FoxP3+CD25+ or CD4+FoxP3+CD25- T cells exhibited higher CTLA-4 (Fig. 2b) but lower CD127 (Fig. 2c) expression than CD4+FoxP3–CD25+ T cells.
Fig. 2.
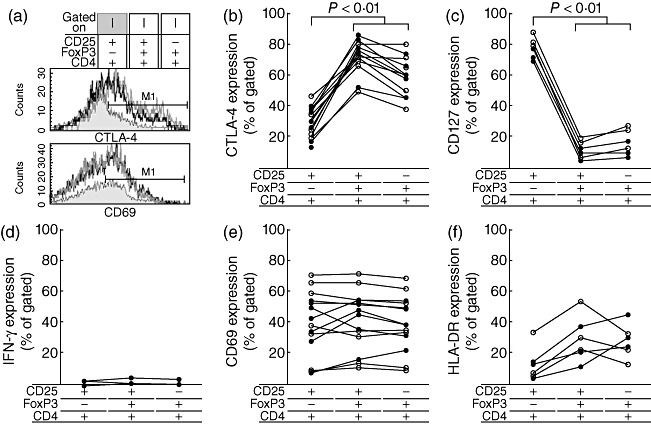
Phenotypic analysis of forkhead box P3 (FoxP3)-expressing CD4+ T cells. Peripheral blood mononuclear cells (PBMC) were collected and stained with anti-CD4, anti-CD25 and anti-FoxP3 in combination with anti-cytotoxic T lymphocyte antigen 4 (CTLA-4) (n = 14), CD69 (n = 14), CD127 (n = 6), interferon (IFN)-γ (n = 4) or human leucocyte antigen D-related (HLA-DR) (n = 6). Lymphocytes were identified by forward- and side-scatter properties. From this population, a CD4 versus FoxP3 dot-plot was set. Subsequently, CD4+FoxP3+ or CD4+FoxP3- T cell populations were gated and analysed for CD25 versus CTLA-4, CD127, IFN-γ, CD69 or HLA-DR. (a) Representative histogram plot from a single human immunodeficiency virus (HIV)-infected child showing CTLA-4 (upper panel) and CD69 (bottom panel) expression on CD4+FoxP3–CD25+, CD4+FoxP3+CD25+ and CD4+FoxP3+CD25- T cells. Proportions of CD4+FoxP3–CD25+, CD4+FoxP3+CD25+ and CD4+FoxP3+CD25- T cells co-expressing CTLA-4 (b), CD127 (c), IFN-γ (d), CD69 (e) or HLA-DR (f) were measured in HIV-infected children exhibiting immunosuppression (closed circle) or without signed of immunosuppression (open circle).
Levels of autoantibodies and total immunoglobulins in HIV-infected children
The decreased absolute CD4+FoxP3+ T cell counts found in subjects with severe immunosuppression prompted us to investigate the presence of autoantibodies in relation to the levels of Tregs in a cohort of 30 HIV-infected children and 10 uninfected healthy controls. Demographic and clinical features of this patient group are shown in Table S1.
Thirteen of 15 (87%) patients in group A were positive for at least one of seven autoantibodies tested (range 1–3 positive antibodies/patient), whereas only four of 15 (27%) patients in group B showed detectable autoantibodies (range 1–2 positive autoantibodies/patient) (Table 4). Conversely, autoantibodies were not found in uninfected children (Table 4).
Table 4.
Levels of CD4+FoxP3+ T cells, autoantibodies and total immunoglobulins in human immunodeficiency virus (HIV)-infected and uninfected children.
| Group A (n = 15) | Group B (n = 15) | Uninfected (n = 10) | ||
|---|---|---|---|---|
| CD4+FoxP3+ T cells (cells/mm3 ± SD) | 16·5 ± 14·2a | 70·1 ± 24·1 | 72 ± 9·1 | |
| No. of positive tests (median IU/ml, range)b | RF | 10 | 8 | 0 |
| 37·6 (20–223)c | 21 (20–42) | <20d | ||
| ACA | 10 | 3 | 0 | |
| 29 (18–69)e | 19 (18–29) | <15d | ||
| ANA | 1 | 0 | 0 | |
| DNA | 0 | 0 | 0 | |
| AMA | 2 | 0 | 0 | |
| ASMA | 7 | 2 | 0 | |
| ANCA | 3 | 0 | 0 | |
| No. of patients with positive findings for at least one autoantibody out of the total evaluated (%) | 13 (87)f | 4 (27) | 0 (0) | |
| Total immunoglobulins (median mg/dl, range) | IgA | 302 (107–838)g | 205·3 (43–459) | 124 (64–184) |
| IgM | 297 (132–344)h | 136 (58–386) | 79 (56–102) | |
| IgG | 2190 (823–3500)i | 1580 (900–3390) | 946 (822–1070) |
P = 0·001 versus group B and uninfected subjects, Kruskal–Wallis test.
Applicable for quantitative tests.
P = 0·049 versus group B, Mann–Whitney U-test.
Detection limit.
P = 0·009 versus group B, Mann–Whitney U-test.
P = 0·022 versus group B; P = 0·008 versus uninfected controls, Fisher's exact test.
P = 0·001 versus group B and uninfected controls, Kruskal–Wallis test.
P < 0·0001 versus group B and uninfected controls, Kruskal–Wallis test.
P < 0·0001 versus uninfected controls, Kruskal–Wallis test. Ig, immunoglobulin; ANCA, anti-neutrophil cytoplasm; ASMA, anti-DNA, anti-smooth muscle; AMA, anti-mitochondrial; ANA, anti-nuclear factor; FoxP3, forkhead box protein 3; RF, rheumatoid factor; SD, standard deviation.
RF and ASMA were the most frequently observed autoantibodies in both clinical groups of infected children (Table 4). Conversely, ACA were found mainly in children with severe immunosuppression (Table 4). Although differences in autoantibody levels based on the degree of immunosuppression were not significant, ASMA were detected frequently more among patients with severe disease (Table 4).
In the 30 patients evaluated, high levels of ACA (Fig. 3a) and RF (Fig. 3b) were associated with low CD4+ T cell counts. While ACA levels were not related to either the absolute number of total CD4+FoxP3+ T cells (CD4+FoxP3+CD25+ and CD4+FoxP3+ CD25- T cells) or any of the CD25+/CD25- regulatory T cell subsets (data not shown), a negative correlation was found between RF and absolute total CD4+FoxP3+ T cell counts (Fig. 3c). Conversely, when CD4+FoxP3+CD25+ and CD4+FoxP3+CD25- T cells were analysed separately, no association was observed between Treg and RF levels. In the present study, the 30 patients evaluated did not present any clinical evidence of autoimmune disease with normal serum concentrations of C3 and C4 (data not shown), even in those patients with a five- to 10-fold increase in RF levels (reference range <20 IU/ml). The higher prevalence of autoantibodies observed in patients with severe immunosuppression compared with those without evidence of immunosuppression was linked to increased levels of total immunoglobulins (Table 4).
Fig. 3.
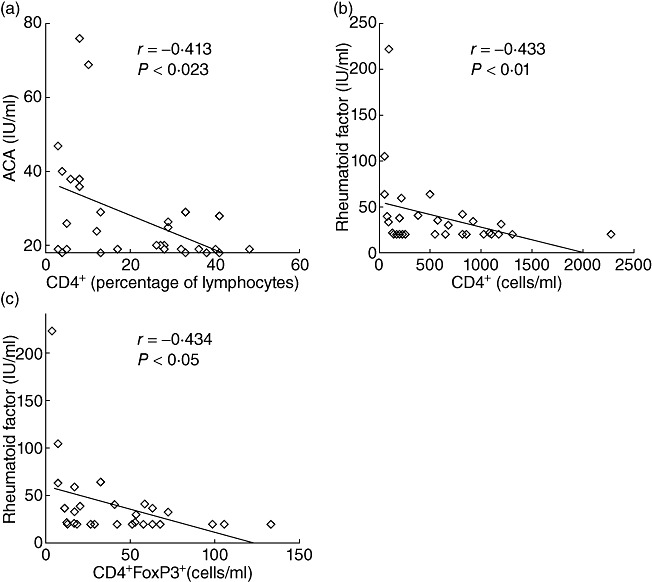
Relationship among total regulatory T cells (Treg), anti-cardiolipin (ACA), rheumatoid factor (RF) and CD4 count. Correlation analysis was performed by Spearman's rank method. (a) ACA versus percentage of CD4+ T cells. (b) RF versus CD4+ T cell counts (cells/ml). (c) RF versus total CD4+FoxP3+ T cell counts (cells/ml).
Taken together, these results support that depletion of Tregs in HIV-infected children is linked to the appearance of RF autoantibodies, while the reduction in CD4+ T cells appeared to be related mainly to the presence of ACA and RF autoantibodies.
Monitoring of CD4+FoxP3+ T cells in HIV-infected children
We next analysed whether changes in CD4 T cell count were linked with phenotypical alterations in Tregs in an average 12-month follow-up period in 18 HIV-infected children (Table 2). Although substantial changes in Treg numbers were generally not observed, a positive correlation between changes in immunological status during the follow-up period (Δ%CD4 = %CD4t12 − %CD4t0) and changes in FoxP3+ T cells phenotype (Δratio = %CD25+t12/%CD25–t12 − %CD25+t0/%CD25–t0) was recorded (Fig. 4a). As observed in Fig. 4b,c, an improvement in CD4+ T cell counts along with a decrease in viral load was associated with a decline in the frequency of CD4+FoxP3+CD25- T cells to levels comparable to those observed in healthy controls.
Fig. 4.
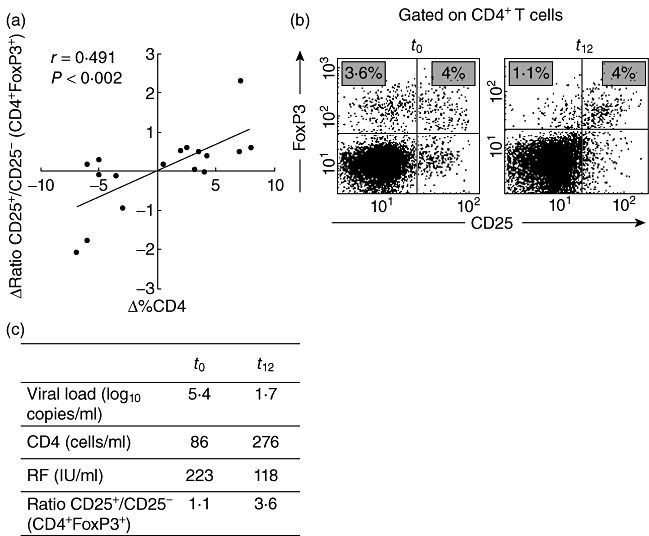
Monitoring of CD4+ forkhead box P3 (FoxP3)+CD25+ T cells and CD4+ T cell counts in human immunodeficiency virus (HIV)-infected children. The frequency of CD4+FoxP3+CD25+ and CD4+ T cells were determined at two different time-points during an average of 12-month follow-up period. (a) Correlation analysis between changes in the levels of CD4+ T cells (Δ% CD4) and changes in regulatory T cell (Treg) phenotype (Δratio %CD4+FoxP3+CD25+/%CD4+FoxP3+CD25–). (b) Representative dot-plot of CD25 and FoxP3 expression in CD4+ T cells during follow-up (t0 and t12 patient 3 in Table 2). CD4+ T cells were gated from a side-scatter (SSC) versus CD4 dot-plot and the expression of CD25 and FoxP3 was calculated. The figures in the upper left quadrants show the percentages of CD4+FoxP3+CD25- T cells, while the percentages of CD4+FoxP3+CD25+ T cells are shown in the upper right quadrants. (c) Summary of immune/virological status of the same patient showed in (b).
Even though a substantial alteration in RF levels was not found during follow-up, the two patients (i.e. patients 3 and 17 in Table 2) who showed the higher decrease in RF also had a diminution in CD4+FoxP3+CD25- T cells (Fig. 4b,c). It is noteworthy that both patients showed improved immune and virological status, as determined by a rise in CD4+ T cell count and a decrease in viral load.
Discussion
HIV infection is characterized by a progressive loss of CD4+ T cells, chronic immune activation and an increasing array of immune dysfunctions [35],[36]. Polyclonal hypergammaglobulinaemia, depletion and/or dysfunction of CD4+ Tregs probably contribute to the production of autoantibodies observed in a proportion of HIV-infected children in the absence of clinical autoimmune disease [22]–[27]. This study reports for the first time that diminished absolute levels of Tregs are associated with a higher prevalence of autoantibodies and hypergammaglobulinaemia in HIV-infected children with severe immunosuppression.
In agreement with the findings in HIV-infected adults, RF, ACA and ASMA were the most prevalent autoantibodies [37]–[41]. The highest levels of RF and ACA as well as total immunoglobulins were recorded in patients with the lowest CD4+FoxP3+T cell count, supporting the notion that Tregs play a main role in the control of immune activation and autoantibody production. Moreover, correlation analysis supports that depletion of Tregs in HIV-infected children is linked to the appearance of RF autoantibodies, while the reduction in CD4+ T cells appeared to be related mainly to the presence of ACA and RF autoantibodies.
In contrast to the diminished absolute Treg numbers, the percentages of total CD4+FoxP3+ T cells are raised in children with signs of severe immunosuppression. Previous reports have shown low levels of classical Treg CD4+FoxP3+CD25+, along with an increased activation status in an HIV+ paediatric cohort [29]. In the present study, the rise in total CD4+FoxP3+ T cells is due to an increase in a putative Treg population CD4+FoxP3+CD25- but not to an increase in classical CD4+FoxP3+CD25+ Tregs. The regulatory T cell subset CD4+FoxP3+CD25- might arise from activated CD4+ T cells that express FoxP3, or constitutes atypical Treg[42]–[44]. Other studies have demonstrated that CD4+FoxP3+CD25- T cells represent a peripheral reservoir of committed regulatory T cells, recruited to the CD25+ T cell pool upon homeostatic expansion or activation [45]. The relative increase of this subset in the group with lower CD4+ T cell counts would be a consequence of the extended HIV-associated chronic immune activation, or higher induction of atypical Tregs which, in turn, can differentiate into conventional Tregs[45]. The diminution in the absolute levels of CD4+ T cells and the simultaneous percentage increase in CD4+FoxP3+CD25- T cells might also be due to a slower decline of the latter T cell subset [46]. In our study, the absolute total CD4+FoxP3+ T cell counts and the percentages of CD4+FoxP3+CD25- T cells appeared to be associated strongly with immunosuppression.
This particular subset of CD4+FoxP3+CD25- T cells was also reported in patients with systemic lupus erythematosus [47]–[49] and displayed a suppressive capacity for T cell proliferation but not for IFN-γ production [49], supporting that CD4+FoxP3+ T cells were dysfunctional Tregs. In this study, CD4+FoxP3+CD25- T cells showed similar phenotypical features to CD4+FoxP3+CD25+ T cells, including CTLA-4 expression, a typical marker of suppressive capacity in Tregs; nor was the activation status of these Treg subsets different, as determined by the expression of CD69, CD127 and HLA-DR. Moreover, IFN-γ production, distinctive of effector T cells but not Tregs, was not detected. Therefore, CD4+FoxP3+CD25- in HIV-infected children appeared to be Tregs with abnormal CD25 expression. However, we cannot rule out that this Treg subpopulation displays some kind of dysfunction.
In our cohort of patients, we observed a strong inverse association between the presence of autoantibodies and absolute numbers of CD4+ or CD4+FoxP3+ T cells, respectively, in the absence of signs of rheumatic disease, altered blood-clotting test, thromboembolic phenomena or liver involvement. As the level of CD25 expression correlates with the suppressive capacity of conventional Tregs[50],[51], we can hypothesize that the rise in CD4+FoxP3+CD25- T cells might enhance the immune deregulation observed in children with severe immunosuppression, allowing autoreactive B cells to differentiate into antibody-producing plasma cells [17]. Supporting this notion, two children with deficient adherence to treatment who restarted an anti-retroviral regimen showed a marked decrease in RF levels along with a decline in the proportion of CD4+FoxP3+CD25- T cells (i.e. patients 3 and 17 in Table 2). Moreover, diminished levels of CD4+FoxP3+ T cells or changes in their phenotype, together with a scarce T cell surveillance, might lead to the appearance of recurrent or persistent infections. This may, in turn, induce a rise in antigen exposure with polyclonal B cell activation that probably contributes to the generation of autoantibodies in the absence of clinical autoimmune disease. However, we cannot rule out that hyperactivation of B cells observed during HIV infection could be responsible for the presence of autoantibodies in HIV-infected children. Aberrant immune activation of B cells is also supported by the increased expression of activation, proliferation and terminal differentiation markers on circulating B cells [18], as well as by the production of a large amount of immunoglobulins when PBMC obtained from HIV-1-infected subjects are cultured in vitro[52],[53]. Furthermore, HIV-infected subjects who developed hypergammaglobulinaemia, thrombocytopenia or other autoimmune manifestations associated with HIV infection had increased frequencies of CD5+ B cells, a subset of the natural immune system related to the generation of naturally occurring autoantibodies [54]. Conversely, other studies have shown that CD5+ B cells do not contribute to hypergammaglobulinaemia or autoantibody production in HIV-infected subjects [55],[56].
Although the role of these autoantibodies is not clear at present, a long-term infection that leads the host immune system to chronic activation and exhaustion [57] may provide an appropriate environment to trigger an autoimmune disease. We have shown previously that chronic immune activation is a major feature in HIV-infected children [58],[59]. The present work points out that not only the frequencies but also the phenotype of CD4+FoxP3+ T cells are important parameters to characterize the immunoregulatory status during paediatric HIV infection. Atypical Tregs seem to represent an additional marker of immune dysfunction in children with HIV infection.
The identification of additional markers for monitoring treatment efficacy and disease progression is especially needed in perinatally acquired HIV infection, in which the development of a naive immune system in the presence of a persistent pathogen might manifest clinical and immunological features different from those observed in HIV-infected adults. Furthermore, the findings obtained in children might be subjected to certain variability due to virological and/or immunological failure related to possible suboptimal adherence or regimen discontinuations.
In summary, this study shows that low absolute numbers of CD4+FoxP3+ T cells were associated with an increased prevalence of autoantibodies and increased levels of total immunoglobulins in HIV-infected children with severe immunosuppression. This work also reports for the first time enhanced frequencies of a particular CD4+FoxP3+CD25- Treg subset. Longitudinal follow-up of HIV-infected children without clinical symptoms of autoimmune disease would shed light on the prognostic significance of these findings.
Acknowledgments
We thank Professor Verónica Gatto Bellora for technical assistance and Dr Rodolfo Viotti for statistical analysis. This study was supported by the Health Department, Government of the City of Buenos Aires, Argentina. Susana Laucella is member of the Scientific Career of The National Council for Scientific and Technical Research (CONICET), Argentina.
Disclosure
The authors declare no financial or commercial conflicts of interest.
Supporting information
Table S1. Clinical features of humanimmunodeficiency virus (HIV)-infected children evaluated for thepresence of autoantibodies and regulatory T cell (Treg)levels.
References
- 1.Adeegbe D, Bayer AL, Levy RB, Malek TR. Cutting edge: allogeneic CD4+CD25+Foxp3+ T regulatory cells suppress autoimmunity while establishing transplantation tolerance. J Immunol. 2006;176:7149–53. doi: 10.4049/jimmunol.176.12.7149. [DOI] [PubMed] [Google Scholar]
- 2.Chang X, Zheng P, Liu Y. Homeostatic proliferation in the mice with germline Foxp3 mutation and its contribution to fatal autoimmunity. J Immunol. 2008;181:2399–406. doi: 10.4049/jimmunol.181.4.2399. [DOI] [PubMed] [Google Scholar]
- 3.Piccirillo CA, d'Hennezel E, Sgouroudis E, Yurchenko E. CD4+Foxp3+ regulatory T cells in the control of autoimmunity: in vivo veritas. Curr Opin Immunol. 2008;20:655–62. doi: 10.1016/j.coi.2008.09.006. [DOI] [PubMed] [Google Scholar]
- 4.Kotsianidis I, Bouchliou I, Nakou E, et al. Kinetics, function and bone marrow trafficking of CD4+CD25+FOXP3+ regulatory T cells in myelodysplastic syndromes (MDS) Leukemia. 2009;23:510–18. doi: 10.1038/leu.2008.333. [DOI] [PubMed] [Google Scholar]
- 5.Card CM, McLaren PJ, Wachihi C, Kimani J, Plummer FA, Fowke KR. Decreased immune activation in resistance to HIV-1 infection is associated with an elevated frequency of CD4(+)CD25(+)FOXP3(+) regulatory T cells. J Infect Dis. 2009;199:1318–22. doi: 10.1086/597801. [DOI] [PubMed] [Google Scholar]
- 6.Manigold T, Shin EC, Mizukoshi E, et al. Foxp3+CD4+CD25+ T cells control virus-specific memory T cells in chimpanzees that recovered from hepatitis C. Blood. 2006;107:4424–32. doi: 10.1182/blood-2005-09-3903. [DOI] [PMC free article] [PubMed] [Google Scholar]
- 7.Bi X, Suzuki Y, Gatanaga H, Oka S. High frequency and proliferation of CD4+Foxp3+ Treg in HIV-1-infected patients with low CD4 counts. Eur J Immunol. 2009;39:301–9. doi: 10.1002/eji.200838667. [DOI] [PubMed] [Google Scholar]
- 8.Aandahl EM, Michaelsson J, Moretto WJ, Hecht FM, Nixon DF. Human CD4+ CD25+ regulatory T cells control T-cell responses to human immunodeficiency virus and cytomegalovirus antigens. J Virol. 2004;78:2454–9. doi: 10.1128/JVI.78.5.2454-2459.2004. [DOI] [PMC free article] [PubMed] [Google Scholar]
- 9.Gavin MA, Torgerson TR, Houston E, et al. Single-cell analysis of normal and Foxp3-mutant human T cells:Foxp3 expression without regulatory T cell development. Proc Natl Acad Sci USA. 2006;103:6659–64. doi: 10.1073/pnas.0509484103. [DOI] [PMC free article] [PubMed] [Google Scholar]
- 10.Liu W, Putnam AL, Xu-Yu Z, et al. CD127 expression inversely correlates with Foxp3 and suppressive function of human CD4+ Treg cells. J Exp Med. 2006;203:1701–11. doi: 10.1084/jem.20060772. [DOI] [PMC free article] [PubMed] [Google Scholar]
- 11.Seddiki N, Santner-Nanan B, Martinson J, et al. Expression of interleukin (IL)-2 and IL-7 receptors discriminates between human regulatory and activated T cells. J Exp Med. 2006;203:1693–700. doi: 10.1084/jem.20060468. [DOI] [PMC free article] [PubMed] [Google Scholar]
- 12.Zheng Y, Manzotti CN, Burke F, et al. Acquisition of suppressive function by activated human CD4+ CD25− T cells is associated with the expression of CTLA-4 not Foxp3. J Immunol. 2008;181:1683–91. doi: 10.4049/jimmunol.181.3.1683. [DOI] [PMC free article] [PubMed] [Google Scholar]
- 13.Mozos A, Garrido M, Carreras J, et al. Redistribution of Foxp3-positive regulatory T cells from lymphoid tissues to peripheral blood in HIV-infected patients. J Acquir Immune Defic Syndr. 2007;46:529–37. [PubMed] [Google Scholar]
- 14.Bandera A, Ferrario G, Saresella M, et al. CD4+ T cell depletion, immune activation and increased production of regulatory T cells in the thymus of HIV-infected individuals. PLoS ONE. 2010;5:e10788. doi: 10.1371/journal.pone.0010788. [DOI] [PMC free article] [PubMed] [Google Scholar]
- 15.Gudo ES, Bhatt NB, Bila DR, et al. Co-infection by human immunodeficiency virus type 1 (HIV-1) and human T cell leukemia virus type 1 (HTLV-1): does immune activation lead to a faster progression to AIDS? BMC Infect Dis. 2009;9:211–23. doi: 10.1186/1471-2334-9-211. [DOI] [PMC free article] [PubMed] [Google Scholar]
- 16.Leligdowicz A, Feldmann J, Jaye A, et al. Direct relationship between virus load and systemic immune activation in HIV-2 infection. J Infect Dis. 2010;201:114–22. doi: 10.1086/648733. [DOI] [PubMed] [Google Scholar]
- 17.Lim HW, Hillsamer P, Banham AH, Kim CH. Cutting edge: direct suppression of B cells by CD4+ CD25+ regulatory T cells. J Immunol. 2005;175:4180–3. doi: 10.4049/jimmunol.175.7.4180. [DOI] [PubMed] [Google Scholar]
- 18.Moir S, Fauci AS. Pathogenic mechanisms of B-lymphocyte dysfunction in HIV disease. J Allergy Clin Immunol. 2008;122:12–19. doi: 10.1016/j.jaci.2008.04.034. [DOI] [PMC free article] [PubMed] [Google Scholar]
- 19.De Milito A, Mörch C, Sönnerborg A, Chiodi F. Loss of memory (CD27) B lymphocytes in HIV-1 infection. AIDS. 2001;15:957–64. doi: 10.1097/00002030-200105250-00003. [DOI] [PubMed] [Google Scholar]
- 20.Titanji K, Nilsson A, Mörch C, et al. Low frequency of plasma nerve-growth factor detection is associated with death of memory B lymphocytes in HIV-1 infection. Clin Exp Immunol. 2003;132:297–303. doi: 10.1046/j.1365-2249.2003.02145.x. [DOI] [PMC free article] [PubMed] [Google Scholar]
- 21.Zandman-Goddard G, Shoenfeld Y. HIV and autoimmunity. Autoimmun Rev. 2002;1:329–37. doi: 10.1016/s1568-9972(02)00086-1. [DOI] [PubMed] [Google Scholar]
- 22.Rodriguez C, Stiehm ER, Plaeger-Marshall S. Peripheral B-cell activation and immaturity in HIV-infected children. Ann NY Acad Sci. 1993;693:291–4. doi: 10.1111/j.1749-6632.1993.tb26287.x. [DOI] [PubMed] [Google Scholar]
- 23.Jarvis JN, Taylor H, Iobidze M, Dejonge J, Chang S, Cohen F. Rheumatoid factor expression and complement activation in children congenitally infected with human immunodeficiency virus. Clin Immunol Immunopathol. 1993;67:50–4. doi: 10.1006/clin.1993.1044. [DOI] [PubMed] [Google Scholar]
- 24.González CM, López-Longo FJ, Samson J, et al. Antiribonucleoprotein antibodies in children with HIV infection: a comparative study with childhood-onset systemic lupus erythematosus. AIDS Patient Care STDS. 1998;12:21–8. doi: 10.1089/apc.1998.12.21. [DOI] [PubMed] [Google Scholar]
- 25.Stricker K, Knipping E, Böhler T, Benner A, Krammer PH, Debatin KM. Anti-CD95 (APO-1/Fas) autoantibodies and T cell depletion in human immunodeficiency virus type 1 (HIV-1)-infected children. Cell Death Differ. 1998;5:222–30. doi: 10.1038/sj.cdd.4400332. [DOI] [PubMed] [Google Scholar]
- 26.Eley BS, Hughes J, Potgieter S, Keraan M, Burgess J, Hussey GD. Immunological manifestations of HIV-infected children. Ann Trop Paediatr. 1999;19:3–7. doi: 10.1080/02724939992572. [DOI] [PubMed] [Google Scholar]
- 27.Shah I, Chudgar P. Antiphospholipid syndrome in a human immunodeficiency virus 1-infected child. Pediatr Infect Dis J. 2006;25:185–6. doi: 10.1097/01.inf.0000200140.04406.d0. [DOI] [PubMed] [Google Scholar]
- 28.Legrand FA, Nixon DF, Loo CP, et al. Strong HIV-1-specific T cell responses in HIV-1-exposed uninfected infants and neonates revealed after regulatory T cell removal. PLoS ONE. 2006;1:e102. doi: 10.1371/journal.pone.0000102. [DOI] [PMC free article] [PubMed] [Google Scholar]
- 29.Prendergast A, O'Callaghan M, Menson E, et al. Factors influencing T cell activation and programmed death 1 expression in HIV-infected children. AIDS Res Hum Retroviruses. 2011 doi: 10.1089/AID.2011.0113. [Epub ahead of print] [DOI] [PubMed] [Google Scholar]
- 30.CDC Revised classification system for human immunodeficiency virus infection in children less than 13 years of age. Morb Mortal Wkly Rep. 1994;43:1–10. [PubMed] [Google Scholar]
- 31.Yagi H, Nomura T, Nakamura K, et al. Crucial role of Foxp3 in the development and function of human CD25+CD4+ regulatory T cells. Int Immunol. 2004;16:1643–56. doi: 10.1093/intimm/dxh165. [DOI] [PubMed] [Google Scholar]
- 32.Xing S, Fu J, Zhang Z, et al. Increased turnover of Foxp3high regulatory T cells is associated with hyperactivation and disease progression of chronic HIV-1 infection. J Acquir Immune Defic Syndr. 2010;54:455–62. doi: 10.1097/QAI.0b013e3181e453b9. [DOI] [PubMed] [Google Scholar]
- 33.Gaardbo JC, Nielsen SD, Vedel SJ, et al. Regulatory T cells in human immunodeficiency virus-infected patients are elevated and independent of immunological and virological status, as well as initiation of highly active anti-retroviral therapy. Clin Exp Immunol. 2008;154:80–6. doi: 10.1111/j.1365-2249.2008.03725.x. [DOI] [PMC free article] [PubMed] [Google Scholar]
- 34.Montes M, Lewis DE, Sanchez C, et al. Foxp3+ regulatory T cells in antiretroviral-naive HIV patients. AIDS. 2006;20:1669–71. doi: 10.1097/01.aids.0000238415.98194.38. [DOI] [PubMed] [Google Scholar]
- 35.Stevenson M. HIV-1 pathogenesis. Nat Med. 2003;9:853–60. doi: 10.1038/nm0703-853. [DOI] [PubMed] [Google Scholar]
- 36.Appay V, Sauce D. Immune activation and inflammation in HIV-1 infection: causes and consequences. J Pathol. 2008;214:231–41. doi: 10.1002/path.2276. [DOI] [PubMed] [Google Scholar]
- 37.Avcin T, Toplak N. Antiphospholipid antibodies in response to infection. Curr Rheumatol Rep. 2007;9:212–18. doi: 10.1007/s11926-007-0034-x. [DOI] [PubMed] [Google Scholar]
- 38.Metlas R, Srdic T, Veljkovic V. Anti-IgG antibodies from sera of healthy individuals neutralize HIV-1 primary isolates. Curr HIV Res. 2007;5:261–5. doi: 10.2174/157016207780077093. [DOI] [PubMed] [Google Scholar]
- 39.Haynes BF, Nicely NI, Alam SM. HIV-1 autoreactive antibodies: are they good or bad for HIV-1 prevention? Nat Struct Mol Biol. 2010;17:543–5. doi: 10.1038/nsmb0510-543. [DOI] [PMC free article] [PubMed] [Google Scholar]
- 40.Hernandez GT, Critchfield JM, Rodriguez RA. Interpretation of serologic tests in an HIV-infected patient with kidney disease. Nat Clin Pract Nephrol. 2006;2:708–12. doi: 10.1038/ncpneph0324. [DOI] [PubMed] [Google Scholar]
- 41.Shoenfeld Y, Blank M, Abu-Shakra M, et al. The mosaic of autoimmunity: prediction, autoantibodies, and therapy in autoimmune diseases. Isr Med Assoc J. 2008;10:13–19. [PubMed] [Google Scholar]
- 42.Zelenay S, Lopes-Carvalho T, Caramalho J, Moraes-Fontes MF, Rebelo M, Demengeot J. Foxp3+ CD25− CD4 T cells constitute a reservoir of committed regulatory cells that regain CD25 expression upon homeostatic expansion. Proc Natl Acad Sci USA. 2005;102:4091–6. doi: 10.1073/pnas.0408679102. [DOI] [PMC free article] [PubMed] [Google Scholar]
- 43.Horwitz DA. Identity of mysterious CD4+CD25–Foxp3+ cells in SLE. Arthritis Res Ther. 2010;12:101–3. doi: 10.1186/ar2894. [DOI] [PMC free article] [PubMed] [Google Scholar]
- 44.Nishioka T, Shimizu J, Iida R, Yamazaki S, Sakaguchi S. CD4+CD25+Foxp3+ T cells and CD4+CD25–Foxp3+ T cells in aged mice. J Immunol. 2006;176:6586–93. doi: 10.4049/jimmunol.176.11.6586. [DOI] [PubMed] [Google Scholar]
- 45.Sodora D, Silvestri G. Immune activation and AIDS pathogenesis. AIDS. 2008;22:439–46. doi: 10.1097/QAD.0b013e3282f2dbe7. [DOI] [PubMed] [Google Scholar]
- 46.Eggena MP, Barugahare B, Jones N, et al. Depletion of regulatory T cells in HIV infection is associated with immune activation. J Immunol. 2005;174:4407–14. doi: 10.4049/jimmunol.174.7.4407. [DOI] [PubMed] [Google Scholar]
- 47.Suen JL, Li HT, Jong YJ, Chiang BL, Yen JH. Altered homeostasis of CD4(+)Foxp3(+) regulatory T-cell subpopulations in systemic lupus erythematosus. Immunology. 2009;127:196–205. doi: 10.1111/j.1365-2567.2008.02937.x. [DOI] [PMC free article] [PubMed] [Google Scholar]
- 48.Yang J, Chu Y, Yang X, et al. Th17 and natural Treg cell population dynamics in systemic lupus erythematosus. Arthritis Rheum. 2009;60:1472–83. doi: 10.1002/art.24499. [DOI] [PubMed] [Google Scholar]
- 49.Bonelli M, Savitskaya A, Steiner CW, Rath E, Smolen JS, Scheinecker C. Phenotypic and functional analysis of CD4+ CD25–Foxp3+ T cells in patients with systemic lupus erythematosus. J Immunol. 2009;182:1689–95. doi: 10.4049/jimmunol.182.3.1689. [DOI] [PubMed] [Google Scholar]
- 50.Moes N, Rieux-Laucat F, Begue B, et al. Reduced Expression of Foxp3 and regulatory T-cell function in severe forms of early-onset autoimmune enteropathy. Gastroenterology. 2010;139:770–8. doi: 10.1053/j.gastro.2010.06.006. [DOI] [PubMed] [Google Scholar]
- 51.Fazekas de St Groth B, Landay AL. Regulatory T cells in HIV infection: pathogenic or protective participants in the immune response? AIDS. 2008;22:671–83. doi: 10.1097/QAD.0b013e3282f466da. [DOI] [PubMed] [Google Scholar]
- 52.De Milito A, Nilsson A, Titanji K, et al. Mechanisms of hypergammaglobulinemia and impaired antigen-specific humoral immunity in HIV-1 infection. Blood. 2004;103:2180–6. doi: 10.1182/blood-2003-07-2375. [DOI] [PubMed] [Google Scholar]
- 53.Titanji K, De Milito A, Cagigi A, et al. Loss of memory B cells impairs maintenance of long-term serologic memory during HIV-1 infection. Blood. 2006;108:1580–7. doi: 10.1182/blood-2005-11-013383. [DOI] [PubMed] [Google Scholar]
- 54.Sampalo A, López-Gómez M, Jiménez-Alonso J, Ortiz F, Samaniego F, Garrido F. CD5+ B lymphocytes in HIV infection: relationship to immunological progression of disease. Clin Immunol Immunopathol. 1993;66:260–8. doi: 10.1006/clin.1993.1034. [DOI] [PubMed] [Google Scholar]
- 55.Grünewald T, Burmester GR, Schüler-Maué W, Hiepe F, Buttgereit F. Anti-phospholipid antibodies and CD5+ B cells in HIV infection. Clin Exp Immunol. 1999;115:464–71. doi: 10.1046/j.1365-2249.1999.00828.x. [DOI] [PMC free article] [PubMed] [Google Scholar]
- 56.Redgrave BE, Stone SF, French MA, Krueger R, James IR, Price P. The effect of combination antiretroviral therapy on CD5 B-cells, B-cell activation and hypergammaglobulinaemia in HIV-1-infected patients. HIV Med. 2005;6:307–12. doi: 10.1111/j.1468-1293.2005.00312.x. [DOI] [PubMed] [Google Scholar]
- 57.Herbert W, Virgin E, Wherry J, Ahmed R. Redefining chronic viral infection. Cell. 2009;138:30–50. doi: 10.1016/j.cell.2009.06.036. [DOI] [PubMed] [Google Scholar]
- 58.Gaddi E, Laucella S, Balbaryski J, et al. Prognostic value of soluble intercellular adhesion molecule-1 (s-ICAM-1) in HIV-infected children. Scand J Immunol. 2000;52:628–33. doi: 10.1046/j.1365-3083.2000.00820.x. [DOI] [PubMed] [Google Scholar]
- 59.Gaddi E, Quiroz H, Balbaryski J, et al. L-selectin expression on T lymphocytes and neutrophils in HIV infected children. Medicina (Buenos Aires) 2005;65:131–7. [PubMed] [Google Scholar]
Associated Data
This section collects any data citations, data availability statements, or supplementary materials included in this article.