

Abstract
Rifapentine (RPT) is an antituberculosis drug that may shorten treatment duration when substituted for rifampin (RIF). The maximal tolerated daily dose of RPT and its potential for cytochrome 3A4 induction and autoinduction at clinically relevant doses are unknown. In this phase I, dose-escalation study among healthy volunteers, daily doses as high as a prespecified maximum of 20 mg/kg/day were well tolerated. Steady-state RPT concentrations increased with dose from 5 to 15 mg/kg, but area under the plasma concentration–time curve (AUC0–24) and maximum concentration (Cmax) were similar in the 15- and 20-mg/kg cohorts. Although RPT pharmacokinetics (PK) appeared to be time-dependent, accumulation occurred with daily dosing. The mean AUC0–12 of oral midazolam (MDZ), a cytochrome 3A (CYP3A) probe drug, was reduced by 93% with the coadministration of RPT and by 74% with the coadministration of RIF (P < 0.01). Changes in the oral clearance of MDZ did not vary by RPT dose. In conclusion, RPT was tolerated at doses as high as 20 mg/kg/day, its PK were less than dose-proportional, and its CYP3A induction was robust.
Tuberculosis (TB) remains a major global health problem. In 2009, there were an estimated 9.4 million new cases and 1.7 million deaths from TB.1 Although effective treatment is available, standard “short course” therapy with isoniazid, rifampin (RIF), pyrazinamide, and ethambutol must be given for 6 months to reliably prevent relapse. Rifapentine (RPT) is a rifamycin antibiotic with a longer half-life and a lower mean inhibitory concentration against Mycobacterium tuberculosis than RIF (Supplementary Figure S3).2 RPT is being investigated as a potent TB drug that may allow reduction in the duration of TB treatment required for cure.
In a well-established mouse model of TB, bactericidal and sterilizing activity of RPT was shown to increase with increasing dose and frequency of administration. Therapeutic regimens that include RPT can cure TB in mice in 3 months or less when at least 10 mg/kg are given daily in combination with pyrazinamide and either moxifloxacin or isoniazid.3,4 Recent experiments in immunodeficient mice have shown that, at the same mg/kg dose, RPT produces negative lung cultures more quickly and protects better against the emergence of isoniazid resistance as compared with RIF.5 Therefore, RPT holds promise as a drug agent that can shorten treatment duration in an exposure-dependent manner. In humans, the optimal RPT dose and regimen are unknown.
RPT is approved by the US Food and Drug Administration at 600 mg orally twice weekly during the intensive phase of TB treatment, followed by 600 mg once weekly during the continuation phase. Clinical trials using this regimen have shown unacceptably high relapse rates in some patient populations, and the use of higher and/or more frequent doses is probably necessary to achieve acceptable cure rates.6–8 Because RPT was initially developed and licensed as an intermittently dosed TB drug, the maximally tolerated daily dose has not been determined, and the dose-linearity of RPT concentrations with daily dosing has not been established. Furthermore, the impact of increasing RPT doses on induction of cytochrome P450 metabolizing enzyme activity has not been assessed. Like RIF, RPT induces cytochrome P450 enzyme activity and may also induce its own metabolism or clearance.9–12
We conducted a phase I, open-label, dose-escalation trial of RPT in healthy volunteers to evaluate the maximal tolerated daily dose of RPT (up to a predened maximum of 20 mg/kg); the pharmacokinetics (PK) of higher daily doses of RPT; the relationship between dose and autoinduction of RPT metabolism or clearance; and the association between RPT dose and induction of cytochrome P450 3A (CYP3A) metabolizing enzymes. We used oral midazolam (MDZ) as a probe drug and RIF as a comparator drug.13–15
RESULTS
Study population
Of 37 enrolled participants, 33 received at least one dose of RPT or RIF (Figure 1). In this sample, 7 (21%) were women, the median age (IQR) was 45 (38, 52) years, the median weight was 78 (69, 85) kg, and the median body mass index was 26 (24, 29) kg/m2; the majority were African American (22 (69%)) or white (10 (31%)). A total of 29 participants completed both inpatient PK sampling visits, and 28 were included in the PK analysis (one was excluded from PK analyses for apparent nonadherence to the regimen). Median RPT doses by cohort were 450, 750, 1,200, and 1,650 mg orally, once per day.
Figure 1.

Participant flow in Tuberculosis Trials Consortium Study 29B. PK, pharmacokinetics.
Safety and maximal tolerated daily dose of RPT
Clinical symptoms related to the study rifamycins were rarely reported, and there were no grade 2 or higher clinical adverse events (Table 1). Grade 2 or higher laboratory toxicities occurred in 9 (27%) of the participants. Dose-limiting toxicities were observed in three subjects, one each in the RIF, RPT 10 mg/kg, and RPT 15 mg/kg cohorts. A 48-year-old African-American man developed grade 3 neutropenia after nine RIF doses. He had no fever or associated symptoms, and the neutropenia resolved with discontinuation of the study drug. A 36-year-old African-American man in the RPT 10 mg/kg cohort developed grade 3 serum liver transaminase elevation after seven RPT doses. He was asymptomatic and had no elevations in total bilirubin; in this participant, transaminase values declined with discontinuation of RPT. A 59-year-old white woman in the RPT 15 mg/kg cohort developed grade 3 lymphopenia one day after completion of all study drug doses. She had associated fever, dizziness, and grade 1 elevations in liver function enzymes. These symptoms and laboratory abnormalities resolved without any specific intervention. Because there were not two or more dose-limiting toxicities in any dosing cohort, dose escalation proceeded to the predefined maximum dose of 20 mg/kg. There was no specific toxicity that increased in frequency or severity with increases in RPT dose.
Table 1.
Clinical and laboratory adverse events among participants who took at least one study dose of rifamycin, by cohort
| All (n = 33) | 5 mg/kg RPT (n = 6) | 10 mg/kg RPT (n = 6) | 15 mg/kg RPT (n = 7) | 20 mg/kg RPT (n = 6) | 10 mg/kg RIF (n = 8) | |
|---|---|---|---|---|---|---|
| Clinical events (number with event (%))—grade 1a | ||||||
| Gastrointestinal | ||||||
| Gas | 2 (6%) | 2 (33%) | 0 | 0 | 0 | 0 |
| Constipation | 3 (9%) | 0 | 1 (17%) | 2 (29%) | 0 | 0 |
| Vomiting | 2 (6%) | 0 | 0 | 1 (14%) | 0 | 1 (13%) |
| Central nervous system | ||||||
| Headache | 2 (6%) | 0 | 0 | 0 | 1 (17%) | 1 (13%) |
| Constitutional symptoms | ||||||
| Fever | 1 (3%) | 0 | 0 | 1 (14%) | 0 | 0 |
| Dizziness | 2 (6%) | 1 (17%) | 0 | 1 (14%) | 0 | 0 |
| Laboratory events (number with event (%))—grade 2 or higher | ||||||
| Neutropenia | 3 (9%) | 0 | 1 (17%) | 0 | 0 | 2 (25%) |
| Hyperbilirubinemia | 2 (6%) | 0 | 0 | 1 (14%) | 1 (17%) | 0 |
| Lymphopenia | 2 (6%) | 0 | 0 | 2 (28%) | 0 | 0 |
| Hyperglycemia | 1 (3%) | 0 | 0 | 0 | 0 | 1 (13%) |
| Hypertransaminasemia | 1 (3%) | 0 | 1 (17%) | 0 | 0 | 0 |
| Leukopenia | 1 (3%) | 0 | 0 | 0 | 0 | 1 (13%) |
RIF, rifampin; RPT, rifapentine.
There were no grade 2, 3, or 4 clinical adverse events.
Single-dose and multiple-dose PK of rifamycins and their metabolites, by dose
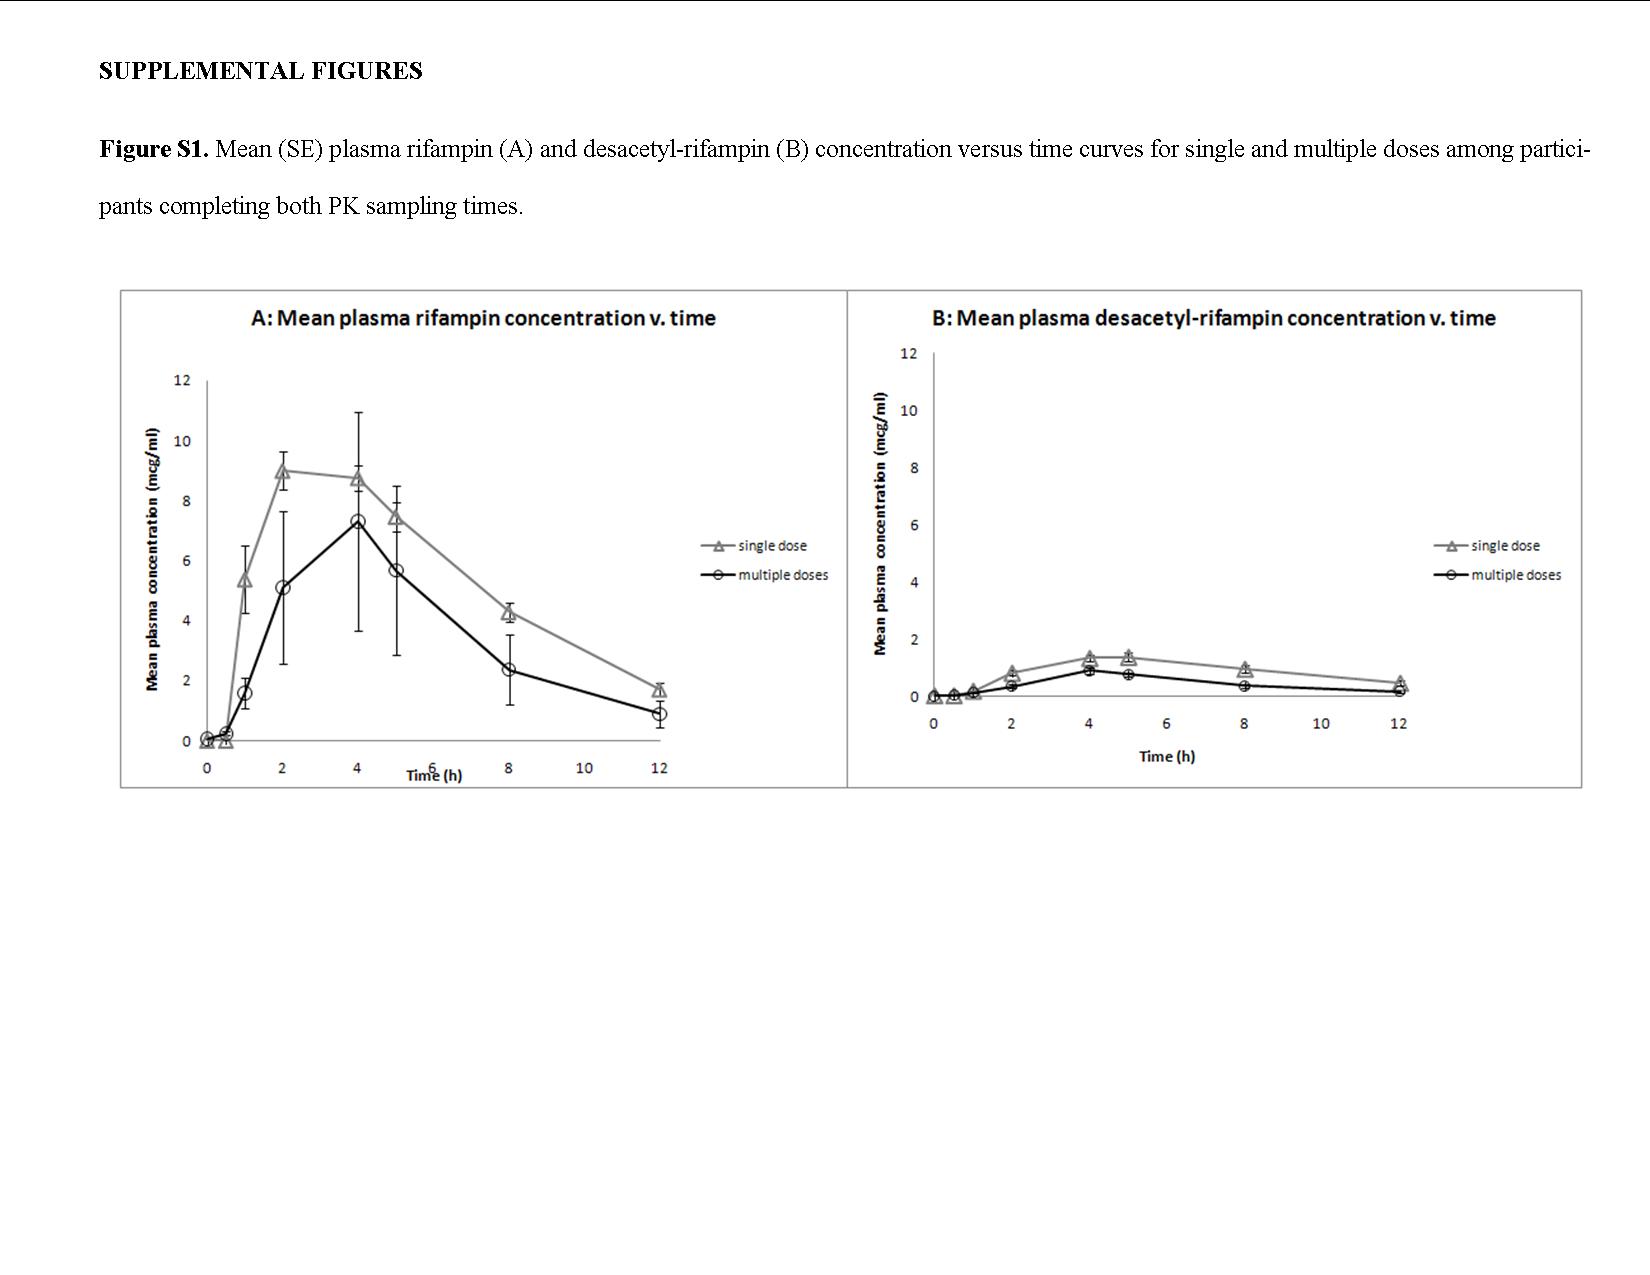
Figure 2 shows mean RPT plasma concentration–time curves after a single dose and after 14 consecutive daily doses of RPT, by dosing cohort. The median RPT single-dose maximum concentration (Cmax) and area under the plasma concentration–time curve (AUC0–24) increased nearly dose-proportionally from 5 to 15 mg/kg but were similar in the 15 and 20 mg/kg cohorts (Table 2). Multiple-dose RPT exposures increased less than dose-proportionally with two-, three-, and fourfold increases in dose resulting in only 1.38-, 2.29-, and 2.17-fold increases in Cmax and 1.51-, 2.57-, and 2.22-fold increases in AUC0–24, respectively. At the maximum dose tested (20 mg/kg), the median steady state Cmax, AUC0–24, and half-life (T1/2) were 34.1 μg/ml, 483 μg·h/ml, and 16 h, respectively. Median single-dose Cmax and AUC0–24 of RPT’s desacetyl metabolite (desRPT) increased nearly dose-proportionally with increases in RPT dose from 5 to 15 mg/kg but were similar in the 15 and 20 mg/kg cohorts (Table 2). With multiple dosing, however, desRPT AUC0–24 increased 1.31-fold, 3.21-fold, and 2.15-fold with 2-, 3-, and 4-fold increases in RPT dose, respectively, and the ratios were similar for Cmax. There were no significant associations between RPT or desRPT PK parameters and observed toxicities. Median steady-state RIF AUC0–12, Cmax, and T1/2 were 45.2 μg·h/ml, 7.5 μg/ml, and 2.4 h, similar to values seen in other studies (see Supplementary Table S1 and Supplementary Figure S1 online).16
Figure 2.

Single-dose and multiple-dose rifapentine (RPT) and desacetylrifapentine (desRPT) concentrations. (a) Mean plasma RPT concentrations (μg/ml) vs. time after single doses of 5 mg/kg (open triangles), 10 mg/kg (open circles), 15 mg/kg (filled circles), or 20 mg/kg (filled squares). (b) Mean plasma RPT concentrations vs. time after 14 daily doses of 5 mg/kg (open triangles), 10 mg/kg (open circles), 15 mg/kg (filled circles), or 20 mg/kg (filled squares). (c) Mean plasma desRPT concentrations vs. time after single doses of 5 mg/kg (open triangles), 10 mg/kg (open circles), 15 mg/kg (filled circles), or 20 mg/kg (filled squares) of RPT. (d) Mean plasma desRPT concentrations vs. time after 14 daily doses of 5 mg/kg (open triangles), 10 mg/kg (open circles), 15 mg/kg (filled circles), or 20 mg/kg (filled squares) of RPT. The values shown represent arithmetic means with SE bars.
Table 2.
Median (IQR) pharmacokinetic parameters of rifapentine and desacetylrifapentine after a single dose or after 14 consecutive daily doses of 5, 10, 15, or 20 mg/kg of rifapentine, by dosing cohort
| Parameter | 5 mg/kg Rifapentine (n = 5) | 10 mg/kg Rifapentine (n = 5) | 15 mg/kg Rifapentine (n = 6) | 20 mg/kg Rifapentine (n = 6) | ||||
|---|---|---|---|---|---|---|---|---|
| Single dose | Multiple doses | Single dose | Multiple doses | Single dose | Multiple doses | Single dose | Multiple doses | |
| Rifapentine | ||||||||
| Cmax (μg/ml) | 9.6 (8.0–10.3) | 15.7 (13.0–17.7) | 17.1 (13.8–19.0) | 21.7 (21.3–22.2) | 25.6 (19.2–27.3) | 35.9 (25.1–39.4) | 25.0 (21.6–37.3) | 34.1 (29.7–42.9) |
| Tmax (h) | 4.0 (4.0–4.1) | 4.1 (4.0–4.2) | 5.0 (4.0–5.0) | 5.0 (4.0–5.0) | 4.5 (2.0–5.0) | 4.2 (4.0–5.0) | 4.0 (4.0–4.0) | 4.0 (4.0–4.2) |
| AUC0–24 (μg·h/ml) | 128 (101–157) | 218 (142–251) | 242 (231–260) | 330 (284–340) | 363 (310–430) | 560 (401–735) | 403 (357–452) | 483 (414–546) |
| AUCinf (μg·h/ml) | 214 (187–315) | 428 (375–435) | 826 (750–1,012) | 1,187 (591–1,216) | ||||
| T1/2 (h) | 20.4 (17.2–22.9) | 15.4 (10.9–19.0) | 16.5 (15.3–18.1) | 13.7 (13.4–14.4) | 21.3 (19.9–35.2) | 23.3 (18.6–25.1) | 25.9 (21.4–38.3) | 16.0 (14.0–16.9) |
| CL/F (mg/h/kg) | 23.4 (15.9–26.8) | 23.0 (19.9–35.2) | 23.4 (23.0–26.6) | 30.3 (29.4–35.2) | 18.2 (14.8–20.0) | 22.3 (20.1–37.4) | 16.9 (16.5–33.9) | 36.8 (35.3–48.3) |
| V/F (ml/kg) | 582 (525–622) | 547 (546–556) | 589 (548–611) | 581 (572–636) | 751 (614–753) | 847 (643–980) | 868 (750–937) | 782 (519–1,097) |
| Desacetylrifapentine | ||||||||
| Cmax (μg/ml) | 2.8 (1.8–3.0) | 8.7 (4.9–9.4) | 4.7 (4.4–4.7) | 10.5 (9.5–12.2) | 12.1 (7.2–13.5) | 23.6 (15.1–40.1) | 10.6 (8.1–13.8) | 19.9 (14.4–29.8) |
| Tmax (h) | 24.0 (12.0–24.0) | 4.1 (4.0–4.2) | 24.0 (12.1–24.0) | 5.7 (5.0–8.0) | 24.0 (24.0–24.0) | 4.5 (4.0–8.1) | 24.0 (12.0–24.1) | 5.0 (4.2–8.0) |
| AUC0–24 (μg·h/ml) | 49.2 (35.5–49.7) | 148 (70.2–148) | 84.3 (80.3–87.5) | 194 (178–202) | 153 (130–207) | 476 (264–890) | 182 (138–207) | 318 (223–461) |
AUC, area under the plasma concentration–time curve; CL/F, oral clearance; Cmax, maximum concentration; Tmax, time to Cmax; T1/2, half-life; VIF, apparent volume of distribution.
MDZ concentrations when coadministered with RIF or daily RPT
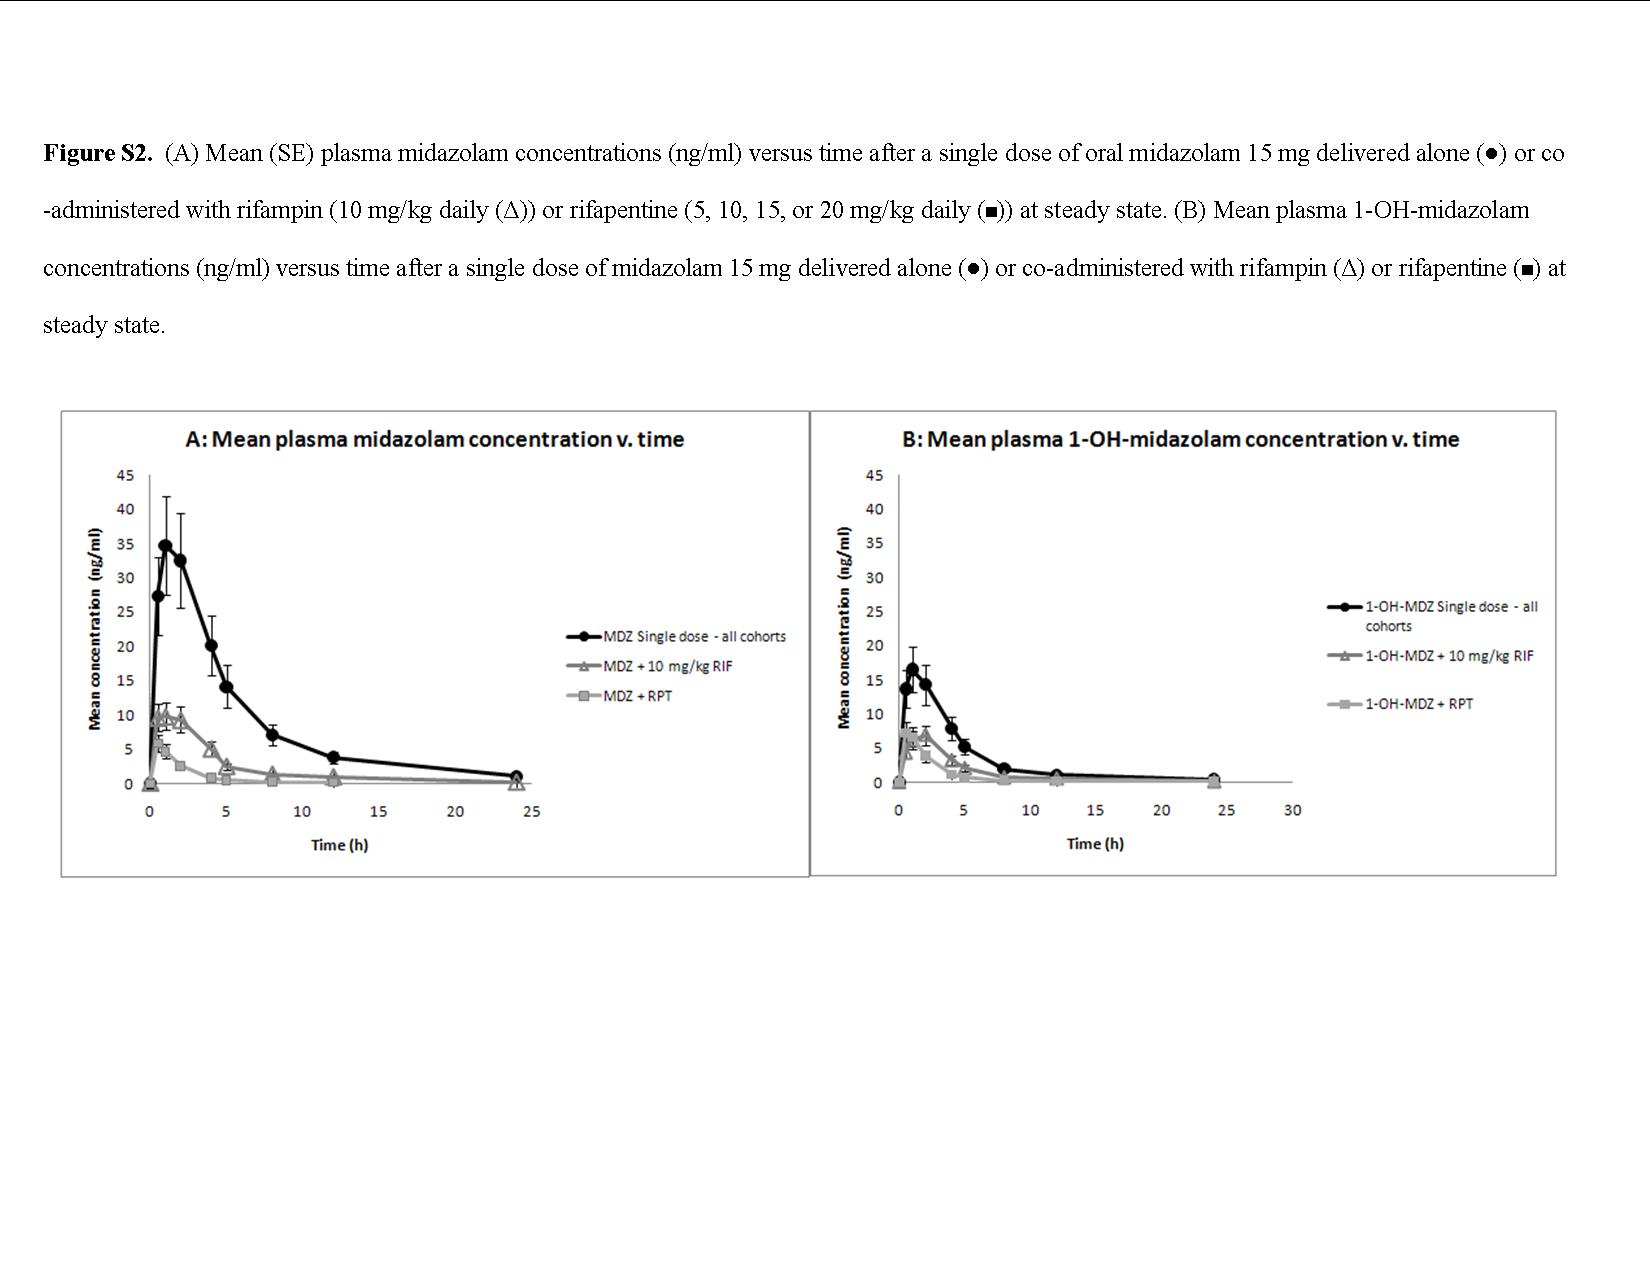
The PK of MDZ and its 1-OH-MDZ metabolite when MDZ was administered alone and when it was coadministered with either RIF or RPT are presented in Figure 3 (see also Supplementary Figure S2) and summarized in Table 3. The mean AUC0–12 of MDZ was diminished by 75% when coadministered with RIF and by 92, 92, 93, and 91%, respectively, when coadministered with multiple-dose RPT dosed at 5, 10, 15, or 20 mg/kg. The mean Cmax of MDZ was diminished by 74% by coadministration with RIF and by 82, 84, 84, and 87%, respectively, by coadministration with RPT doses of 5, 10, 15, and 20 mg/kg. MDZ oral clearance increased by 1,750% in the combined RPT arms and by 925% in the RIF arm (Student’s t-test P = 0.05). In all the cohorts, the concentrations of the metabolite 1-OH-MDZ were reduced when MDZ was coadministered with rifamycins.
Figure 3.
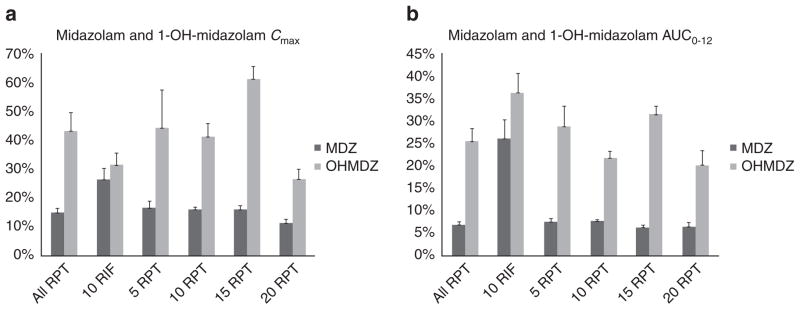
Mean (SD) values of (a) Cmax and (b) AUC0–12 of midazolam (MDZ) and 1-OH-midazolam (OH-MDZ) when oral MDZ (15 mg) is coadministered with steady-state rifampin (RIF) or rifapentine (RPT), expressed as percentages of the respective concentrations when MDZ (15 mg) is administered alone. AUC, area under the concentration–time curve; Cmax, maximum concentration.
Table 3.
Median (IQR) midazolam and 1-OH-midazolam pharmacokinetic parameters alone and together with rifampin or rifapentine, by dosing cohort
| 10 mg/kg Rifampin (n = 6) | 5 mg/kg Rifapentine (n = 5) | 10 mg/kg Rifapentine (n = 5) | 15 mg/kg Rifapentine (n = 6) | 20 mg/kg Rifapentine (n = 6) | ||||||
|---|---|---|---|---|---|---|---|---|---|---|
| Parameter | Alone | With RIF | Alone | With RPT | Alone | With RPT | Alone | With RPT | Alone | With RPT |
| Midazolam | ||||||||||
| Cmax (ng/ml) | 40.8 (34.8–48.7) | 9.8 (7.2–13.6) | 46.9 (29.1–56.3) | 8.5 (3.8–11.1) | 21.1 (20.7–25.6) | 4.2 (4.1–4.9) | 45.7 (35.6–52.7) | 6.2 (5.1–8.8) | 46.8 (28.9–60.0) | 5.0 (4.1–5.5) |
| AUC0–12 (ng·h/ml) | 151 (116–197) | 26.9 (10.0–55.8) | 150 (108–238) | 14.2 (7.34–20.1) | 114 (111–128) | 10.2 (10.0–10.4) | 204 (158–255) | 14.0 (12.6–15.2) | 173 (118–270) | 11.7 (8.8–14.6) |
| T1/2 (h) | 4.1 (3.5–5.7) | 1.7 (1.1–4.4) | 6.6 (3.6–6.7) | 1.9 (1.4–2.6) | 3.7 (2.7–3.8) | 2.0 (1.6–2.0) | 5.2 (3.8–6.4) | 2.3 (1.2–2.8) | 4.9 (4.0–6.0) | 2.4 (2.0–2.9) |
| CL/F (mg/h/kg) | 93.3 (70.1–125) | 560 (243–1,503) | 86.1 (50.1–129) | 1,051 (732–2,025) | 112 (105–125) | 1,436 (1,433–1,489) | 61.5 (44.2–87.8) | 1,038 (969–1,189) | 83.9 (44.3–109) | 1,249 (998–1,528) |
| V/F (ml/kg) | 501 (381–596) | 1,289 (795–2,155) | 565 (475–668) | 2,849 (2,708–4,125) | 578 (493–660) | 4,265 (4,144–6,658) | 443 (381–477) | 3,065 (2,814–3,471) | 496 (352–1,024) | 3,749 (3,322–4,164) |
| 1-OH-Midazolam | ||||||||||
| Cmax (ng/ml) | 20.3 (13.8–23.4) | 7.1 (2.7–12.3) | 12.4 (7.2–17.8) | 6.2 (5.8–9.8) | 13.7 (11.5–18.3) | 4.9 (2.9–9.1) | 20.1 (14.5–23.0) | 9.9 (7.4–12.5) | 18.6 (10.7–23.2) | 4.8 (3.8–5.9) |
| Tmax (h) | 1.1 (1.0–1.9) | 2.0 (1.0–2.0) | 2.0 (1.0–2.0) | 1.0 (0.5–1.1) | 1.0 (1.0–2.1) | 1.0 (0.6–2.0) | 1.0 (0.5–2.0) | 0.5 (0.5–0.5) | 1.5 (0.5–2.0) | 1.0 (1.0–1.0) |
| AUC0–12 (ng·h/ml) | 64.7 (54.9–88.2) | 30.1 (9.7–38.0) | 60.2 (34.7–70.1) | 15.3 (12.7–16.3) | 62.2 (52.4–92.5) | 13.0 (10.7–16.7) | 61.9 (60.3–76.4) | 22.2 (18.5–25.8) | 63.6 (43.5–84.3) | 12.7 (9.6–16.1) |
AUC, area under the plasma concentration–time curve; CL/F, oral clearance; Cmax, maximum concentration; RIF, rifampin; RPT, rifapentine; Tmax, time to Cmax; T1/2, half-life; VIF, apparent volume of distribution.
Autoinduction by RPT and RIF
After repeated once-a-day dosing, the mean (coefficient of variation (%CV)) accumulation index (Rac) values were 1.52 (29), 1.40 (29), 1.68 (42), and 1.27 (20), respectively, for the RPT 5, 10, 15, and 20 mg/kg cohorts. The mean (%CV) AUC0–24 values at steady state, divided by the AUC0–inf values after a single dose (AUC0–24hss/AUC0–infsd) were 0.84 (37), 0.86 (33), 0.82 (40), and 0.56 (39), respectively. In the combined cohort, the mean (%CV) estimated AUC0–24hss/AUC0–infsd was 0.76 (38). This was significantly different from 1 (P = 0.001), suggesting that the PK of RPT is time dependent. With multiple dosing, T1/2 decreased (22.9 vs. 16.7 h, P = 0.01) and clearance increased (23.5 vs. 32.0 mg/h/kg, P = 0.02) as compared with single-dose values. By comparison, the mean (%CV) Rac for RIF was 0.65 (33), and the mean (%CV) AUC0–24hss/AUC0–infsd was 0.58 (36), which was significantly different from 1 (P = 0.001). Both RIF and desacetylrifampin AUC0–12 were lower after multiple doses than after a single dose (see Supplementary Figure S1 online).
DISCUSSION
In this dose-escalation study in healthy volunteers, the maximal tolerated daily dose of RPT was at least 20 mg/kg. The average dose administered in this cohort (1,650 mg daily) is the highest daily dose of RPT tested to date in humans and substantially higher than the Food and Drug Administration–approved dose of 600 mg twice weekly. The approved dose has been associated with increased risk of TB relapse among high-risk patients with TB and, in some populations, with relapse with acquired rifamycin monoresistance.6,8,17–19 The optimal RPT dose and schedule for treating TB in humans have not been established, but the mouse model suggests that RPT bactericidal and sterilizing activity increases virtually without plateau up to doses of 160 mg/kg and that daily dosing improves outcomes.3,5,12,20 The PK/PD parameters and targets necessary to achieve cure without relapse in humans are yet to be determined, but in vitro and in vivo PD studies suggest that the killing of the bacilli by rifamycins is concentration dependent.21 Taken together, the preclinical and clinical data suggest that the likelihood of RPT contributing to a treatment-shortening regimen would be highest if RPT is given at the highest dose consistent with acceptable safety. In this study, we found no specific toxicities that increased with increasing RPT dose. The safety profile of RPT appeared to be similar to that of RIF 10 mg/kg, which is a widely used rifamycin dose; however, the sample size was too small to allow for firm conclusions to be made about safety. The safety and PK data from this study support the evaluation of daily doses of RPT as high as 20 mg/kg in patients with TB. Safety can be assessed more fully among patients taking multidrug therapy of standard duration, and PK/PD correlates can be explored to optimize dosing for future pivotal studies.
From a PK perspective, we found that increases in RPT dosage resulted in less-than-dose-proportional increases in single-dose and multiple-dose Cmax. This suggests a decrease in bioavailability with increasing doses, especially at the highest doses. The mechanisms for this are not readily obvious but may include solubility and dissolution limits of multiple coadministered RPT tablets; saturability of transport across the gut wall; dose-dependent upregulation of hepatic or gut presystemic biotransformation or clearance (although this effect would have to occur even with a single dose); and sampling error.22 RIF, a close structural analog of RPT, is subject to a first-pass effect (presystemic biotransformation or clearance) that is saturated at a daily dose of 300–450 mg, resulting in higher-than-dose-proportional increases in concentrations at daily doses >450 mg.23 Our data suggest that this phenomenon does not extend to RPT, at least at the doses tested in this study. This may be of clinical concern if the treatment-shortening potential of RPT24 can be achieved only with exposures higher than those acheived by a dose of 15 mg/kg. A given mg/kg dose may result in lower RPT concentrations in patients with TB than in healthy volunteers, and therefore the dose at which maximum exposures will be achieved may be higher in patients with TB.25 A current clinical trial of escalating doses of RPT administered as part of multidrug treatment to patients with TB has a nested PK component. The results of the trial will be vital for addressing these questions (TBTC Study 29, ClinicalTrials.gov NCT00694629).
With repeated dosing, concentrations of RIF decreased, accompanied by shorter T1/2 and higher oral clearance (CL/F), demonstrating that RIF’s PK is time-dependent.26 As described previously, decreases in exposure levels of RIF and its metabolite at steady state probably result from increased gut and/or hepatic clearance with or without secondary biotransformation of the metabolite.23,27 In our study, there was evidence that the PK of RPT was time-dependent, with shorter T1/2 and higher CL/F at steady state as compared with after a single dose, and with AUC0–24hss/AUC0–infsd < 1. The mechanism for time-dependent PK (or autoinduction) has not been fully elucidated with respect to either RIF or RPT, but rifamycins are known to be strong inducers of pregnane X receptor, the activation of which leads to a cascade of downstream events, including upregulation of P450 enzymes, phase II enzymes, and transporters.28,29 Upregulation of metabolizing enzymes or transporters (including gut or hepatic P-glycoprotein efflux transporters or hepatic OATP1B1 influx transporters) could be responsible for the increases in clearance seen with multiple dosing.29,30 However, increased production of the enzymes that metabolize rifamycins is unlikely to be solely responsible for this because concentrations of the desRPT metabolite also decline with multiple dosing. Increased biliary clearance of desacetylrifampin occurs with multiple dosing, and this phenomenon may partially explain decreases in desRPT in response to increases in the dose of the parent drug from 15 to 20 mg/kg.31 Further work is needed to elucidate the mechanisms through which rifamycins “autoinduce” their metabolism and/or clearance. Of note, despite evidence of time-dependent oral clearance, accumulation of RPT occurred with daily dosing in contrast to RIF, a drug with a much shorter half-life.
Rifamycins are promiscuous, potent inducers of metabolizing enzymes and transporters. The use of a rifamycin-containing TB regimen complicates medical therapy of other diseases by reducing the concentrations of coadministered drugs, such as antiretrovirals used in treating HIV. Cytochrome P450 isoenzyme 3A is expressed in both enterocytes and hepatocytes and is involved in the metabolism of approximately half of all currently licensed drugs. MDZ is a benzodiazepine that is metabolized by hydroxylation to 1-OH-MDZ, a reaction mediated almost exclusively by CYP3A.32,33 MDZ is commonly used as a probe drug to determine whether a candidate drug affects CYP3A enzyme activity and therefore would be expected to affect drug clearance of a CYP3A substrate.34 When administered orally, MDZ can be used to evaluate the effect of a drug on overall CYP3A activity (presystemic plus systemic, comprising induction or inhibition of both gut and liver CYP3A).33 In this study, RIF at standard doses increased MDZ clearance eightfold, as has been seen in other studies;35,36 1-OH-MDZ concentrations were also reduced when MDZ was coadministered with RIF or RPT. Increases in MDZ CL/F were higher with coadministered RPT than with coadministered RIF. This was an unexpected finding because in vitro studies have shown RIF to be more potent than RPT in inducing CYP3A.10 However, this is not surprising, given that steady-state concentrations of RPT (Cmax: 22 μg/ml and area under the plasma concentration–time curve (AUC): 330 μg·h/ml) are much higher than for RIF (Cmax: 7.5 μg/ml and AUC: 45 μg·h/ml) for the same mg/kg dose. On a micromolar scale, the average concentrations of RIF and RPT at 10 mg/kg were 2.3 and 15.7 μmol/l, respectively. There was no evidence of a dose–response relationship between RPT dose and CYP3A induction at the doses studied. These data suggest that recommendations for dose adjustments resulting from drug–drug interaction studies involving RIF and companion drugs may not lend themselves to ready extrapolation to RPT. Careful testing of interactions involving RPT at clinically relevant doses and drugs metabolized by key cytochrome P450 enzymes will help guide dosing considerations in the future.
Our study had some limitations. First, the small sample size did not allow for full characterization of the safety and toxicity of RPT at different doses. However, there was no evidence of dose-dependent increases in specific toxicities that are common to the rifamycin class. To assess safety fully, these doses could be tested for a longer duration in patients with TB who are on multidrug therapy. Second, the single-dose sampling scheme may have prevented accurate estimation of the AUC0–inf, thereby affecting evaluation of the time-dependence of RPT PK. However, there was no evidence of a gamma elimination phase after 24 h in the multiple-dose data, and it is therefore likely that single-dose AUC0–inf estimates using 24-h data were reasonably well approximated. Third, the complex relationships between RPT dose and the PK of the parent drug and its metabolite, including time and dose dependencies and covariate effects are best assessed using nonlinear mixed-effects modeling. These secondary analyses will be reported separately. Finally, preclinical toxicology studies did not support the testing of doses higher than 20 mg/kg in humans; therefore, although the maximum tolerable dose was not established, it is at least 20 mg/kg/day.
In conclusion, RPT, an antituberculosis drug with potential treatment-shortening properties, was tolerated by healthy adults at doses as high as 20 mg/kg/day. Average drug exposures were similar at the two highest doses tested. In humans, RPT is at least as strong a CYP3A inducer as RIF when administered orally at the same mg/kg dose. These results provide safety and tolerability data to support clinical trials of RPT at high daily doses among patients with TB who are on multidrug regimens.
METHODS
Study population
The subjects were healthy adults 18–65 years of age, recruited in Baltimore, MD. The eligibility criteria included negative tests for HIV and hepatitis C virus antibodies, and normal liver function tests. Those with serum creatinine >1.5 mg/dl, albumin <3.5 g/dl, hemoglobin <12.0 g/dl (men) or <11.0 g/dl (women), neutrophil count <1,250/mm3, platelet count <125,000/mm3, or positive pregnancy test were excluded. All eligible subjects provided written informed consent. The study was approved by the institutional review boards of the Johns Hopkins University School of Medicine and the Centers for Disease Control and Prevention, and registered at http://www.clinicaltrials.gov (NCT01162486).
Experimental protocol
This was a phase I open-label, multiple-dose, pharmacokinetic dose-escalation study. Sequential cohorts of six subjects received oral RPT at 5, 10, 15, or 20 mg/kg daily. Another six subjects were enrolled in a 10 mg/kg RIF comparator arm. All the subjects received two single oral doses of MDZ 15 mg on study days 1 (administered alone) and 15 (coadministered with RPT or RIF) (Figure 4). The assigned dose of RPT or RIF was administered after a low-fat (865 kcal, 20% (20 g) fat, 5.1 g fiber) breakfast on study days 2–15. Plasma samples for PK analysis were collected after each MDZ dose and after the first and last doses of RPT or RIF. Samples for calculating trough concentrations were collected after 1, 5, 8, and 13 doses of RPT. RPT dosing started at 5 mg/kg and was escalated by 5 mg/kg for each successive cohort either up to 20 mg/kg or until the maximal tolerated dose, the dose at which dose-limiting toxicities (grade ≥3 drug-related adverse events occurred in at least two subjects) was reached. Adverse events were graded in accordance with the National Cancer Institute Common Toxicity Criteria, version 2.0. In this study, the prespecified maximum RPT daily dose was 20 mg/kg because the results of preclinical toxicology studies did not support the testing of higher doses.
Figure 4.
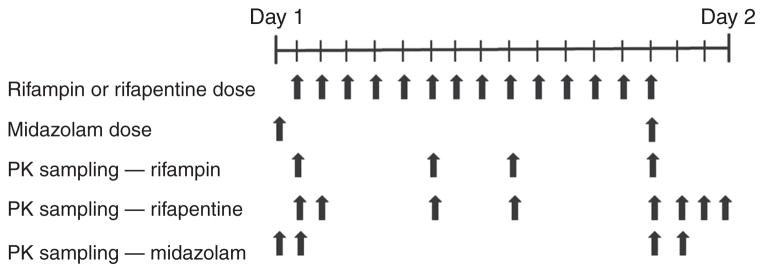
Schematic of the dosing regimen and sample collection for pharmacokinetic testing.
Drug concentration analysis
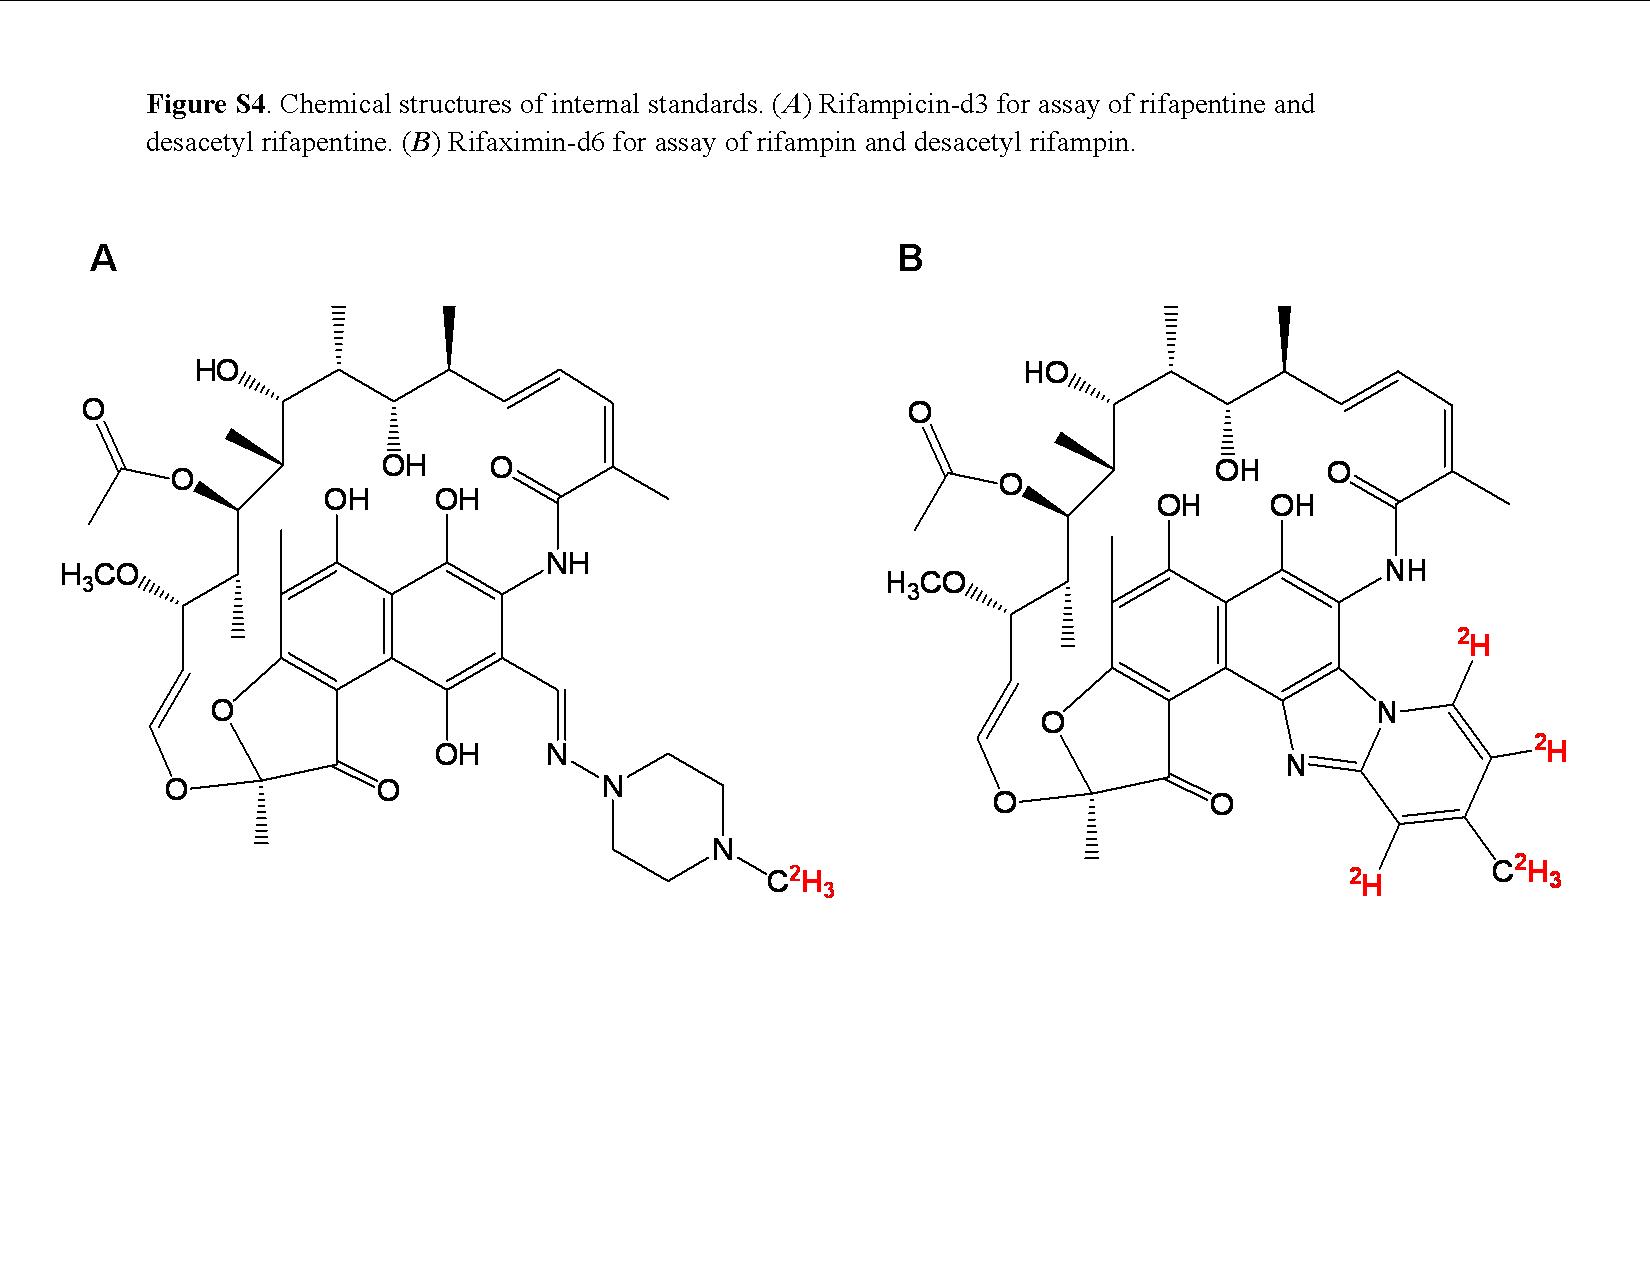
The rifamycins and their desacetyl metabolites (see Supplementary Figure S3 online) were quantitated using a validated liquid chromatography–mass spectrometry assay (see Supplementary Materials and Methods online and Supplementary Figure S4 and Tables S2–S4 online). For RIF and its desacetyl metabolite, this method had substantially less carryover, making it possible to achieve greater sensitivity and larger dynamic range than with previous methods.37 Plasma MDZ and 1-OH-MDZ concentration levels were determined using a validated high-performance liquid chromatography–mass spectrometry procedure that has been previously described.38
Statistical considerations and pharmacokinetic analysis
PK parameters of RPT, RIF, and MDZ (and their metabolites), including AUC, Cmax, T1/2, CL/F, and volume of distribution, were calculated using standard noncompartmental methods and WinNonlin software, version 6.1 (Pharsight, Cary, NC). The values of time to Cmax were computed from the respective concentration–time curves. The mean accumulation index, Rac, namely, the ratio of the multiple-dose AUC0–24 to the single-dose AUC0–24, was calculated for each dosing cohort. For testing the time invariance of the drug kinetics, the mean ratio of the multiple-dose AUC0–24 to the single-dose AUC0–inf (AUC0–24hss/AUC0–infsd) was estimated. Statistical analyses were performed using SAS (version 9.2; SAS Institute, Cary, NC). The Student’s t-test was used for comparison of PK parameters and an analysis of variance test for analyzing the differences in PK parameters among dose cohorts.
Supplementary Material
Acknowledgments
The study team is grateful to the individuals who participated in this study. We appreciate the efforts of the research team at the Drug Development Unit at Johns Hopkins, notably Stephanie Everts and Elizabeth Purdy. We acknowledge the contributions of Namandjé Bumpus and Teresa Parsons from the Clinical Pharmacology Analytical Laboratory at Johns Hopkins to the development of the RPT and RIF (and metabolite) assays, and we thank Angela Kashuba and Stephanie Malone at the University of North Carolina for quantifying MDZ and its metabolite. We also acknowledge Carla Jeffries of the Centers for Disease Control and Prevention for her assistance with graphics. We appreciate the thoughtful input and comments of Chad Heilig and Andy Vernon from the Centers for Disease Control and Prevention and Theresa Shapiro from Johns Hopkins. This study was sponsored by the Centers for Disease Control and Prevention and the CDC Foundation and was supported by the following grants: Institutional Clinical and Translational Science Award National Institutes of Health National Center for Research Resources UL1 RR025005, NIAID P30 50410 (UNC Center for AIDS Research (MDZ assays)), and K23AI080842 (K.E.D.). The ABI-Sciex API5500 Quadrupole-Linear Ion Trap console used for quantification of rifapentine and rifampin was purchased from Grant 1S10 RR 27733 awarded to W.C.H. The Waters Acquity ultraperformance liquid chromatography interfaced with the API5500 was purchased with funds from Pendleton Enterprises awarded to Craig W. Hendrix. Rifapentine (Priftin; Anagni, Italy) was provided by Sanofi-Aventis.
Footnotes
SUPPLEMENTARY MATERIAL is linked to the online version of the paper at http://www.nature.com/cpt
AUTHOR CONTRIBUTIONS
K.E.D. wrote the manuscript, designed research, performed research, and analyzed data. E.E.B.-S. wrote the manuscript, designed research, and analyzed data. M.W. wrote the manuscript and designed research. Y.L. contributed new reagents/analytical tools. E.L.N. wrote the manuscript and designed research. W.C.H. contributed new reagents/analytical tools. E.J.F. performed research. M.T.M. performed research. W.J.B. wrote manuscript and designed research. S.E.D. wrote the manuscript and designed research.
CONFLICT OF INTEREST
The authors declared no conflict of interest.
References
- 1.World Health Organization. Global Tuberculosis Control: WHO report 2010. WHO Press; Geneva, Switzerland: 2010. [Google Scholar]
- 2.Bemer-Melchior P, Bryskier A, Drugeon HB. Comparison of the in vitro activities of rifapentine and rifampicin against Mycobacterium tuberculosis complex. J Antimicrob Chemother. 2000;46:571–576. doi: 10.1093/jac/46.4.571. [DOI] [PubMed] [Google Scholar]
- 3.Rosenthal IM, et al. Daily dosing of rifapentine cures tuberculosis in three months or less in the murine model. PLoS Med. 2007;4:e344. doi: 10.1371/journal.pmed.0040344. [DOI] [PMC free article] [PubMed] [Google Scholar]
- 4.Rosenthal IM, Zhang M, Almeida D, Grosset JH, Nuermberger EL. Isoniazid or moxifloxacin in rifapentine-based regimens for experimental tuberculosis? Am J Respir Crit Care Med. 2008;178:989–993. doi: 10.1164/rccm.200807-1029OC. [DOI] [PMC free article] [PubMed] [Google Scholar]
- 5.Zhang M, et al. Treatment of tuberculosis with rifamycin-containing regimens in immune-deficient mice. Am J Respir Crit Care Med. 2011;183:1254–1261. doi: 10.1164/rccm.201012-1949OC. [DOI] [PMC free article] [PubMed] [Google Scholar]
- 6.Vernon A, Burman W, Benator D, Khan A, Bozeman L. Acquired rifamycin monoresistance in patients with HIV-related tuberculosis treated with once-weekly rifapentine and isoniazid. Tuberculosis Trials Consortium. Lancet. 1999;353:1843–1847. doi: 10.1016/s0140-6736(98)11467-8. [DOI] [PubMed] [Google Scholar]
- 7.Benator D, et al. Tuberculosis Trials Consortium. Rifapentine and isoniazid once a week versus rifampicin and isoniazid twice a week for treatment of drug-susceptible pulmonary tuberculosis in HIV-negative patients: a randomised clinical trial. Lancet. 2002;360:528–534. doi: 10.1016/s0140-6736(02)09742-8. [DOI] [PubMed] [Google Scholar]
- 8.Center for Drug Evaluation and Research. Rifapentine, by Hoechst Marion Roussel. 1998. FDA. New- Drug Application 21-024. [Google Scholar]
- 9.Vital Durand D, Hampden C, Boobis AR, Park BK, Davies DS. Induction of mixed function oxidase activity in man by rifapentine (MDL 473), a long-acting rifamycin derivative. Br J Clin Pharmacol. 1986;21:1–7. doi: 10.1111/j.1365-2125.1986.tb02816.x. [DOI] [PMC free article] [PubMed] [Google Scholar]
- 10.Li AP, et al. Primary human hepatocytes as a tool for the evaluation of structure-activity relationship in cytochrome P450 induction potential of xenobiotics: evaluation of rifampin, rifapentine and rifabutin. Chem Biol Interact. 1997;107:17–30. doi: 10.1016/s0009-2797(97)00071-9. [DOI] [PubMed] [Google Scholar]
- 11.Dooley K, et al. Repeated administration of high-dose intermittent rifapentine reduces rifapentine and moxifloxacin plasma concentrations. Antimicrob Agents Chemother. 2008;52:4037–4042. doi: 10.1128/AAC.00554-08. [DOI] [PMC free article] [PubMed] [Google Scholar]
- 12.Rosenthal IM, et al. Potent twice-weekly rifapentine-containing regimens in murine tuberculosis. Am J Respir Crit Care Med. 2006;174:94–101. doi: 10.1164/rccm.200602-280OC. [DOI] [PMC free article] [PubMed] [Google Scholar]
- 13.Grasela DM, LaCreta FP, Kollia GD, Randall DM, Uderman HD. Open-label, nonrandomized study of the effects of gatifloxacin on the pharmacokinetics of midazolam in healthy male volunteers. Pharmacotherapy. 2000;20:330–335. doi: 10.1592/phco.20.4.330.34878. [DOI] [PubMed] [Google Scholar]
- 14.Mathias AA, West S, Hui J, Kearney BP. Dose-response of ritonavir on hepatic CYP3A activity and elvitegravir oral exposure. Clin Pharmacol Ther. 2009;85:64–70. doi: 10.1038/clpt.2008.168. [DOI] [PubMed] [Google Scholar]
- 15.Ngo N, et al. Identification of a cranberry juice product that inhibits enteric CYP3A-mediated first-pass metabolism in humans. Drug Metab Dispos. 2009;37:514–522. doi: 10.1124/dmd.108.024968. [DOI] [PMC free article] [PubMed] [Google Scholar]
- 16.Weiner M, et al. Effects of tuberculosis, race, and human gene SLCO1B1 polymorphisms on rifampin concentrations. Antimicrob Agents Chemother. 2010;54:4192–4200. doi: 10.1128/AAC.00353-10. [DOI] [PMC free article] [PubMed] [Google Scholar]
- 17.Burman W, et al. Tuberculosis Trials Consortium. Acquired rifamycin resistance with twice-weekly treatment of HIV-related tuberculosis. Am J Respir Crit Care Med. 2006;173:350–356. doi: 10.1164/rccm.200503-417OC. [DOI] [PubMed] [Google Scholar]
- 18.Benator D, et al. Rifapentine and isoniazid once a week versus rifampicin and isoniazid twice a week for treatment of drug-susceptible pulmonary tuberculosis in HIV-negative patients: a randomised clinical trial. Lancet. 2002;360:528–534. doi: 10.1016/s0140-6736(02)09742-8. [DOI] [PubMed] [Google Scholar]
- 19.Weiner M, et al. Tuberculosis Trials Consortium. Association between acquired rifamycin resistance and the pharmacokinetics of rifabutin and isoniazid among patients with HIV and tuberculosis. Clin Infect Dis. 2005;40:1481–1491. doi: 10.1086/429321. [DOI] [PubMed] [Google Scholar]
- 20.Nuermberger E, Rosenthal I, Zhang M, Grosset J. Is it possible to cure TB in weeks instead of months? Int J Tuberc Lung Dis. 2007;11 (suppl 1):S167. [Google Scholar]
- 21.Gumbo T, et al. Concentration-dependent Mycobacterium tuberculosis killing and prevention of resistance by rifampin. Antimicrob Agents Chemother. 2007;51:3781–3788. doi: 10.1128/AAC.01533-06. [DOI] [PMC free article] [PubMed] [Google Scholar]
- 22.Rowland M, Tozer TN. Clinical Pharmacokinetics: Concepts and Applications. Vol. 22. Lippincott, Williams and Wilkins; Philadelphia, PA: 1995. Dose and time dependencies; pp. 394–423. [Google Scholar]
- 23.Acocella G. Clinical pharmacokinetics of rifampicin. Clin Pharmacokinet. 1978;3:108–127. doi: 10.2165/00003088-197803020-00002. [DOI] [PubMed] [Google Scholar]
- 24.Dorman S, et al. A phase II study of a rifapentine-containing regimen for intensive phase treatment of pulmonary tuberculosis: preliminary results for Tuberculosis Trials Consortium Study 29: Abstract A6413. American Thoracic Society Annual Meeting; Denver, CO. 2011. [Google Scholar]
- 25.Langdon G, Wilkins J, McFadyen L, McIlleron H, Smith P, Simonsson US. Population pharmacokinetics of rifapentine and its primary desacetyl metabolite in South African tuberculosis patients. Antimicrob Agents Chemother. 2005;49:4429–4436. doi: 10.1128/AAC.49.11.4429-4436.2005. [DOI] [PMC free article] [PubMed] [Google Scholar]
- 26.Loos U, Musch E, Jensen JC, Schwabe HK, Eichelbaum M. Influence of the enzyme induction by rifampicin on its presystemic metabolism. Pharmacol Ther. 1987;33:201–204. doi: 10.1016/0163-7258(87)90052-0. [DOI] [PubMed] [Google Scholar]
- 27.Loos U, Musch E, Jensen JC, Mikus G, Schwabe HK, Eichelbaum M. Pharmacokinetics of oral and intravenous rifampicin during chronic administration. Klin Wochenschr. 1985;63:1205–1211. doi: 10.1007/BF01733779. [DOI] [PubMed] [Google Scholar]
- 28.Chen J, Raymond K. Roles of rifampicin in drug-drug interactions: underlying molecular mechanisms involving the nuclear pregnane X receptor. Ann Clin Microbiol Antimicrob. 2006;5:3. doi: 10.1186/1476-0711-5-3. [DOI] [PMC free article] [PubMed] [Google Scholar]
- 29.Martin P, Riley R, Back DJ, Owen A. Comparison of the induction profile for drug disposition proteins by typical nuclear receptor activators in human hepatic and intestinal cells. Br J Pharmacol. 2008;153:805–819. doi: 10.1038/sj.bjp.0707601. [DOI] [PMC free article] [PubMed] [Google Scholar]
- 30.Xu C, Wang X, Staudinger JL. Regulation of tissue-specific carboxylesterase expression by pregnane x receptor and constitutive androstane receptor. Drug Metab Dispos. 2009;37:1539–1547. doi: 10.1124/dmd.109.026989. [DOI] [PMC free article] [PubMed] [Google Scholar]
- 31.Acocella G, Mattiussi R, Segre G. Multicompartmental analysis of serum, urine and bile concentrations of rifampicin and desacetyl-rifampicin in subjects treated for one week. Pharmacol Res Commun. 1978;10:271–288. doi: 10.1016/s0031-6989(78)80021-6. [DOI] [PubMed] [Google Scholar]
- 32.Watkins PB. Noninvasive tests of CYP3A enzymes. Pharmacogenetics. 1994;4:171–184. doi: 10.1097/00008571-199408000-00001. [DOI] [PubMed] [Google Scholar]
- 33.Tsunoda SM, Velez RL, von Moltke LL, Greenblatt DJ. Differentiation of intestinal and hepatic cytochrome P450 3A activity with use of midazolam as an in vivo probe: effect of ketoconazole. Clin Pharmacol Ther. 1999;66:461–471. doi: 10.1016/S0009-9236(99)70009-3. [DOI] [PubMed] [Google Scholar]
- 34.US Department of Health and Human Services. Guidance for Industry. In Vivo Drug Metabolism/Drug Interaction Studies: Study Design, Data Analysis, and Recommendations for Dosing and Labelling. 2012;2009 [Google Scholar]
- 35.Backman JT, Olkkola KT, Neuvonen PJ. Rifampin drastically reduces plasma concentrations and effects of oral midazolam. Clin Pharmacol Ther. 1996;59:7–13. doi: 10.1016/S0009-9236(96)90018-1. [DOI] [PubMed] [Google Scholar]
- 36.Chung E, Nafziger AN, Kazierad DJ, Bertino JS., Jr Comparison of midazolam and simvastatin as cytochrome P450 3A probes. Clin Pharmacol Ther. 2006;79:350–361. doi: 10.1016/j.clpt.2005.11.016. [DOI] [PubMed] [Google Scholar]
- 37.de Velde F, Alffenaar JW, Wessels AM, Greijdanus B, Uges DR. Simultaneous determination of clarithromycin, rifampicin and their main metabolites in human plasma by liquid chromatography-tandem mass spectrometry. J Chromatogr B Analyt Technol Biomed Life Sci. 2009;877:1771–1777. doi: 10.1016/j.jchromb.2009.04.038. [DOI] [PubMed] [Google Scholar]
- 38.Dumond JB, et al. A phenotype-genotype approach to predicting CYP450 and P-glycoprotein drug interactions with the mixed inhibitor/inducer tipranavir/ritonavir. Clin Pharmacol Ther. 2010;87:735–742. doi: 10.1038/clpt.2009.253. [DOI] [PMC free article] [PubMed] [Google Scholar]
Associated Data
This section collects any data citations, data availability statements, or supplementary materials included in this article.